Metabolomic Analysis of the Effect of Freezing on Leaves of Malus sieversii (Ledeb.) M.Roem. Histoculture Seedlings
- PMID: 38203481
- PMCID: PMC10778857
- DOI: 10.3390/ijms25010310
Metabolomic Analysis of the Effect of Freezing on Leaves of Malus sieversii (Ledeb.) M.Roem. Histoculture Seedlings
Abstract
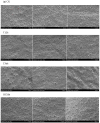
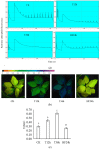
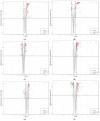
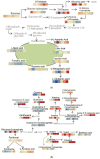
Malus sieversii (Ledeb.) M.Roem. is the ancestor of cultivated apples, and is an excellent germplasm resource with high resistance to cold. Artificial refrigerators were used to simulate the low temperature of -3 °C to treat Malus sieversii (Ledeb.) M.Roem. histoculture seedlings. Observations were performed to find the effects of freezing stress on the status of open or closed stomata, photosystems, and detection of metabolomic products in leaves of Malus sieversii (Ledeb.) M.Roem. histoculture seedlings. The percentage of closed stomata in the Malus sieversii (Ledeb.) M.Roem. histoculture seedlings increased, the maximum fluorescence (Fm') excited by a strong light (saturating pulse) was weakened relative to the real-time fluorescence in its vicinity, and the quantum yield of unregulated energy dissipation was increased in PSII under freezing stress. The metabolites in the leaves of the Malus sieversii (Ledeb. M.Roem.) histoculture seedlings were analyzed by ultra-performance liquid chromatography-tandem mass spectrometry using CK, T12h, T36 h, and HF24h. Results demonstrated that cold stress in the Malus sieversii (Ledeb.) M.Roem. histoculture seedlings led to wilting, leaf stomatal closure, and photosystem damage. There were 1020 metabolites identified as lipids (10.2%), nucleotides and their derivatives (5.2%), phenolic acids (19.12%), flavonoids (24.51%), amino acids and their derivatives (7.75%), alkaloids (5.39%), terpenoids (8.24%), lignans (3.04%), organic acids (5.88%), and tannins (0.88%). There were 110 differential metabolites at CKvsT12h, 113 differential metabolites at CKvsT36h, 87 differential metabolites at T12hvsT36h, 128 differential metabolites at CKvsHF24h, 121 differential metabolites at T12hvsHF24h, and 152 differential metabolites at T36hvsHF24h. The differential metabolites in the leaves of the Malus sieversii (Ledeb.) M.Roem. seedlings grown under low-temperature stress mainly involved glycolysis, amino acid metabolism, lipid metabolism, pyrimidine metabolism, purine metabolism, and secondary metabolite metabolism. The Malus sieversii (Ledeb.) M.Roem. seedlings responded to the freezing stress by coordinating with each other through these metabolic pathways. The metabolic network of the leaves of the Malus sieversii (Ledeb.) M.Roem. histoculture seedlings under low temperature stress was also proposed based on the above pathways to deepen understanding of the response of metabolites of Malus sieversii (Ledeb.) M.Roem. to low-temperature stress and to lay a theoretical foundation for the development and utilization of Malus sieversii (Ledeb.) M.Roem. cultivation resources.
Keywords: Malus sieversii (Ledeb.) M.Roem. histoculture seedlings; freezing stress; metabolomics.
Conflict of interest statement
The authors declare no conflict of interest.
Figures


Similar articles
-
DIA-Based Quantitative Proteomics in the Flower Buds of Two Malus sieversii (Ledeb.) M. Roem Subtypes at Different Overwintering Stages.Int J Mol Sci. 2024 Mar 4;25(5):2964. doi: 10.3390/ijms25052964. Int J Mol Sci. 2024. PMID: 38474210 Free PMC article.
-
Genetic diversity of volatile components in Xinjiang Wild Apple (Malus sieversii).J Genet Genomics. 2007 Feb;34(2):171-9. doi: 10.1016/S1673-8527(07)60018-6. J Genet Genomics. 2007. PMID: 17469789
-
Leaf physiological and endophytic microbial community characteristics and interactions of different scions grafted onto Malus sieversii.Tree Physiol. 2025 May 2;45(5):tpaf042. doi: 10.1093/treephys/tpaf042. Tree Physiol. 2025. PMID: 40188481
-
Malus sieversii: the origin, flavonoid synthesis mechanism, and breeding of red-skinned and red-fleshed apples.Hortic Res. 2018 Oct 15;5:70. doi: 10.1038/s41438-018-0084-4. eCollection 2018. Hortic Res. 2018. PMID: 30345062 Free PMC article. Review.
-
Isolation and characterization of dehydration-responsive element-binding factor 2C (MsDREB2C) from Malus sieversii Roem.Plant Cell Physiol. 2013 Sep;54(9):1415-30. doi: 10.1093/pcp/pct087. Epub 2013 Jun 11. Plant Cell Physiol. 2013. PMID: 23757363
References
-
- Volk G.M., Henk A.D., Richards C.M., Forsline P.L., Chao C.T. Malus sieversii: A Diverse Central Asian Apple Species in the USDA-ARS National Plant Germplasm System. HortScience. 2013;48:1440–1444. doi: 10.21273/HORTSCI.48.12.1440. - DOI
-
- Li Y.N. Researches of Germplasm Resources of MalusMill. China Agriculture Press; Beijing, China: 2001. pp. 20–134. - DOI
-
- Yan G.R., Long H., Song W.Q., Chen R.Y. Genetic polymorphism of Malus sieversii populations in Xinjiang, China. Genet. Resour. Crop Evol. 2008;55:171–181. doi: 10.1007/s10722-007-9226-5. - DOI
-
- Xu J.I., Liu G., Ma P., Huang Y.P., Yang Y.L. Research Progress of Adversity Response Mechanism of Malus sieversii. Shandong Agric. Sci. 2014;46:4. doi: 10.3969/j.issn.1001-4942.2014.08.037. - DOI
MeSH terms
Grants and funding
LinkOut - more resources
Full Text Sources
Research Materials

