

Comparative 4D Label-Free Quantitative Proteomic Analysis of Bombus terrestris Provides Insights into Proteins and Processes Associated with Diapause
- PMID: 38203496
- PMCID: PMC10778897
- DOI: 10.3390/ijms25010326
Comparative 4D Label-Free Quantitative Proteomic Analysis of Bombus terrestris Provides Insights into Proteins and Processes Associated with Diapause
Abstract
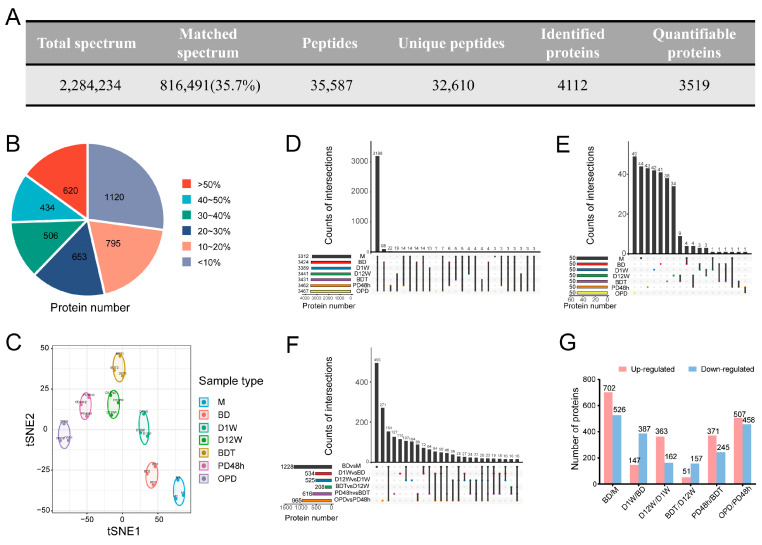
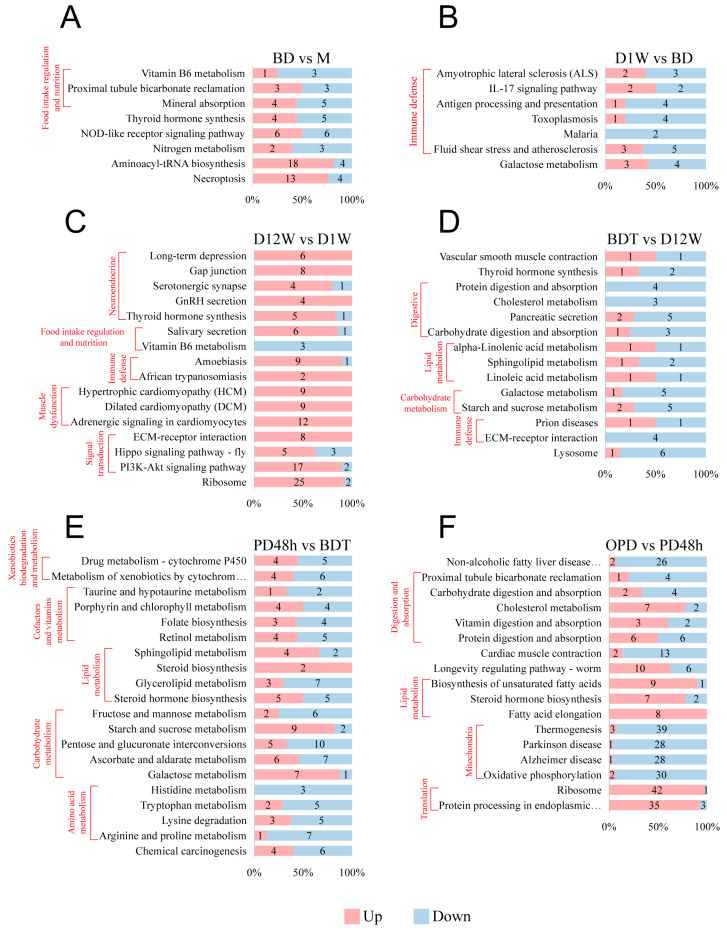
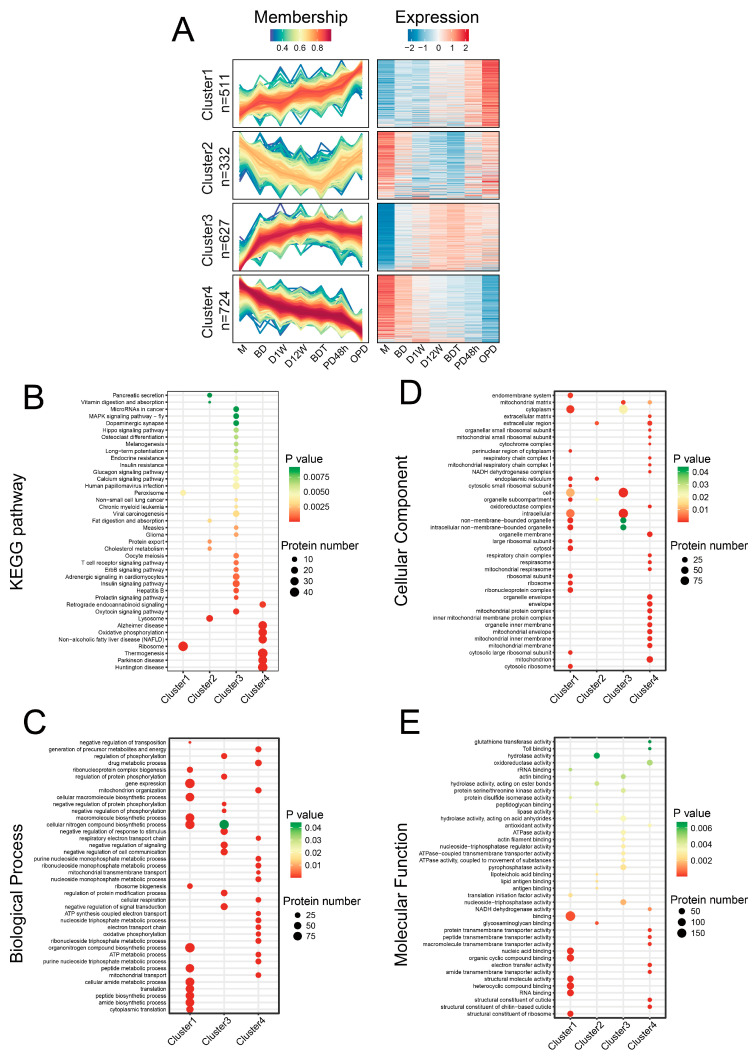
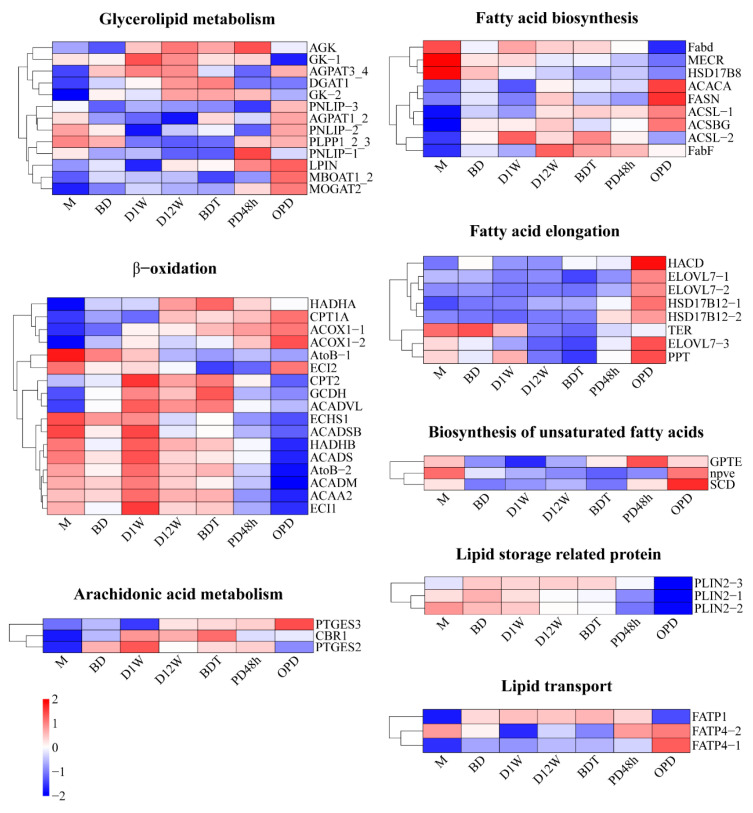
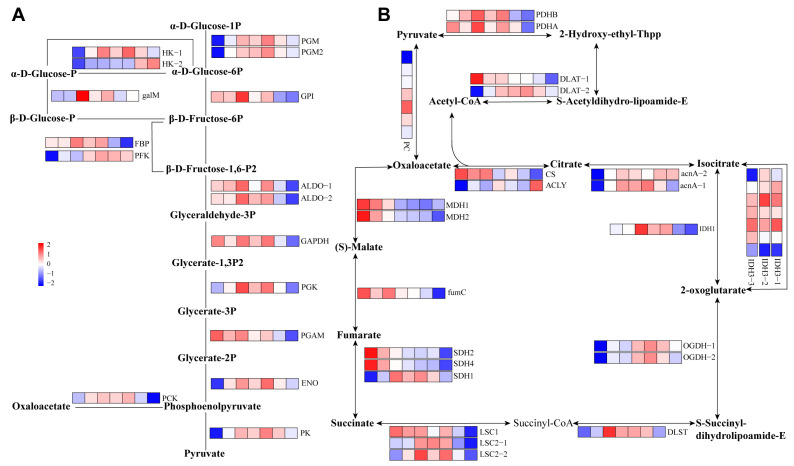
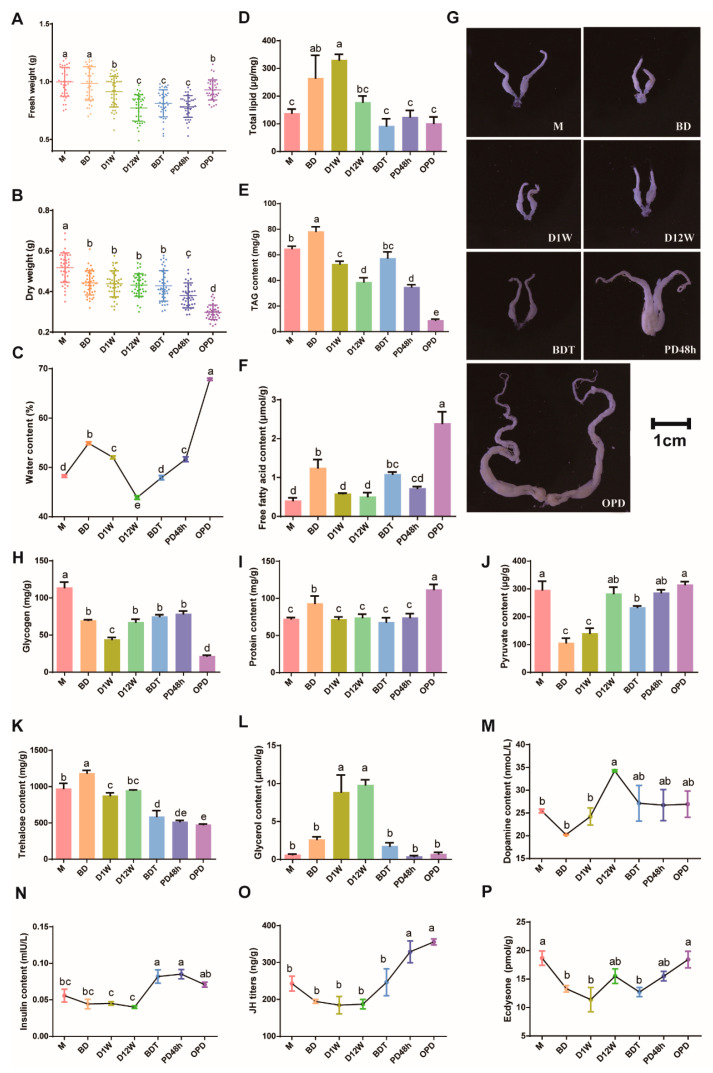
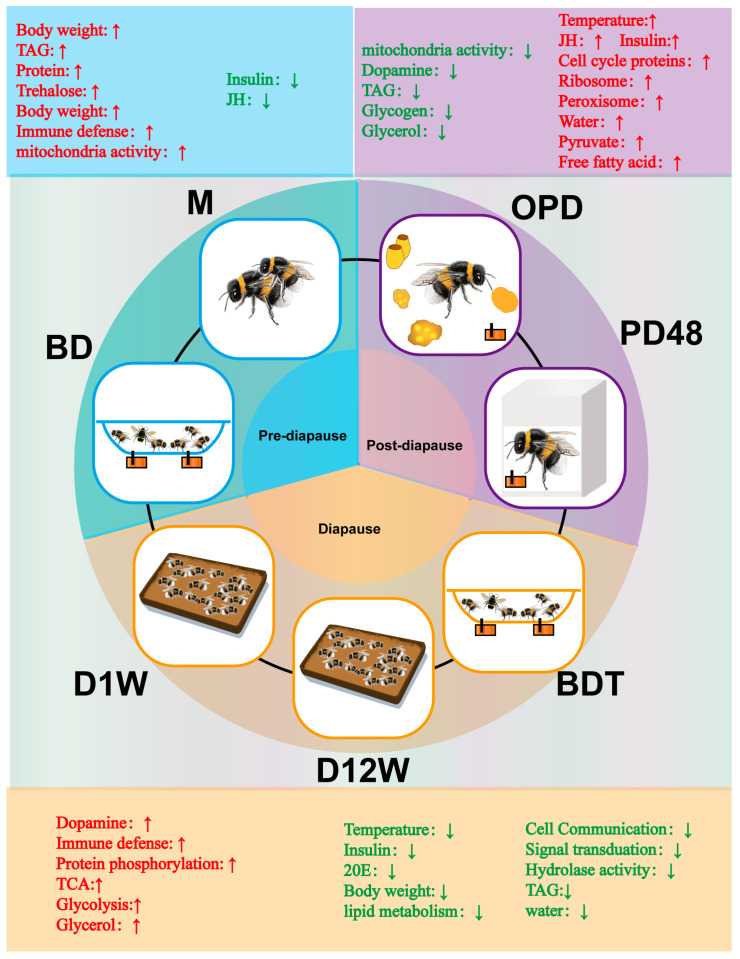
Diapause, an adaptative strategy for survival under harsh conditions, is a dynamic multi-stage process. Bombus terrestris, an important agricultural pollinator, is declining in the wild, but artificial breeding is possible by imitating natural conditions. Mated queen bees enter reproductive diapause in winter and recover in spring, but the regulatory mechanisms remain unclear. Herein, we conducted a comparative 4D label-free proteomic analysis of queen bees during artificial breeding at seven timepoints, including pre-diapause, diapause, and post-diapause stages. Through bioinformatics analysis of proteomic and detection of substance content changes, our results found that, during pre-diapause stages, queen bees had active mitochondria with high levels of oxidative phosphorylation, high body weight, and glycogen and TAG content, all of which support energy consumption during subsequent diapause. During diapause stages, body weight and water content were decreased but glycerol increased, contributing to cold resistance. Dopamine content, immune defense, and protein phosphorylation were elevated, while fat metabolism, protein export, cell communication, signal transduction, and hydrolase activity decreased. Following diapause termination, JH titer, water, fatty acid, and pyruvate levels increased, catabolism, synaptic transmission, and insulin signaling were stimulated, ribosome and cell cycle proteins were upregulated, and cell proliferation was accelerated. Meanwhile, TAG and glycogen content decreased, and ovaries gradually developed. These findings illuminate changes occurring in queen bees at different diapause stages during commercial production.
Keywords: 4D label-free quantitative proteomics; Bombus terrestris; diapause; post-diapause; pre-diapause; protein abundance.
Conflict of interest statement
The authors have declared no conflicts of interest.
Figures
Similar articles
-
Integrative Proteomic and Phosphoproteomic Analyses Revealed Complex Mechanisms Underlying Reproductive Diapause in Bombus terrestris Queens.Insects. 2022 Sep 23;13(10):862. doi: 10.3390/insects13100862. Insects. 2022. PMID: 36292811 Free PMC article.
-
Hormonal Regulation of Reproductive Diapause That Occurs in the Year-Round Mass Rearing of Bombus terrestris Queens.J Proteome Res. 2021 May 7;20(5):2240-2250. doi: 10.1021/acs.jproteome.0c00776. Epub 2021 Mar 29. J Proteome Res. 2021. PMID: 33779174
-
Mating precedes selective immune priming which is maintained throughout bumblebee queen diapause.BMC Genomics. 2019 Dec 10;20(1):959. doi: 10.1186/s12864-019-6314-9. BMC Genomics. 2019. PMID: 31823732 Free PMC article.
-
Juvenile hormone functions as a metabolic rate accelerator in bumble bees (Bombus terrestris).Horm Behav. 2021 Nov;136:105073. doi: 10.1016/j.yhbeh.2021.105073. Epub 2021 Oct 9. Horm Behav. 2021. PMID: 34634696
-
Endocrine and enzymatic shifts during insect diapause: a review of regulatory mechanisms.Front Physiol. 2025 Mar 14;16:1544198. doi: 10.3389/fphys.2025.1544198. eCollection 2025. Front Physiol. 2025. PMID: 40161974 Free PMC article. Review.
Cited by
-
Analysis of full length transcriptome and resistance characteristics of Atraphaxis bracteata under drought.Sci Rep. 2025 Jan 4;15(1):807. doi: 10.1038/s41598-024-80831-2. Sci Rep. 2025. PMID: 39755718 Free PMC article.
-
The expression of ERAP1 is favorable for the prognosis and immunotherapy in colorectal cancer: a study based on the bioinformatic and immunohistochemical analysis.Clin Transl Oncol. 2025 Feb;27(2):549-566. doi: 10.1007/s12094-024-03520-6. Epub 2024 Jul 15. Clin Transl Oncol. 2025. PMID: 39009862
-
Deciphering the Proteome and Phosphoproteome of Peanut (Arachis hypogaea L.) Pegs Penetrating into the Soil.Int J Mol Sci. 2025 Jan 14;26(2):634. doi: 10.3390/ijms26020634. Int J Mol Sci. 2025. PMID: 39859350 Free PMC article.
-
NLRP3 activation promotes cGAS/STING signaling and antitumor immunity by colorectal cancer cells.Cancer Immunol Immunother. 2025 Jun 7;74(8):238. doi: 10.1007/s00262-025-04088-y. Cancer Immunol Immunother. 2025. PMID: 40481953 Free PMC article.
-
LINC02266 promotes proliferation and metastasis and inhibits ferroptosis of gastric cancer cells by regulating AKT/ACSL4 pathway.Mol Cell Biochem. 2025 Jul 19. doi: 10.1007/s11010-025-05354-4. Online ahead of print. Mol Cell Biochem. 2025. PMID: 40682711
References
MeSH terms
Substances
Grants and funding
LinkOut - more resources
Full Text Sources
