. 2023 Dec 26;25(1):339.
doi: 10.3390/ijms25010339.

COPI Vesicle Disruption Inhibits Mineralization via mTORC1-Mediated Autophagy

Affiliations

COPI Vesicle Disruption Inhibits Mineralization via mTORC1-Mediated Autophagy

Jiaming Nie et al. Int J Mol Sci. .

Abstract

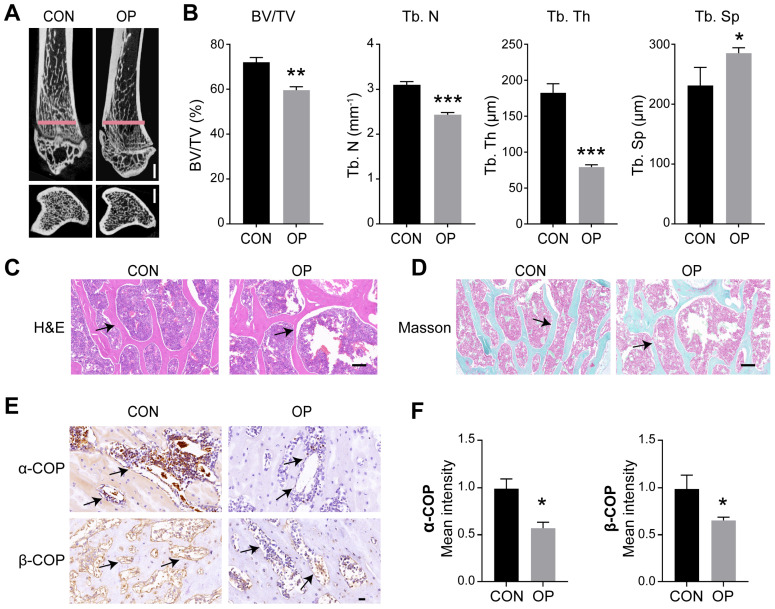
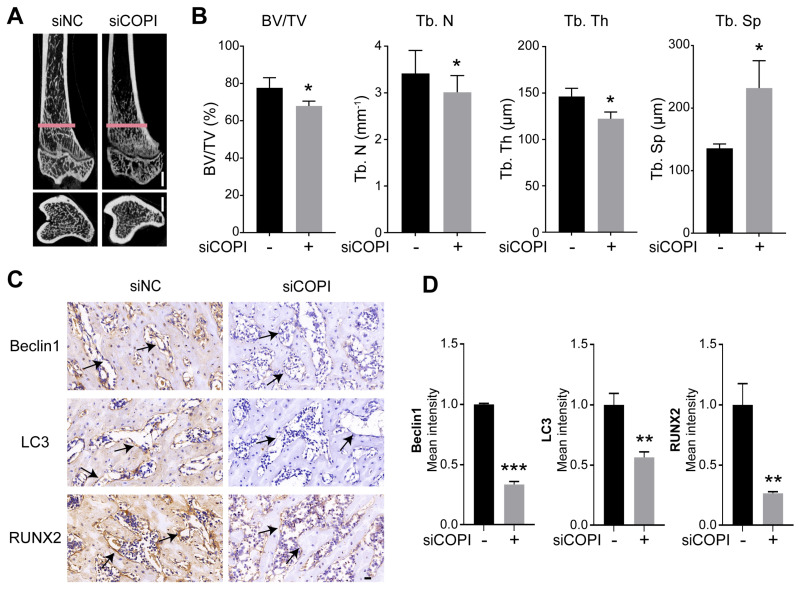
Bone mineralization is a sophisticated regulated process composed of crystalline calcium phosphate and collagen fibril. Autophagy, an evolutionarily conserved degradation system, whereby double-membrane vesicles deliver intracellular macromolecules and organelles to lysosomes for degradation, has recently been shown to play an essential role in mineralization. However, the formation of autophagosomes in mineralization remains to be determined. Here, we show that Coat Protein Complex I (COPI), responsible for Golgi-to-ER transport, plays a pivotal role in autophagosome formation in mineralization. COPI vesicles were increased after osteoinduction, and COPI vesicle disruption impaired osteogenesis. Mechanistically, COPI regulates autophagy activity via the mTOR complex 1 (mTORC1) pathway, a key regulator of autophagy. Inhibition of mTOR1 rescues the impaired osteogenesis by activating autophagy. Collectively, our study highlights the functional importance of COPI in mineralization and identifies COPI as a potential therapeutic target for treating bone-related diseases.

Keywords: COPI vesicle; autophagy; mineralization.


Conflict of interest statement

The authors declare no conflict of interest.

Figures

Figure 1
Figure 1
COPI vesicles are decreased in osteoporosis. (A,B) Representative micro-CT images (A) and quantitative analysis of bone mass and bone microarchitecture parameters (B) in tibia from CON (control) and OP (osteoporosis) rats. Scale bar: 1 mm. n = 3 per group. BV/TV, bone volume/tissue volume; Tb. Th, trabecular thickness; Tb. N, trabecular number; Tb. Sp, trabecular separation. Scale bar: 2 mm. (C,D) H&E staining (C) and Masson staining (D) of tibia from the CON and OP rats. Scale bar: 500 μm. Arrows: bone trabecula. (E,F) Representative immunohistochemical images of proximal tibia sections’ staining with COPI proteins (α-COP and β-COP) and quantitative analysis. Scale bar: 20 μm. n = 3 per group. Arrows: osteoblasts. Data are means ± SD, and p values were quantified using t test. * p < 0.05; ** p < 0.01, *** p < 0.001.
Figure 2
Figure 2
BFA-induced COPI vesicle disruption inhibits osteogenic effect. (A,B) Representative immunofluorescence images staining for β-COP (red) and the quantitative analysis of β-COP expression in control (CON) or osteogenic differentiation medium (ODM) condition for 3 d. The nucleus was highlighted by DAPI. Scale bar: 5 μm. n = 5 per group. (C,D) Western blot of COPI proteins (α-COP and β-COP) and quantitative analysis. n = 3 per group. (E,F) Representative immunofluorescence images staining for β-COP (red) and the quantitative analysis of β-COP expression with or without Brefeldin A (BFA) in ODM condition for 3 d. The nucleus was highlighted by DAPI. Scale bar: 5 μm. n = 5 per group. (G,H) Western blot of COPI proteins (α-COP and β-COP) and quantitative analysis. n = 3 per group. (I,J) ALP staining (I) and the quantitative analysis (J). Scale bar: 150 μm. n = 3 per group. (K,L) Western blot of mineralization-related proteins and quantitative analysis. n = 3 per group. Data are means ± SD, and p values were quantified using t test. * p < 0.05; ** p < 0.01, *** p < 0.001.
Figure 3
Figure 3
COPI dysfunction results in impaired autophagy flux. (AC) Representative immunofluorescence images staining for FIP200 (green) and β-COP (red), the number of FIP200 puncta (B) and the percentage of FIP200 puncta colocation with β-COP puncta (C). Scale bar: 10 μm. n = 10 per group. (DF) Representative immunofluorescence images’ staining for WIPI2 (green) and β-COP (red), the number of WIPI2 puncta (E) and the percentage of WIPI2 puncta colocation with β-COP puncta (F). Scale bar: 10 μm. n = 10 per group. (GI) Representative immunofluorescence images of GFP-LC3 plasmid assay of BFA-treated cells and siCOPI cells and the quantitative analysis of LC3-positive puncta (I) with or without Bafilomycin A1 (Baf-A1). Scale bar: 5 μm. n = 10 per group. (J,K) Western blot and quantitative analysis of autophagic proteins (BECLIN1 and LC3) in BFA-treated cell. n = 3 per group. (L,M) Western blot and quantitative analysis of autophagic proteins (BECLIN1 and LC3) in siCOPI cells. n = 3 per group. Data are means ± SD, and p values were quantified using t test and one-way ANOVA with Tukey’s post hoc test. * p < 0.05; ** p < 0.01, *** p < 0.001.
Figure 4
Figure 4
COPI affects autophagy via the mTORC1 pathway. (A,B) Representative immunofluorescence images of GFP-LC3 plasmid assay (A) and the quantitative analysis of LC3-positive puncta (B) with or without rapamycin (Rapa). Scale bar: 5 μm. n = 10 per group. (C,D) Western blot and quantitative analysis of autophagic proteins in BFA-treated cells. n = 3 per group. (E,F) Western blot and quantitative analysis of autophagic proteins in siCOPI cells. n = 3 per group. Data are means ± SD, and p values were quantified using one-way ANOVA with Tukey’s post hoc test. * p < 0.05; ** p < 0.01, *** p < 0.001.
Figure 5
Figure 5
Inhibition of mTORC1 partially rescues the suppression of COPI vesicle disruption of osteogenic effects. (A,B) ALP staining in BFA-treated cells and siCOPI cells (A) and the quantitative analysis (B). Scale bar: 75 μm. n = 3 per group. (C,D) Alizarin red-S staining in BFA-treated cells and siCOPI cells (C) and the absorbance values of alizarin red-S staining were measured at OD560nm (D). Scale bar: 75 μm. n = 3 per group. (E) Western blot and quantitative analysis of osteogenic proteins ALP and RUNX2 in BFA-treated cells. n = 3 per group. (F) Schematic diagram of the role of COPI on autophagy in mineralization and rapamycin-rescued system. Data are means ± SD, and p values were quantified using one-way ANOVA with Tukey’s post hoc test. * p < 0.05; ** p < 0.01, *** p < 0.001.
Figure 6
Figure 6
Knockdown of COPI results in bone loss and decreased autophagic activity. (A,B) Representative micro-CT images (A) and quantitative analysis of bone mass and bone microarchitecture parameters (B) in tibia from siNC and siCOPI rats. Scale bar: 1 mm. n = 3 per group. BV/TV, bone volume/tissue volume; Tb. Th, trabecular thickness; Tb. N, trabecular number; Tb. Sp, trabecular separation. Scale bar: 2 mm. (C,D) Representative immunohistochemical images of proximal tibia sections’ staining with autophagic proteins (Beclin1 and LC3) and mineralization-related protein RUNX2 and quantitative analysis. Scale bar: 20 μm. n = 3 per group. Arrows: osteoblasts. Data are means ± SD, and p values were quantified using t test. * p < 0.05; ** p < 0.01, *** p < 0.001.

Similar articles

Cited by

References

    1. Murshed M. Mechanism of Bone Mineralization. Cold Spring Harb. Perspect. Med. 2018;8:a031229. doi: 10.1101/cshperspect.a031229. - DOI - PMC - PubMed
    1. Yin X., Zhou C., Li J., Liu R., Shi B., Yuan Q., Zou S. Autophagy in bone homeostasis and the onset of osteoporosis. Bone Res. 2019;7:28. doi: 10.1038/s41413-019-0058-7. - DOI - PMC - PubMed
    1. Sözen T., Özışık L., Başaran N.Ç. An overview and management of osteoporosis. Eur. J. Rheumatol. 2017;4:46–56. doi: 10.5152/eurjrheum.2016.048. - DOI - PMC - PubMed
    1. Muramatsu T., Kashiwagi S., Ishizuka H., Matsuura Y., Furusawa M., Kimura M., Shibukawa Y. Alkaline extracellular conditions promote the proliferation and mineralization of a human cementoblast cell line. Int. Endod. J. 2019;52:639–645. doi: 10.1111/iej.13044. - DOI - PubMed
    1. Qi Y., Wang H., Chen X., Zhu Y. The role of TGF-β1/Smad3 signaling pathway and oxidative stress in the inhibition of osteoblast mineralization by copper chloride. Environ. Toxicol. Pharmacol. 2021;84:103613. doi: 10.1016/j.etap.2021.103613. - DOI - PubMed

Substances