. 2023 Dec 27;25(1):372.
doi: 10.3390/ijms25010372.

Polyacrylic-Coated Solid Nanoparticles Increase the Aquaporin Permeability to Hydrogen Peroxide

Affiliations

Polyacrylic-Coated Solid Nanoparticles Increase the Aquaporin Permeability to Hydrogen Peroxide

Giorgia Pellavio et al. Int J Mol Sci. .

Abstract

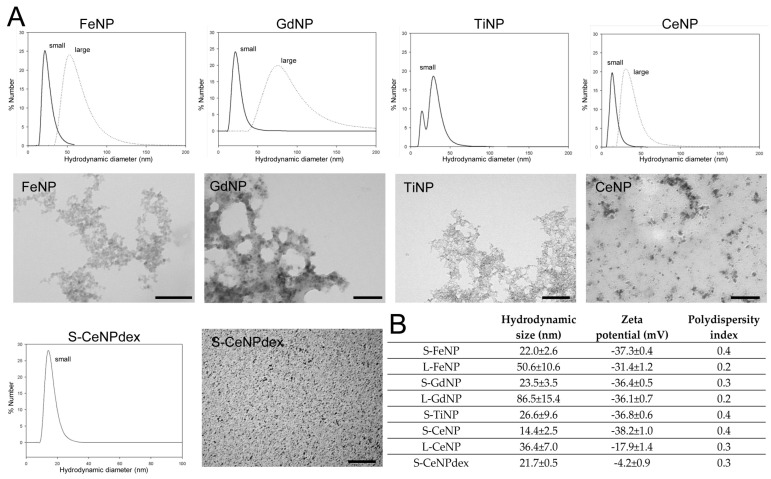
Aquaporins (AQPs) allow the diffusion of hydrogen peroxide (H2O2) and act as ROS scavenging systems, which are important for controlling the redox state of cells. Recently, cerium oxide nanoparticles were found to increase the water and H2O2 permeability by modulating AQPs. To further analyze the action of nanoparticles (NPs) on AQP, we examined the effect of the NPs presenting different core compositions (CeO2, Gd2O3, Fe3O4, and TiO2), hydrodynamic sizes, and surface functionalization. The NPs produced an increase in H2O and H2O2 permeability as a general trend. The hydrodynamic sizes of the NPs in the range of 22-100 nm did not produce any significant effect. The chemical nature of the NPs' core did not modify the effect and its intensity. On the other hand, the NPs' functionalized surface plays a major role in influencing both water and H2O2 permeability. The results suggest that NPs can play a significant role in controlling oxidative stress in cells and might represent an innovative approach in the treatment of a number of pathologies associated with an increased oxidative status.

Keywords: CeO2NP; Fe3O4NP; Gd2O3NP; HeLa; HyPer7 biosensor; TiO2NP; oxidative stress; peroxiporin; water channels.


Conflict of interest statement

The authors declare no conflict of interest.

Figures

Figure 1
Figure 1
(A) Hydrodynamic size graph (distribution by number) of both small and large FeNPs, GdNPs, TiNPs, and CeNPs and dextran-coated CeNPs (S-CeNPdexs) with the corresponding TEM images. Note that the aggregate aspect of the crystals visible in the TEM images is the result of the sample preparation and does not reflect the real aggregation state in the original suspension. Bars, 100 nm. (B) Summary of hydrodynamic size, zeta potential, and polydispersity index values for all nanoparticles.
Figure 2
Figure 2
Effect of S-FeNPs (A), L-FeNPs (B), S-GdNPs (C), L-GdNPs (D), S-CeNPs (E), L-CeNPs (F), S-TiNPs (G), and S-CeNPdexs (H) on the cell viability of HeLa. Cells were incubated for 2 h with nanoparticles diluted 1:10, 1:20, 1:50, 1:100, and 1:200 in PBS. Cell viability was calculated by measuring the blue (live cells; Ex 360nm–Em 460 nm) over the green (dead cells; Ex 420 nm–Em 535 nm) fluorescence signal ratio in treated cells versus untreated cells (Ctr). Ratio values expressed in percentage (normalized to the total protein content) are the mean ± S.E.M. of cells for each of the three different experiments. a, p < 0.05 versus Ctr; b, p < 0.001 versus Ctr (ANOVA, followed by Dunnett’s multiple comparison test). Concentration of the NPs’ stock solutions: S-FeNP and L-FeNP, 5.4 mg/mL; S-GdNP and L-GdNP, 6.4 mg/mL; S-CeNP (E) and L-CeNP, 6.6 mg/mL; S-TiNP, 6.0 mg/mL; S-CeNPdex, 6.5 mg/mL.
Figure 3
Figure 3
Hydrogen peroxide and water permeability in HeLa cells treated with S-FeNPs. H2O2 permeability in HeLa control cells (Ctr) and in HeLa cells treated for 2 h (S-FeNP) was evaluated after the addition of 50 μM H2O2. (A) Representative images extracted from videos showing the kinetics of H2O2 permeability in control and treated cells. The increased HyPer7-NES fluorescence is shown in pseudo color (upper panel; the scale used is indicated in the insert). (B) Representative time course of H2O2 fluorescence into control and treated cells. (C) Bars represent the maximal H2O2 fluorescence, which was obtained by computerized least squares regression, fitting the experimental points of the time courses of H2O2 transported curves with a one-phase exponential association equation (GraphPad Prism 4.00 2003). Maximal fluorescence values are means ± S.E.M. of 3 different experiments. a, p < 0.0005 (Student’s t-test). (D) Control cells (Ctr) and cells incubated with nanoparticles for 2 h (S-FeNP) were exposed to an osmotic gradient of 150 mOsm. Bars represent the osmotic water permeability of HeLa cells expressed as a percent of k relative. Values are means ± S.E.M. of 10–20 single shots for each of the 3 different experiments. b, p = 0.0176 (Student’s t-test).
Figure 4
Figure 4
Hydrogen peroxide and water permeability in HeLa cells treated with L-FeNP. H2O2 permeability in HeLa control cells (Ctr) and HeLa cells treated for 2 h (L-FeNP) was evaluated after the addition of 50 μM H2O2. (A,B) See the legend of Figure 3. (C) Bars represent the maximal H2O2 fluorescence, which was obtained by computerized least squares regression, fitting the experimental points of the time courses of H2O2 transported curves with a one-phase exponential association equation (GraphPad Prism 4.00 2003). Maximal fluorescence values are means ± S.E.M. of 3 different experiments. a, p < 0.0001 (Student’s t-test). (D) Control cells (Ctr) and cells incubated with nanoparticles for 2 h (L-FeNP) were exposed to an osmotic gradient of 150 mOsm. Bars represent the osmotic water permeability of HeLa cells expressed as a percent of k relative. Values are means ± S.E.M. of 10–20 single shots for each of the 3 different experiments (Student’s t-test).
Figure 5
Figure 5
Hydrogen peroxide and water permeability in HeLa cells treated with S-GdNP. H2O2 permeability in HeLa control cells (Ctr) and HeLa cells treated for 2 h (S-GdNP) was evaluated after the addition of 50 μM H2O2. (A,B) See the legend of Figure 3. (C) Bars represent the maximal H2O2 fluorescence, which was obtained by computerized least squares regression, fitting the experimental points of the time courses of H2O2 transported curves with a one-phase exponential association equation (GraphPad Prism 4.00 2003). Maximal fluorescence values are means ± S.E.M. of the 3 different experiments. a, p < 0.0239 (Student’s t-test). (D) Control cells (Ctr) and cells incubated with nanoparticles for 2 h (S-GdNP) were exposed to an osmotic gradient of 150 mOsm. Bars represent the osmotic water permeability of HeLa cells expressed as a percent of k relative. Values are means ± SEM of 10–20 single shots for each of the 3 different experiments. a, p = 0.0317 (Student’s t-test).
Figure 6
Figure 6
Hydrogen peroxide and water permeability in HeLa cells treated with L-GdNP. H2O2 permeability in HeLa control cells (Ctr) and HeLa cells treated for 2 h (L-GdNP) was evaluated after the addition of 50 μM H2O2. (A,B) See the legend of Figure 3. (C) Bars represent the maximal H2O2 fluorescence, which was obtained by computerized least squares regression, fitting the experimental points of the time courses of H2O2 transported curves with a one-phase exponential association equation (GraphPad Prism 4.00 2003). Maximal fluorescence values are means ± S.E.M. of the 3 different experiments. a, p = 0.045 (Student’s t-test). (D) Control cells (Ctr) and cells incubated with nanoparticles for 2 h (L-GdNP) were exposed to an osmotic gradient of 150 mOsm. Bars represent the osmotic water permeability of HeLa cells expressed as a percent of k relative. Values are means ± S.E.M. of 10–20 single shots for each of the 3 different experiments. a, p < 0.01 (Student’s t-test).
Figure 7
Figure 7
Hydrogen peroxide and water permeability in HeLa cells treated with L-CeNP. H2O2 permeability in HeLa control cells (Ctr) and HeLa cells treated for 2 h (L-CeNP) was evaluated after the addition of 50 μM H2O2. (A,B) See the legend of Figure 3. (C) Bars represent the maximal H2O2 fluorescence, which was obtained by computerized least squares regression, fitting the experimental points of the time courses of H2O2 transported curves with a one-phase exponential association equation (GraphPad Prism 4.00 2003). Maximal fluorescence values are means ± S.E.M. of the 3 different experiments (Student’s t-test). (D) Control cells (Ctr) and cells incubated with nanoparticles for 2 h (L-CeNP) were exposed to an osmotic gradient of 150 mOsm. Bars represent the osmotic water permeability of HeLa cells expressed as a percent of k relative. Values are means ± S.E.M. of 10–20 single shots for each of the 3 different experiments. a, p = 0.0147 (Student’s t-test).
Figure 8
Figure 8
Hydrogen peroxide and water permeability in HeLa cells treated with TiNP. H2O2 permeability in HeLa control cells (Ctr) and HeLa cells treated for 2 h (TiNP) was evaluated after the addition of 50 μM H2O2. (A,B) See the legend of Figure 3. (C) Bars represent the maximal H2O2 fluorescence, which was obtained by computerized least squares regression, fitting the experimental points of the time courses of H2O2 transported curves with a one-phase exponential association equation (GraphPad Prism 4.00 2003). Maximal fluorescence values are means ± S.E.M. of the 3 different experiments (Student’s t-test). (D) Control cells (Ctr) and cells incubated with nanoparticles for 2 h (TiNP) were exposed to an osmotic gradient of 150 mOsm. Bars represent the osmotic water permeability of HeLa cells expressed as a percent of k relative. Values are means ± S.E.M. of 10–20 single shots for each of the 3 different experiments. a, p < 0.0001 (Student’s t-test).
Figure 9
Figure 9
Hydrogen peroxide and water permeability in HeLa cells treated with S-CeNPdexs. H2O2 permeability in HeLa control cells (Ctr) and HeLa cells treated for 2 h (S-CeNPdex) was evaluated after the addition of 50 μM H2O2. (A,B) See the legend of Figure 3. (C) Bars represent the maximal H2O2 fluorescence, which was obtained by computerized least squares regression, fitting the experimental points of the time courses of H2O2 transported curves with a one-phase exponential association equation (GraphPad Prism 4.00 2003). Maximal fluorescence values are means ± S.E.M. of the 3 different experiments (Student’s t-test). (D) Control cells (Ctr) and cells incubated with nanoparticles for 2 h (S-CeNPdex) were exposed to an osmotic gradient of 150 mOsm. Bars represent the osmotic water permeability of HeLa cells expressed as a percent of k relative. Values are means ± S.E.M. of 10–20 single shots for each of the 3 different experiments (Student’s t-test).
Figure 10
Figure 10
Summary of the NPs’ characteristics and permeability changes. Gray circles indicate small and large NPs. Green circles indicate the negative, while the gray indicates the neutral functionalization. Red arrows indicate H2O2 permeability, while blue arrows indicate H2O permeability. Arrows pointing up or down indicate increased or decreased permeability. PAA, poly(acrylic) acid; dex, dextran.

Similar articles

Cited by

References

    1. King L.S., Kozono D., Agre P. From Structure to Disease: The Evolving Tale of Aquaporin Biology. Nat. Rev. Mol. Cell Biol. 2004;5:687–698. doi: 10.1038/nrm1469. - DOI - PubMed
    1. Benga G. The First Discovered Water Channel Protein, Later Called Aquaporin 1: Molecular Characteristics, Functions and Medical Implications. Mol. Asp. Med. 2012;33:518–534. doi: 10.1016/j.mam.2012.06.001. - DOI - PubMed
    1. Medraño-Fernandez I., Bestetti S., Bertolotti M., Bienert G.P., Bottino C., Laforenza U., Rubartelli A., Sitia R. Stress Regulates Aquaporin-8 Permeability to Impact Cell Growth and Survival. Antioxid. Redox Signal. 2016;24:1031–1044. doi: 10.1089/ars.2016.6636. - DOI - PMC - PubMed
    1. Bienert G.P., Chaumont F. Aquaporin-Facilitated Transmembrane Diffusion of Hydrogen Peroxide. Biochim. Biophys. Acta. 2014;1840:1596–1604. doi: 10.1016/j.bbagen.2013.09.017. - DOI - PubMed
    1. Bestetti S., Galli M., Sorrentino I., Pinton P., Rimessi A., Sitia R., Medraño-Fernandez I. Human Aquaporin-11 Guarantees Efficient Transport of H2O2 across the Endoplasmic Reticulum Membrane. Redox Biol. 2020;28:101326. doi: 10.1016/j.redox.2019.101326. - DOI - PMC - PubMed

LinkOut - more resources