. 2023 Dec 27;25(1):383.
doi: 10.3390/ijms25010383.

Elucidating Differences in Early-Stage Centrosome Amplification in Primary and Immortalized Mouse Cells

Affiliations

Elucidating Differences in Early-Stage Centrosome Amplification in Primary and Immortalized Mouse Cells

Masakazu Tanaka et al. Int J Mol Sci. .

Abstract

The centrosome is involved in cytoplasmic microtubule organization during interphase and in mitotic spindle assembly during cell division. Centrosome amplification (abnormal proliferation of centrosome number) has been observed in several types of cancer and in precancerous conditions. Therefore, it is important to elucidate the mechanism of centrosome amplification in order to understand the early stage of carcinogenesis. Primary cells could be used to better understand the early stage of carcinogenesis rather than immortalized cells, which tend to have various genetic and epigenetic changes. Previously, we demonstrated that a poly(ADP-ribose) polymerase (PARP) inhibitor, 3-aminobenzamide (3AB), which is known to be nontoxic and nonmutagenic, could induce centrosome amplification and chromosomal aneuploidy in CHO-K1 cells. In this study, we compared primary mouse embryonic fibroblasts (MEF) and immortalized MEF using 3AB. Although centrosome amplification was induced with 3AB treatment in immortalized MEF, a more potent PARP inhibitor, AG14361, was required for primary MEF. However, after centrosome amplification, neither 3AB in immortalized MEF nor AG14361 in primary MEF caused chromosomal aneuploidy, suggesting that further genetic and/or epigenetic change(s) are required to exhibit aneuploidy. The DNA-damaging agents doxorubicin and γ-irradiation can cause cancer and centrosome amplification in experimental animals. Although doxorubicin and γ-irradiation induced centrosome amplification and led to decreased p27Kip protein levels in immortalized MEF and primary MEF, the phosphorylation ratio of nucleophosmin (Thr199) increased in immortalized MEF, whereas it decreased in primary MEF. These results suggest that there exists a yet unidentified pathway, different from the nucleophosmin phosphorylation pathway, which can cause centrosome amplification in primary MEF.

Keywords: DNA damage (doxorubicin, irradiation); PARP inhibition; cell differentiation; centrosome amplification; chromosome instability.


Conflict of interest statement

The authors declare no conflicts of interest.

Figures

Figure 1
Figure 1
Numerical amplification of centrosomes by PARP inhibition is different between immortalized MEF and primary MEF. (A) Kinetic analyses of cell proliferation and flow cytometric analyses of immortalized MEF and primary MEF. MEF were treated with 3AB, trypsinized, and suspended in 0.4% trypan blue. Cells that did not stain with trypan blue were counted on a hemocytometer. ** p < 0.01 versus control with Student’s t-test. (B) Treatment with 3AB for 72 h induced centrosome amplification in immortalized MEF but not in primary MEF. More than 200 cells were examined, and the number of γ-tubulin spots per cell was measured. ** p < 0.01 versus control (Fisher’s exact test).
Figure 2
Figure 2
Centrosome amplification was induced in primary MEF using AG14361, a potent and specific PARP inhibitor, but abnormal number of chromosomes was not induced. (A) Increase in the number of centrosomes induced by AG14361 treatment for 72 h. Number of centrosomes per cell was counted for at least 200 cells. The lower two panels show the merged images of staining for DNA (blue), α-tubulin (red), and γ-tubulin (white arrowhead). ** p < 0.01 versus control with Student’s t-test. (B) Localization of centrioles in primary MEF. Centrioles are shown with centrin (red) and with white arrowheads, pericentriolar material (PCM) with γ-tubulin (green), and nucleus with DAPI (blue). (C) Kinetic analysis of cell proliferation and flow cytometric analyses of primary MEF. Primary MEF treated with AG14361 were trypsinized and suspended in 0.4% trypan blue. Cells that did not stain with trypan blue were counted on a hemocytometer. ** p < 0.01 versus control with Student’s t-test. Lower panels show flow cytometric analysis of primary MEF. (D) Distribution of the chromosome number 72 h after 3AB or AG14361 treatment in primary MEF. The vertical axis indicates the percentage of cells, and the horizontal axis indicates the number of chromosomes. The chromosome number 2n = 40 ± 4 and 80 ± 4 was taken as normal in primary MEF. More than 200 cells were examined. p-value was determined using Fisher’s exact test.
Figure 3
Figure 3
Centrosome abnormality and chromosomal instability after 3AB treatment were confirmed using other immortalized cells. (A) No significant change in the number of chromosomes 72 h after 3AB treatment in immortalized MEF. The number of chromosomes 2n = 70 ± 4 was taken as the normal number of chromosomes in immortalized MEF. The vertical axis indicates the percentage of cells, and the horizontal axis indicates the number of chromosomes. More than 200 cells were examined. p-value was determined using Fisher’s exact test. (B) Fluorescence in situ hybridization (FISH) images of a cell from immortalized MEF to depict no changes in the numbers of chromosome 1 and chromosome 8 per cell without or with 3AB treatment for 72 h. Nuclear area is surrounded by dashed red circle.
Figure 4
Figure 4
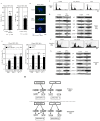
Analysis of centrosome amplification after DNA damage in primary MEF. (A) The measurement of viable cells after 48 h of doxorubicin (Dox.) treatment and 10-Gy γ-irradiation was conducted using XTT method. The control value is taken as 100%, and the standard deviations are shown with vertical bars. Statistical significance was determined using Student’s t-test, N = 5. (B) The images of centrosome amplification induced by doxorubicin and γ-irradiation treatment after 48 h. The arrowheads refer to the centrosomes. The nuclei were stained blue by Hoechst. (C) No significant change in the flow cytometric patterns of primary MEF 24 h after doxorubicin or γ-irradiation treatment. The vertical axis indicates the number of cells, and the horizontal axis indicates the DNA content of cells. (D) Changes in the levels of proteins related to centrosome duplication 24 h after 200 nM doxorubicin treatment and 10 Gy γ-irradiation to primary MEF. Antibodies were used to detect the respective proteins. Representative data from three independent experiments are presented. The density of each protein was calculated using ImageJ software ver.1.51 and was digitized. The density of each band was normalized to that of α-tubulin, and the ratio of the density of the respective protein treated with doxorubicin or γ-irradiation divided by that of untreated band is shown. The mean values from three experiments are described under the respective bands (Supplementary Table S1). (E) Centrosome amplification in wild-type, Skp2−/−, and p27−/− primary MEF at 48 h after treatment with or without doxorubicin (Dox., 200 nM) or γ-irradiation (γ-IR, 10 Gy). Cells were immunostained with anti-γ-tubulin antibody, and the number of γ-tubulin spots was counted. More than 200 cells were examined. Columns, the mean of three independent experiments; bars, standard deviation. p-value was determined using Student’s t-test. **, p < 0.01, compared with wild-type primary MEF at 48 h after doxorubicin or γ-irradiation treatment. n.s., not significant. (F) Changes in the flow cytometric patterns of immortalized MEF 24 h after doxorubicin or γ-irradiation treatment. The vertical axis indicates the number of cells, and the horizontal axis indicates the DNA content of cells. (G) Changes in the levels of proteins related to centrosome duplication 24 h after 200 nM doxorubicin treatment and 10-Gy γ-irradiation to immortalized MEF, respectively. Antibodies were used to detect the respective proteins. Representative data from three independent experiments are presented. The density of each protein was calculated by ImageJ software ver. 1.51 and was digitized. The density of each band was normalized to that of α-tubulin, and the ratio of the density of the respective protein treated with doxorubicin or γ-irradiation was divided by that of untreated band. The mean values from three experiments are described under the respective bands (Supplementary Table S1). (H) The proposed model for the signal transduction pathways of centrosome amplification after DNA damage in primary MEF and immortalized MEF. The increase in density to over 1.2-fold and the decrease to below 0.8-fold of the control density in western blots are indicated by upward and downward arrows, respectively. The increase in the ratio of pNPM/NPM to over 1.2 and the decrease to below 0.8 are indicated by upward and downward arrows, respectively (Supplementary Table S1).

Similar articles

Cited by

References

    1. Nigg E.A., Stearns T. The centrosome cycle: Centriole biogenesis, duplication and inherent asymmetries. Nat. Cell Biol. 2011;13:1154–1160. doi: 10.1038/ncb2345. - DOI - PMC - PubMed
    1. Bornens M. The centrosome in cells and organisms. Science. 2012;335:422–426. doi: 10.1126/science.1209037. - DOI - PubMed
    1. Godinho S.A., Kwon M., Pellman D. Centrosomes and cancer: How cancer cells divide with too many centrosomes. Cancer Metastasis Rev. 2009;28:85–98. doi: 10.1007/s10555-008-9163-6. - DOI - PubMed
    1. Kwon M., Godinho S.A., Chandhok N.S., Ganem N.J., Azioune A., Thery M., Pellman D. Mechanisms to suppress multipolar divisions in cancer cells with extra centrosomes. Genes Dev. 2008;22:2189–2203. doi: 10.1101/gad.1700908. - DOI - PMC - PubMed
    1. Löffler H., Fechter A., Liu F.Y., Poppelreuther S., Krämer A. DNA damage-induced centrosome amplification occurs via excessive formation of centriolar satellites. Oncogene. 2013;32:2963–2972. doi: 10.1038/onc.2012.310. - DOI - PubMed

Substances

LinkOut - more resources