

MS Identification of Blood Plasma Proteins Concentrated on a Photocrosslinker-Modified Surface
- PMID: 38203578
- PMCID: PMC10778900
- DOI: 10.3390/ijms25010409
MS Identification of Blood Plasma Proteins Concentrated on a Photocrosslinker-Modified Surface
Abstract
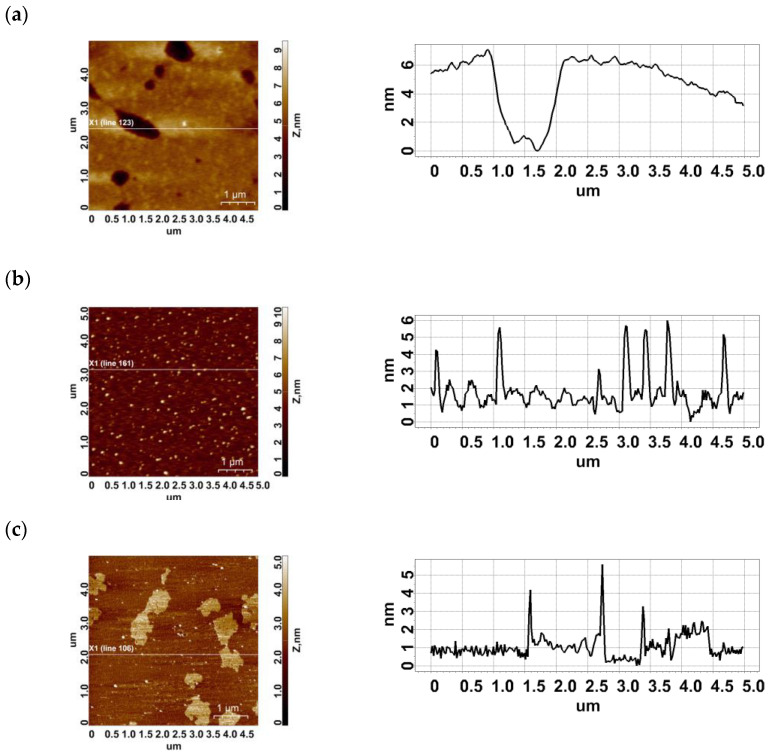
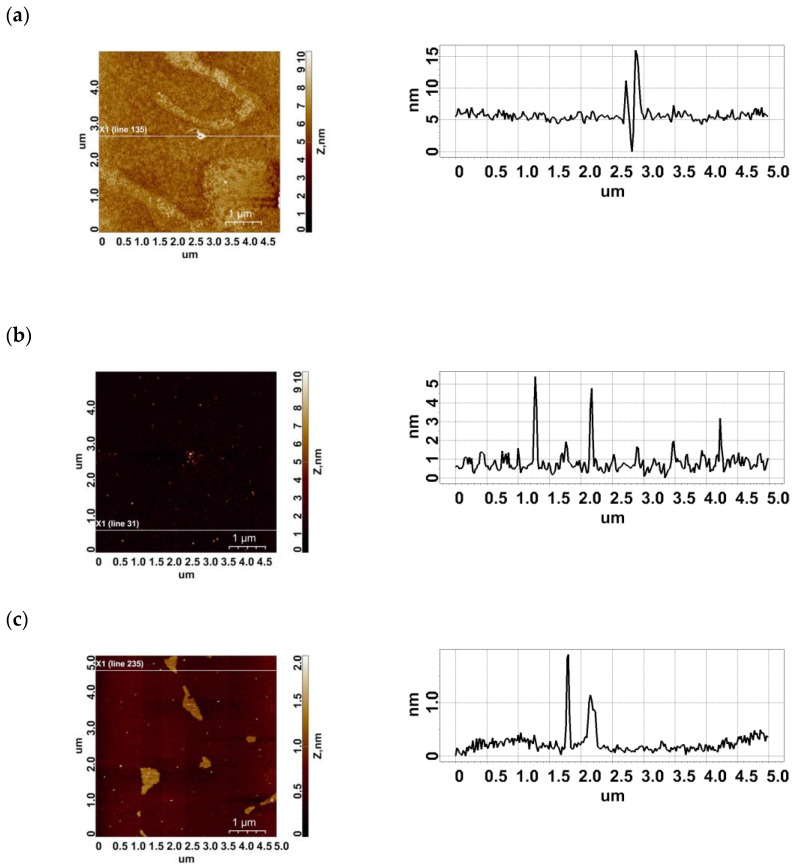
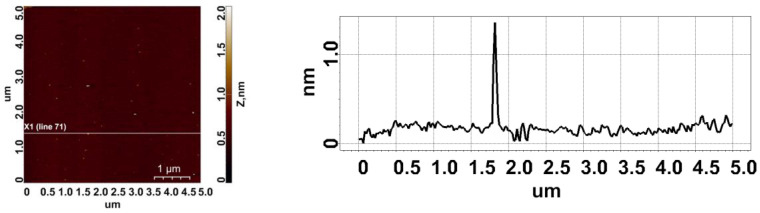
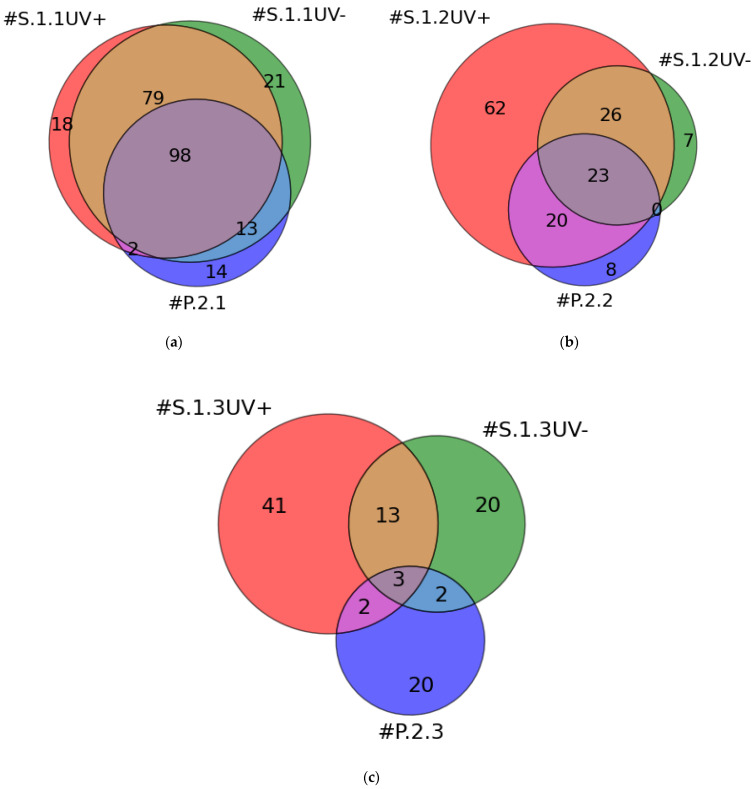
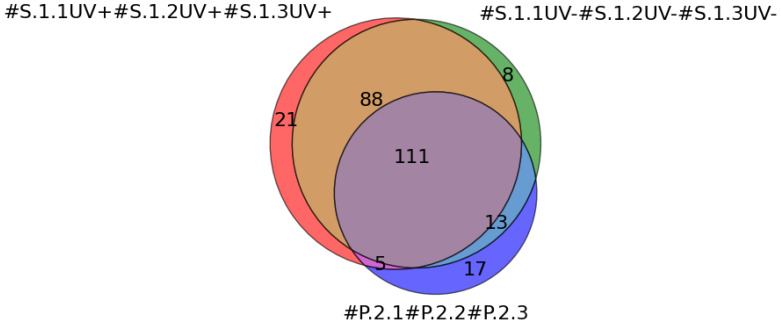
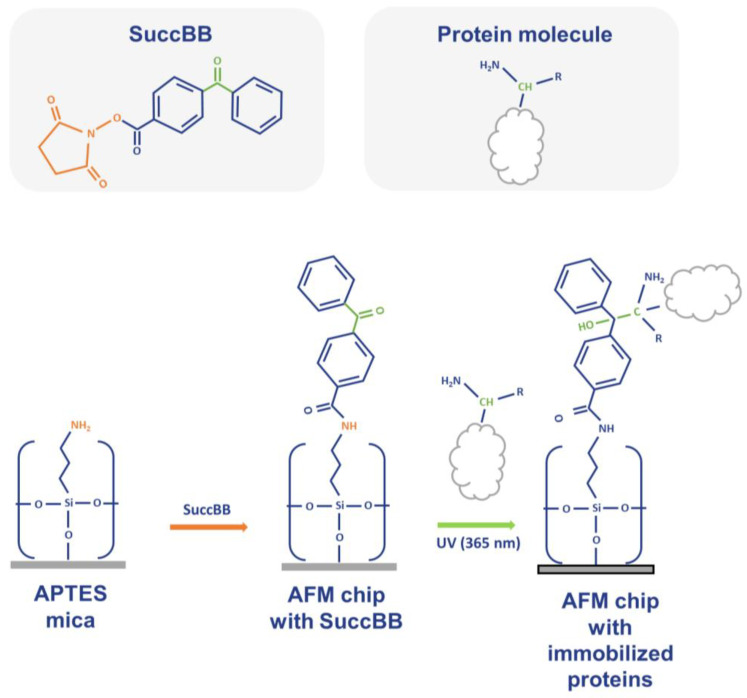
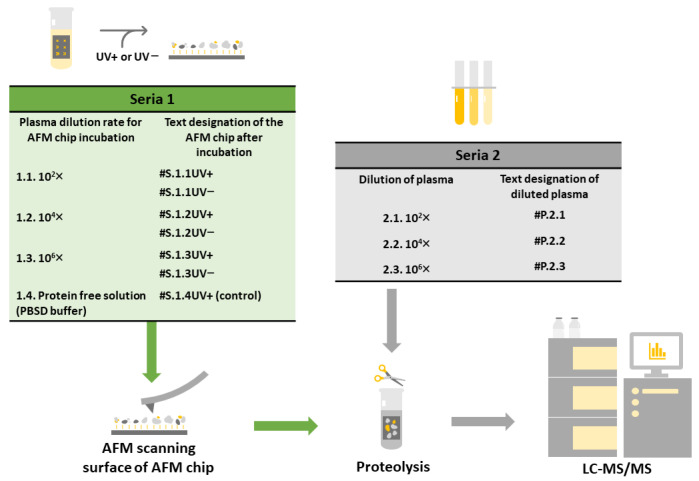
This work demonstrates the use of a modified mica to concentrate proteins, which is required for proteomic profiling of blood plasma by mass spectrometry (MS). The surface of mica substrates, which are routinely used in atomic force microscopy (AFM), was modified with a photocrosslinker to allow "irreversible" binding of proteins via covalent bond formation. This modified substrate was called the AFM chip. This study aimed to determine the role of the surface and crosslinker in the efficient concentration of various types of proteins in plasma over a wide concentration range. The substrate surface was modified with a 4-benzoylbenzoic acid N-succinimidyl ester (SuccBB) photocrosslinker, activated by UV irradiation. AFM chips were incubated with plasma samples from a healthy volunteer at various dilution ratios (102X, 104X, and 106X). Control experiments were performed without UV irradiation to evaluate the contribution of physical protein adsorption to the concentration efficiency. AFM imaging confirmed the presence of protein layers on the chip surface after incubation with the samples. MS analysis of different samples indicated that the proteomic profile of the AFM-visualized layers contained common and unique proteins. In the working series of experiments, 228 proteins were identified on the chip surface for all samples, and 21 proteins were not identified in the control series. In the control series, a total of 220 proteins were identified on the chip surface, seven of which were not found in the working series. In plasma samples at various dilution ratios, a total of 146 proteins were identified without the concentration step, while 17 proteins were not detected in the series using AFM chips. The introduction of a concentration step using AFM chips allowed us to identify more proteins than in plasma samples without this step. We found that AFM chips with a modified surface facilitate the efficient concentration of proteins owing to the adsorption factor and the formation of covalent bonds between the proteins and the chip surface. The results of our study can be applied in the development of highly sensitive analytical systems for determining the complete composition of the plasma proteome.
Keywords: atomic force microscopy; crosslinker; mass spectrometry; protein immobilization.
Conflict of interest statement
The authors declare no conflicts of interest.
Figures
Similar articles
-
Mass Spectrometric Identification of BSA Covalently Captured onto a Chip for Atomic Force Microscopy.Int J Mol Sci. 2023 May 19;24(10):8999. doi: 10.3390/ijms24108999. Int J Mol Sci. 2023. PMID: 37240343 Free PMC article.
-
Detection of Circulating Serum microRNA/Protein Complexes in ASD Using Functionalized Chips for an Atomic Force Microscope.Molecules. 2021 Oct 2;26(19):5979. doi: 10.3390/molecules26195979. Molecules. 2021. PMID: 34641523 Free PMC article.
-
Detection of hepatitis C virus core protein in serum by atomic force microscopy combined with mass spectrometry.Int J Nanomedicine. 2015 Feb 25;10:1597-608. doi: 10.2147/IJN.S71776. eCollection 2015. Int J Nanomedicine. 2015. PMID: 25759582 Free PMC article.
-
[Methods and applications of single-cell proteomics analysis based on mass spectrometry].Se Pu. 2021 Feb;39(2):142-151. doi: 10.3724/SP.J.1123.2020.08030. Se Pu. 2021. PMID: 34227347 Free PMC article. Review. Chinese.
-
[Recent progress in capillary electrophoresis-based high-sensitivity proteomics].Se Pu. 2020 Oct 8;38(10):1125-1132. doi: 10.3724/SP.J.1123.2020.03003. Se Pu. 2020. PMID: 34213109 Review. Chinese.
Cited by
-
Unlocking the potential of flavonoid-infused drug delivery systems for diabetic wound healing with a mechanistic exploration.Inflammopharmacology. 2024 Oct;32(5):2861-2896. doi: 10.1007/s10787-024-01561-5. Epub 2024 Aug 31. Inflammopharmacology. 2024. PMID: 39217278 Review.
References
-
- Cloonan M.J., Bishop G.A., Wilton-Smith P.D., Carter I.W., Allan R.M., Wilcken D.E. An Enzyme-Immunoassay for Myoglobin in Human Serum and Urine. Method Development, Normal Values and Application to Acute Myocardial Infarction. Pathology. 1979;11:689–699. doi: 10.3109/00313027909059049. - DOI - PubMed
-
- Boskabadi H., Maamouri G., Tavakol Afshari J., Mafinejad S., Hosseini G., Mostafavi-Toroghi H., Saber H., Ghayour-Mobarhan M., Ferns G. Evaluation of Serum Interleukins-6, 8 and 10 Levels as Diagnostic Markers of Neonatal Infection and Possibility of Mortality. Iran. J. Basic. Med. Sci. 2013;16:1232–1237. - PMC - PubMed
MeSH terms
Substances
LinkOut - more resources
Full Text Sources
Miscellaneous
