. 2023 Dec 28;25(1):430.
doi: 10.3390/ijms25010430.

SMC5 Plays Independent Roles in Congenital Heart Disease and Neurodevelopmental Disability

Affiliations

SMC5 Plays Independent Roles in Congenital Heart Disease and Neurodevelopmental Disability

Matthew P O'Brien et al. Int J Mol Sci. .

Abstract

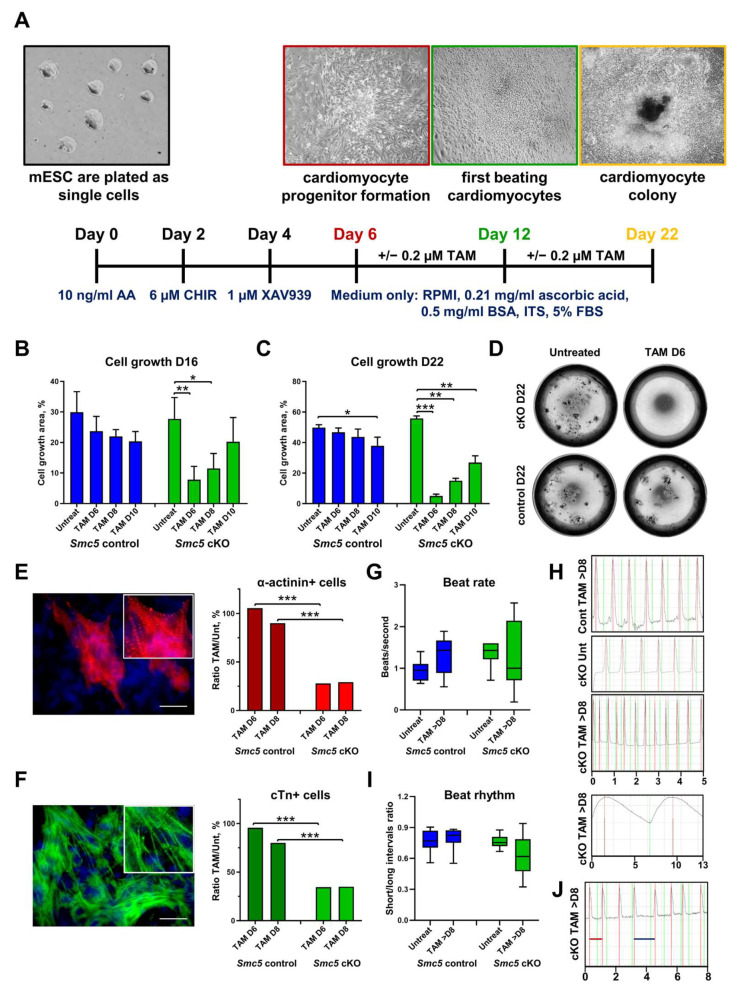
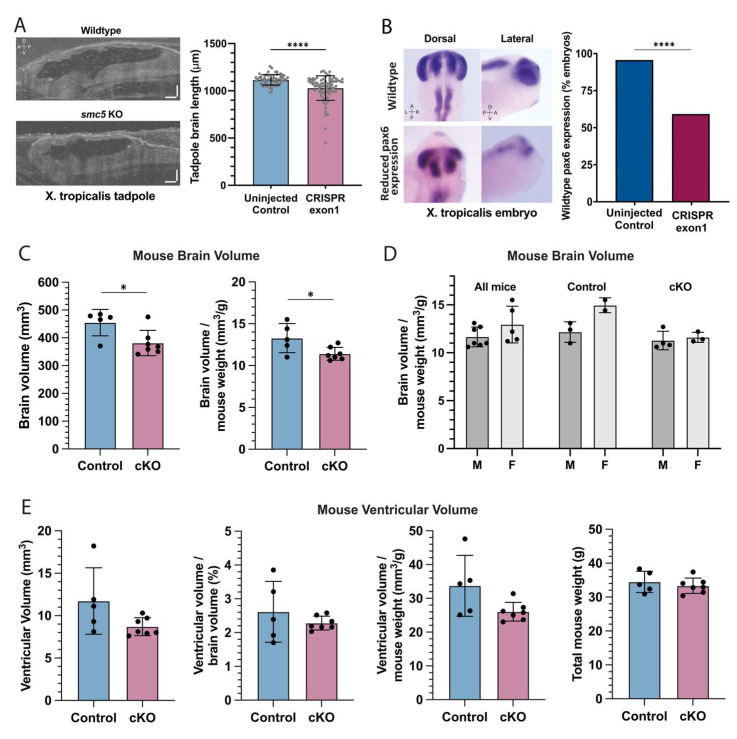
Up to 50% of patients with severe congenital heart disease (CHD) develop life-altering neurodevelopmental disability (NDD). It has been presumed that NDD arises in CHD cases because of hypoxia before, during, or after cardiac surgery. Recent studies detected an enrichment in de novo mutations in CHD and NDD, as well as significant overlap between CHD and NDD candidate genes. However, there is limited evidence demonstrating that genes causing CHD can produce NDD independent of hypoxia. A patient with hypoplastic left heart syndrome and gross motor delay presented with a de novo mutation in SMC5. Modeling mutation of smc5 in Xenopus tropicalis embryos resulted in reduced heart size, decreased brain length, and disrupted pax6 patterning. To evaluate the cardiac development, we induced the conditional knockout (cKO) of Smc5 in mouse cardiomyocytes, which led to the depletion of mature cardiomyocytes and abnormal contractility. To test a role for Smc5 specifically in the brain, we induced cKO in the mouse central nervous system, which resulted in decreased brain volume, and diminished connectivity between areas related to motor function but did not affect vascular or brain ventricular volume. We propose that genetic factors, rather than hypoxia alone, can contribute when NDD and CHD cases occur concurrently.

Keywords: cardiomyocytes; congenital heart disease; functional MRI; functional connectivity; hypoplastic left heart syndrome; neurodevelopment; structural maintenance of chromosomes.


Conflict of interest statement

Mustafa Khokha is a founder of Victory Genomics, Inc., and Philip Jordan is on the scientific advisory board of Gameto, Inc. All the other authors have no conflicts of interest to disclose. The opinions and assertions expressed herein are those of the author(s) and do not reflect the official policy or position of the Uniformed Services University of the Health Sciences or the Department of Defense.

Figures

Figure 1
Figure 1
SMC5 variant associated with impaired cardiac development in proband and frog knockdown model. (A) Graphic of hypoplastic left heart syndrome showing the small left ventricle (LV), small stenotic mitral valve (MV), aortic valve (AV), and hypoplastic aorta (Ao). (B) Fetal echocardiogram at 19 weeks gestation in an apical 4-chamber view demonstrates reduced left ventricular (LV) size compared to the right ventricle (RV) as well as the larger right atrium (RA) and small left atrium (LA). (C) A fetal echocardiogram at 23 weeks gestation in a view of the aortic arch demonstrates a small aortic arch (Ao) and larger ductus arteriosus (DA) with color Doppler imaging showing minimal blood flow (red) through the hypoplastic aortic arch and a much larger volume of blood flow (blue) across ductus arteriosus. Color scales estimate fluid velocity, with each color representing fluid flow toward (red) or away (blue) from the ultrasound probe located at the top of the image. (D) Postnatal echocardiogram at 28 days old in an apical 4-chamber view demonstrates a large right atrium (RA) and right ventricle (RV) with a thin hypoplastic left ventricle (LV). (E) Cross section of tadpole atria (A) and ventricle (V) of stage 45 live X. tropicalis embryos (n = 50). Scale bars indicating 50 μm. ** p < 0.01, **** p < 0.0001 by t-test in (E).
Figure 2
Figure 2
Smc5 is required for mouse cardiac development and function. (A) The outline of mESC cardiac differentiation and tamoxifen treatment. (BD) Smc5 cKO in cardiac progenitors causes a significant reduction in cell proliferation. Tamoxifen (TAM) was added on day 6, day 8, and day 10 of mESC differentiation. The cell outgrowth was evaluated on day 16 (B) and day 22 (C,D). Images of live cell cultures are shown for differentiation day 22 (D). Data are a cumulative of two independent experiments performed in replicas. Data was assessed using the Mann–Whitney t-test and significant comparisons are given as * p < 0.05, ** p < 0.01, and *** p < 0.001, and other comparisons were deemed non-significant. (E,F). Smc5 cKO in cardiac progenitors causes a significant reduction in resulting cardiomyocytes based on the evaluation of sarcomere proteins α-actinin (red) and cardiac troponin T (cTn) (green) expression. Tamoxifen (TAM) was added on day 6 and day 8 of mESC differentiation. Cells were evaluated on day 18. The ratio of tamoxifen-treated to untreated cells is shown (n ≥ 5 × 10³ total cells). Examples of α-actinin (red) (E) and cardiac troponin T (cTn) (green) (F) expression in mESC-derived cardiomyocytes are shown. Scale bar 25 μm. Data was assessed using the Mann–Whitney t-test and significant comparisons were given as *** p < 0.001, and other comparisons were deemed non-significant. (G) Smc5 cKO in cardiac progenitors results in higher variability in beat rate (n = 6–16). (H) Examples of TAM-treated control (Cont) (Supplementary Movie S1), untreated (Unt) cKO (Supplementary Movie S2), and TAM-treated cKO cardiomyocytes with fast and slow beat rate are shown (Supplementary Movies S3–S5) (scale, seconds). (I) Smc5 cKO in cardiac progenitors results in higher variability in beat rhythm (n = 7–12). (J) An example of TAM-treated cKO cardiomyocytes with short (red line) and long (blue line) intervals between contractions is shown (Supplementary Movie S6) (scale, seconds).
Figure 3
Figure 3
smc5 knockout alters brain development in frogs and mice (A) Sagittal cross-section of stage 45 X. tropicalis brain in control and smc5 KO (CRISPR exon 1) embryos. Scale bars presenting 100 μm. (B) Whole-mount in situ hybridization of pax6 in stage 28 X. tropicalis embryos, highlighting reduced expression in the smc5 KO (CRISPR exon1) brain, notochord, and developing eye. Images show pax6 distribution rather than scale. (C) Brain volume and brain volume normalized by weight in control and Smc5 cKO mice measured by MRI. (D) Brain volume normalized by weight compared between male (M) and female (F) mice, showing all, control, or Smc5 cKO mice. (E) Brain ventricular volume of control or Smc5 cKO mice is shown as raw volume, ventricular volume normalized by brain volume, or ventricular volume normalized by weight. Legend: left (L), right (R), dorsal (D), ventral (V), anterior (A) and posterior (P), * p < 0.05, **** p < 0.0001 by t-test in (A,CE) and by chi-square analysis in (B).
Figure 4
Figure 4
Smc5 cKO reduces brain volume in most regions except medulla. (A) Percentage of subregion volume compared to total brain volume of control vs smc5 cKO mice. A significant increase in medulla size is noted with Smc5 cKO. (B) The volume of the medullary infracerebellar nucleus is significantly (p = 0.03) enlarged in Smc5 cKO animals as normalized to total brain volume. (C) The medulla is uniformly enlarged across all remaining medulla subregions as demonstrated by medulla volume normalized to total brain volume; however, we see no significant differences between groups. Nuc.: nucleus, * p < 0.05, n = 12 for all experiments.
Figure 5
Figure 5
Brain vascular volume and spatial distribution are preserved with Smc5 cKO. (A) Maximum Intensity projection (MIP) of vascular volume across multiple signal intensity thresholds (7000, 7500, 8000) and direction (X, Y, & Z) showing increasing vessel volume correlated with increasing brain volume (n = 12). (B) Example of Masked Angiogram MIP of a control mouse (n = 1). Red shading shows masked (by signal intensity threshold) angiogram in X, Y, and Z directions. The threshold shown is 7500 (arbitrary signal intensity units). (C) Vascular volume normalized to total brain volume in X, Y, & Z directions has no significant difference between control and cKO mice (n = 12).
Figure 6
Figure 6
Smc5 cKO disrupts somatomotor/somatosensory, cerebellar, and medial forebrain functional connectivity. Connectivity maps use each color in a semicircle to represent a different brain region, with the left and right semicircle representing each respective mouse brain hemisphere. While connections exist between all regions, lines shown between regions of interest (ROI, black arrow) denote a change in connectivity that distinguishes between control and Smc5 cKO mice. Red lines represent an increase in synchrony between ROIs (red text) and blue lines represent a decrease in synchrony between ROIs (blue text). (A) Combined connectivity changes across the brain, with all ROIs shown. (BD) Connectivity patterns associated with each interrogated ROI (named by black text) are individually shown. (B) Somatosensory and somatomotor connectivity maps, with somatomotor ROI represented by innermost black arrows, and somatosensory ROI represented by outermost black arrows. (C) Cerebellar connectivity map and (D) Medial forebrain bundle system connectivity map. n = 12 for all experiments.
Figure 7
Figure 7
SMC5 malfunction during embryonic development produces CHD and NDD through independent processes. The data presented indicates that neurodevelopmental defects can occur with and without concurrent CHD. Furthermore, SMC5 mutations can alter brain FC and cause developmental delays.

Similar articles

Cited by

References

    1. Van der Linde D., Konings E.E.M., Slager M.A., Witsenburg M., Helbing W.A., Takkenberg J.J.M., Roos-Hesselink J.W. Birth prevalence of congenital heart disease worldwide: A systematic review and meta-analysis. J. Am. Coll. Cardiol. 2011;58:2241–2247. doi: 10.1016/j.jacc.2011.08.025. - DOI - PubMed
    1. Talner C.N. Report of the New England Regional Infant Cardiac Program, by Donald C. Fyler, MD, Pediatrics, 1980; 65(suppl): 375–461. Pediatrics. 1998;102:258–259. doi: 10.1542/peds.102.S1.258. - DOI - PubMed
    1. Egbe A., Lee S., Ho D., Uppu S., Srivastava S. Prevalence of congenital anomalies in newborns with congenital heart disease diagnosis. Ann. Pediatr. Cardiol. 2014;7:86–91. doi: 10.4103/0974-2069.132474. - DOI - PMC - PubMed
    1. Naef N., Liamlahi R., Beck I., Bernet V., Dave H., Knirsch W., Latal B. Neurodevelopmental Profiles of Children with Congenital Heart Disease at School Age. J. Pediatr. 2017;188:75–81. doi: 10.1016/j.jpeds.2017.05.073. - DOI - PubMed
    1. Verrall C.E., Blue G.M., Loughran-Fowlds A., Kasparian N., Gecz J., Walker K., Dunwoodie S.L., Cordina R., Sholler G., Badawi N., et al. ‘Big issues’ in neurodevelopment for children and adults with congenital heart disease. Open Heart. 2019;6:e000998. doi: 10.1136/openhrt-2018-000998. - DOI - PMC - PubMed

LinkOut - more resources