. 2023 Dec 30;25(1):519.
doi: 10.3390/ijms25010519.

Serotonergic Modulation of the Excitation/Inhibition Balance in the Visual Cortex

Affiliations

Serotonergic Modulation of the Excitation/Inhibition Balance in the Visual Cortex

Estevão Carlos-Lima et al. Int J Mol Sci. .

Abstract

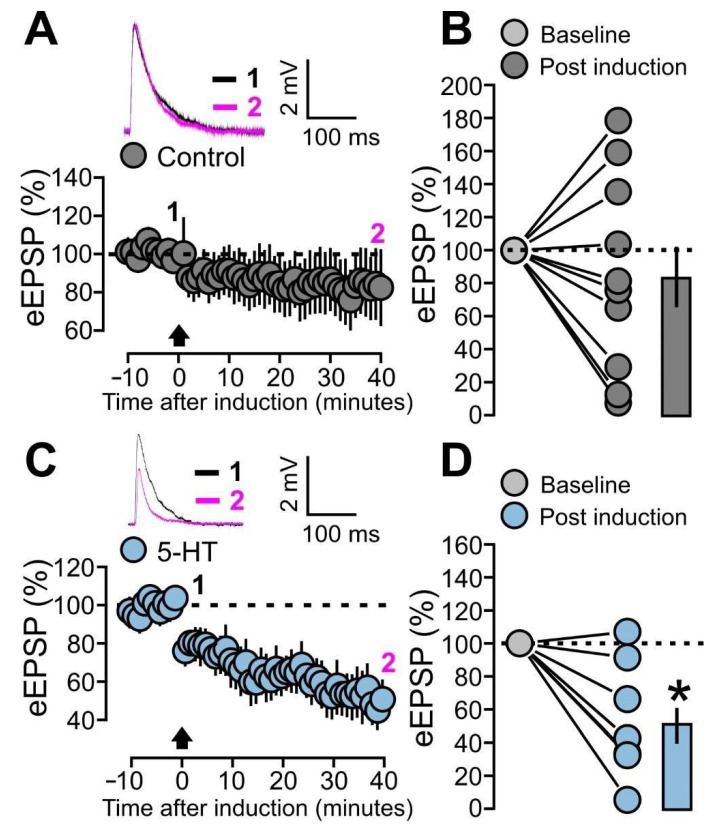
Serotonergic neurons constitute one of the main systems of neuromodulators, whose diffuse projections regulate the functions of the cerebral cortex. Serotonin (5-HT) is known to play a crucial role in the differential modulation of cortical activity related to behavioral contexts. Some features of the 5-HT signaling organization suggest its possible participation as a modulator of activity-dependent synaptic changes during the critical period of the primary visual cortex (V1). Cells of the serotonergic system are among the first neurons to differentiate and operate. During postnatal development, ramifications from raphe nuclei become massively distributed in the visual cortical area, remarkably increasing the availability of 5-HT for the regulation of excitatory and inhibitory synaptic activity. A substantial amount of evidence has demonstrated that synaptic plasticity at pyramidal neurons of the superficial layers of V1 critically depends on a fine regulation of the balance between excitation and inhibition (E/I). 5-HT could therefore play an important role in controlling this balance, providing the appropriate excitability conditions that favor synaptic modifications. In order to explore this possibility, the present work used in vitro intracellular electrophysiological recording techniques to study the effects of 5-HT on the E/I balance of V1 layer 2/3 neurons, during the critical period. Serotonergic action on the E/I balance has been analyzed on spontaneous activity, evoked synaptic responses, and long-term depression (LTD). Our results pointed out that the predominant action of 5-HT implies a reduction in the E/I balance. 5-HT promoted LTD at excitatory synapses while blocking it at inhibitory synaptic sites, thus shifting the Hebbian alterations of synaptic strength towards lower levels of E/I balance.

Keywords: 5-HT; E/I balance; visual cortex.


Conflict of interest statement

The authors declare no conflict of interest.

Figures

Figure 1
Figure 1
5-HT decreases the amplitude of spontaneous excitatory synaptic currents (sEPSCs). (A) The recorded example traces of the sEPSCs for the two conditions: 5-HT (50 µM) and control. (B) The average of the sEPSCs’ traces for the two conditions: 5-HT (50 µM, magenta line) and control (black line) for one representative experiment. (C) The graph shows the data points and mean values of the sEPSCs’ amplitude (pA) for the two conditions: 5-HT (50 µM) and control. (D) The graph shows the data points and mean values of the sEPSCs’ frequency (Hz) for the two conditions: 5-HT (50 µM) and control. (E) The graph shows the data points and mean values of the sEPSCs’ interevent interval (s) for the two conditions: 5-HT (50 µM) and control. Asterisk indicates statistical significance.
Figure 2
Figure 2
5-HT increases the frequencies and decreases the interevent interval of spontaneous inhibitory synaptic currents (sIPSCs). (A) The recorded example traces of the sIPSCs for the two conditions: 5-HT (50 µM) and control. (B) The graph shows the data points and mean values of the sIPSCs’ amplitude (pA) for the two conditions: 5-HT (50 µM) and control. (C) The graph shows the data points and mean values of the sIPSCs’ frequency (Hz) for the two conditions: 5-HT (50 µM) and control. (D) The graph shows the data points and mean values of the sIPSCs’ interevent intervals (s) for the two conditions: 5-HT (50 µM) and control. Asterisk indicates statistical significance.
Figure 3
Figure 3
The mEPSCs are not affected by 5-HT. (A) The recorded example traces of the mEPSCs for the two conditions: 5-HT (50 µM) and control. (B) The average of the mEPSCs’ traces for the two conditions: 5-HT (50 µM, magenta line) and control (black line) for one representative experiment. (C) The graph shows the data points and mean values of the mEPSCs’ amplitude (pA) for the two conditions: 5-HT (50 µM) and control. (D) The graph shows the data points and mean values of the mEPSCs’ frequency (Hz) for the two conditions: 5-HT (50 µM) and control. (E) The graph shows the data points and mean values of the mEPSCs’ interevent interval (s) for the two conditions: 5-HT (50 µM) and control.
Figure 4
Figure 4
The mIPSCs are not affected by 5-HT application. (A) The recorded example traces of the mIPSCs for the two conditions: 5-HT (50 µM) and control. (B) The graph shows the data points and mean values of the mIPSCs’ amplitude (pA) for the 5-HT (50 µM) and control conditions. (C) The graph shows the data points and mean values of the mIPSCs’ frequency (Hz) for the 5-HT (50 µM) and control conditions. (D) The graph shows the data points and mean values of the mIPSCs’ interevent interval (s) for the two conditions: 5-HT (50 µM) and control.
Figure 5
Figure 5
5-HT decreases the evoked excitatory postsynaptic potentials (eEPSPs) and the evoked inhibitory postsynaptic currents (eIPSCs). (A) The graph shows the eEPSPs recorded before and during 5-HT (10 µM) and 5-HT (50 µM) bath application. The EPSPs are normalized to the mean of responses recorded during the control baseline. The traces show one example experiment with the average of postsynaptic responses recorded before (control; 1: 0 to 5 min, black line) and after (5-HT; 2: 15 to 20 min, magenta line) the application of 5-HT. (B) The graph shows the data points and mean values of the normalized sEPSPs for the two conditions: 5-HT (10 µM) and control. (C) The graph shows the data points and mean values of the normalized sEPSPs for the two conditions: 5-HT (50 µM) and control. (D) The graph shows the data points of the membrane potential (mV) for the two conditions: 5-HT (50 µM) and control. (E) The graph shows mean value of the membrane potential (mV) for the two conditions: 5-HT (50 µM) and control. (F) The graph shows the data points of the input resistance (MΩ) for the two conditions: 5-HT (50 µM) and control. (G) The graph shows mean value of the input resistance (MΩ) for the two conditions: 5-HT (50 µM) and control. (H) The graph shows the eIPSCs recorded before and during 5-HT (50 µM) bath application. The IPSCs are normalized to the mean of responses recorded during the control baseline. The traces show one example experiment with the average of postsynaptic responses recorded before (control; 1: 0 to 5 min, black line) and after (5-HT; 2: 15 to 20 min, magenta line) the application of 5-HT. (I) The graph shows the data points and mean values of the normalized sIPSCs for the two conditions: 5-HT (50 µM) and control. Asterisk indicates statistical significance.
Figure 6
Figure 6
5-HT decreases the evoked excitatory postsynaptic potentials (eEPSCs) and the evoked inhibitory postsynaptic currents (eIPSCs) in the same cell keeping the E/I balance constant. (A) Schematic representation of the protocol used to record eEPSCs and eEPSCs from the same cell. Holding voltage (Vh) was +10 mV for eIPSCs recording and −70 mV for eIPSCs recording. (B) The graph shows the eEPSCs recorded before and during 5-HT (50 µM) bath application. The EPSCs are normalized to the mean of responses recorded during the control baseline. The traces show one example experiment with the average of postsynaptic responses recorded before (control; 1: 0 to 5 min, black line) and after (5-HT; 2: 15 to 20 min, magenta line) the application of 5-HT. (C) The graph shows the data points and mean values of the normalized sEPSCs for the two conditions: 5-HT (50 µM) and control. (D) The graph shows the eIPSCs recorded before and during 5-HT (50 µM) bath application for the same cells shown in (A,B). The IPSCs are normalized to the mean of responses recorded during the control baseline. The traces show one example experiment with the average of postsynaptic responses recorded before (control; 1: 0 to 5 min, black line) and after (5-HT; 2: 15 to 20 min, magenta line) the application of 5-HT. (E) The graph shows the data points and mean values of the normalized sIPSCs for the two conditions: 5-HT (50 µM) and control for the same cells shown in (A,B). (F) The graph shows the eEPSCs/eIPSCs ratio obtained from signals recorded before and during 5-HT (50 µM) bath application. The eEPSCs/eIPSCs ratio values are normalized to the mean values obtained during the control baseline. The traces show one example experiment with the averages of eEPSCs and eIPSCs recorded in the same cell before (control; 1: 0 to 5 min, black line) and after (5-HT; 2: 15 to 20 min, magenta line) the application of 5-HT. (G) The graph shows the data points and mean values of the normalized eEPSCs/eIPSCs ratio for the two conditions: 5-HT (50 µM) and control for the same cells shown in (A,B). Asterisk indicates statistical significance.
Figure 7
Figure 7
5-HT promotes LTD at excitatory synapses (eLTD). (A) The graph shows the eEPSPs recorded before and after the paired protocol induction in the control condition (without bath application of 5-HT). The eEPSPs are normalized to the mean of responses recorded during the last 5 min of the baseline. The traces show one example experiment with the average of postsynaptic responses recorded before (baseline; 1: 5 to 10 min, black line) and after (post induction; 2: 35 to 40 min, magenta line) the application of the paired protocol. (B) The graph shows the effects of the paired protocol on eEPSPs in the control condition (without bath application of 5-HT). The data points and mean values of the normalized eEPSPs are shown for the two conditions: baseline and post-induction. (C) The graph shows the eEPSPs recorded before and after the paired protocol induction during bath application of 5-HT (50 µM). The eEPSPs are normalized to the mean of responses recorded during the last 5 min of the baseline. The traces show one example experiment with the average of postsynaptic responses recorded before (baseline; 1: 5 to 10 min, black line) and after (post induction; 2: 35 to 40 min, magenta line) the application of the paired protocol. (D) The graph shows the effects of the paired protocol on eEPSPs during bath application of 5-HT (50 µM). The data points and mean values of the normalized eEPSPs are shown for the two conditions: baseline and post-induction. Asterisk indicates statistical significance.
Figure 8
Figure 8
5-HT increases the rheobase for neuronal spiking and the action potential peak amplitude. (A) The recorded example traces of the action potential firing for the two conditions: 5-HT (50 µM) and control. The spiking response is shown for 80, 120, 160, and 200 pA. (B) The graph shows the average of the mean number of action potentials fired for the two conditions: 5-HT (50 µM) and control. The number of action potentials is plotted against the value of the injected current step (pA). (C) The graph shows the data points and mean values of the spike peak amplitude (mV) for the two conditions: 5-HT (50 µM) and control. (D) The graph shows the distribution of rheobase values among the population of recorded cells. The current values of all injected current steps (80, 120, 160, and 200 pA) are plotted against the percentage of cells. (E) The graph shows the mean values of the rheobase values (pA) for the two conditions: 5-HT (50 µM) and control. (F) The graph shows the data points and mean values of the after hyperpolarization (mV) for the two conditions: 5-HT (50 µM) and control. (G) The graph shows the data points and mean values of the spiking frequency (Hz) for the two conditions: 5-HT (50 µM) and control. Asterisk indicates statistical significance.
Figure 9
Figure 9
5-HT prevents the LTD at inhibitory synapses (iLTD). (A) The graph shows the eIPSCs recorded before and after the paired protocol induction in the control condition (without bath application of 5-HT). The eIPSCs are normalized to the mean of responses recorded during the last 5 min of the baseline. The traces show one example experiment with the average of postsynaptic responses recorded before (baseline; 1: 5 to 10 min, black line) and after (post induction; 2: 35 to 40 min, magenta line) the application of the paired protocol. (B) The graph shows the effects of the paired protocol on eIPSCs in the control condition (without bath application of 5-HT). The data points and mean values of the normalized eIPSCs are shown for the two conditions: baseline and post induction. (C) The graph shows the eIPSCs recorded before and after the paired protocol induction during bath application of 5-HT (50 µM). The eIPSCs are normalized to the mean of responses recorded during the last 5 min of the baseline. The traces show one example experiment with the average of postsynaptic responses recorded before (baseline; 1: 5 to 10 min, black line) and after (post induction; 2: 35 to 40 min, magenta line) the application of the paired protocol. (D) The graph shows the effects of the paired protocol on eIPSCs during bath application of 5-HT (50 µM). The data points and mean values of the normalized eIPSCs are shown for the two conditions: baseline and post induction. Asterisk indicates statistical significance.
Figure 10
Figure 10
Schemes summarizing the main findings. (A) 5-HT decreases spontaneous activity by, respectively decreasing and increasing presynaptic excitatory and inhibitory inputs to layer 2/3. (B) The Spike Timing-Dependent Plasticity protocols induce LTD at inhibitory synapses. (C) 5-HT decreases the evoked responses of both excitatory and inhibitory inputs from layer 4 to layer 2/3. These effects leave the E/I ratio unchanged. When the Spike Timing-Dependent Plasticity protocol is applied under the effect of 5-HT, the induction causes LTD at excitatory synapses but keeps inhibition unaffected. This process allows Hebbian plasticity to occur at lower general levels of neural activity.

References

    1. Baumgarten H.G., Grozdanovic Z. Psychopharmacology of central serotonergic systems. Pharmacopsychiatry. 1995;28((Suppl. S2)):73–79. doi: 10.1055/s-2007-979623. - DOI - PubMed
    1. Jacobs B.L., Azmitia E.C., Lim S.B., Cleworth T.W., Horslen B.C., Blouin J.-S., Inglis J.T., Carpenter M.G., Brill J., Shao Z., et al. Structure and function of the brain serotonin system. Physiol. Rev. 1992;72:165–229. doi: 10.1152/physrev.1992.72.1.165. - DOI - PubMed
    1. Bunin M.A., Wightman R. Paracrine neurotransmission in the CNS: Involvement of 5-HT. Trends Neurosci. 1999;22:377–382. doi: 10.1016/S0166-2236(99)01410-1. - DOI - PubMed
    1. Gu Q., Singer W. Involvement of serotonin in developmental plasticity of kitten visual cortex. Eur. J. Neurosci. 1995;7:1146–1153. doi: 10.1111/j.1460-9568.1995.tb01104.x. - DOI - PubMed
    1. Pazos A., Cortés R., Palacios J. Quantitative autoradiographic mapping of serotonin receptors in the rat brain. II. Serotonin-2 receptors. Brain Res. 1985;346:231–249. doi: 10.1016/0006-8993(85)90857-1. - DOI - PubMed

LinkOut - more resources