

Comprehensive Pan-Cancer Mutation Density Patterns in Enhancer RNA
- PMID: 38203707
- PMCID: PMC10778997
- DOI: 10.3390/ijms25010534
Comprehensive Pan-Cancer Mutation Density Patterns in Enhancer RNA
Abstract
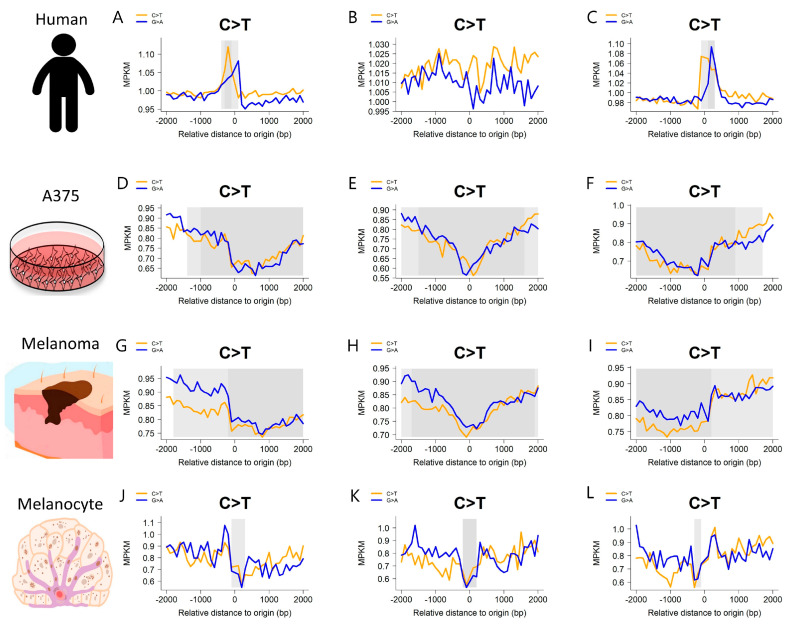
Significant advances have been achieved in understanding the critical role of enhancer RNAs (eRNAs) in the complex field of gene regulation. However, notable uncertainty remains concerning the biology of eRNAs, highlighting the need for continued research to uncover their exact functions in cellular processes and diseases. We present a comprehensive study to scrutinize mutation density patterns, mutation strand bias, and mutation burden in eRNAs across multiple cancer types. Our findings reveal that eRNAs exhibit mutation strand bias akin to that observed in protein-coding RNAs. We also identified a novel pattern, in which mutation density is notably diminished around the central region of the eRNA, but conspicuously elevated towards both the beginning and end. This pattern can be potentially explained by a mechanism involving heightened transcriptional activity and the activation of transcription-coupled repair. The central regions of the eRNAs appear to be more conserved, hinting at a potential mechanism preserving their structural and functional integrity, while the extremities may be more susceptible to mutations due to increased exposure. The evolutionary trajectory of this mutational pattern suggests a nuanced adaptation in eRNAs, where stability at their core coexists with flexibility at their extremities, potentially facilitating their diverse interactions with other genetic entities.
Keywords: enhancer RNA; mutation; mutation density.
Conflict of interest statement
The authors declare no conflict of interest.
Figures


Similar articles
-
Enhancer RNA Transcriptome-Wide Association Study Reveals a Distinctive Class of Pan-Cancer Susceptibility eRNAs.Adv Sci (Weinh). 2025 Apr;12(13):e2411974. doi: 10.1002/advs.202411974. Epub 2025 Feb 14. Adv Sci (Weinh). 2025. PMID: 39950845 Free PMC article.
-
eRNA-IDO: A One-stop Platform for Identification, Interactome Discovery, and Functional Annotation of Enhancer RNAs.Genomics Proteomics Bioinformatics. 2024 Oct 15;22(4):qzae059. doi: 10.1093/gpbjnl/qzae059. Genomics Proteomics Bioinformatics. 2024. PMID: 39178387 Free PMC article.
-
Enhancer RNA (eRNA) in Human Diseases.Int J Mol Sci. 2022 Sep 30;23(19):11582. doi: 10.3390/ijms231911582. Int J Mol Sci. 2022. PMID: 36232885 Free PMC article. Review.
-
eRNAbase: a comprehensive database for decoding the regulatory eRNAs in human and mouse.Nucleic Acids Res. 2024 Jan 5;52(D1):D81-D91. doi: 10.1093/nar/gkad925. Nucleic Acids Res. 2024. PMID: 37889077 Free PMC article.
-
Enhancer RNAs (eRNAs) in Cancer: The Jacks of All Trades.Cancers (Basel). 2022 Apr 14;14(8):1978. doi: 10.3390/cancers14081978. Cancers (Basel). 2022. PMID: 35454885 Free PMC article. Review.
Cited by
-
The dual role of PTPN22 in immune modulation and transplantation tolerance.Hum Cell. 2025 Jan 7;38(2):42. doi: 10.1007/s13577-024-01170-y. Hum Cell. 2025. PMID: 39775468 No abstract available.
-
The potential link between the development of Alzheimer's disease and osteoporosis.Biogerontology. 2025 Jan 20;26(1):43. doi: 10.1007/s10522-024-10181-z. Biogerontology. 2025. PMID: 39832071 Free PMC article. Review.
-
Integrative multi-transcriptomic analysis uncovers core genes and potential defense mechanisms in rice-Magnoporthe oryzae interaction.Plant Cell Rep. 2025 May 7;44(6):114. doi: 10.1007/s00299-025-03490-1. Plant Cell Rep. 2025. PMID: 40332586
-
Porphyromonas gingivalis induced DNA oxidative stress damage by iron overload to deplete CTCF expression and prevent osteogenic differentiation of periodontal ligament stem cells.J Mol Histol. 2025 Jun 2;56(3):182. doi: 10.1007/s10735-025-10467-7. J Mol Histol. 2025. PMID: 40455363
-
Exosome-based immunotherapy in hepatocellular carcinoma.Clin Exp Med. 2025 Apr 24;25(1):127. doi: 10.1007/s10238-025-01659-2. Clin Exp Med. 2025. PMID: 40274634 Free PMC article. Review.
References
MeSH terms
Substances
Grants and funding
LinkOut - more resources
Full Text Sources
Medical
