. 2023 Dec 31;25(1):559.
doi: 10.3390/ijms25010559.

HSA-ZW800-PEG for Enhanced Optophysical Stability and Tumor Targeting

Affiliations

HSA-ZW800-PEG for Enhanced Optophysical Stability and Tumor Targeting

Paul Jang et al. Int J Mol Sci. .

Abstract

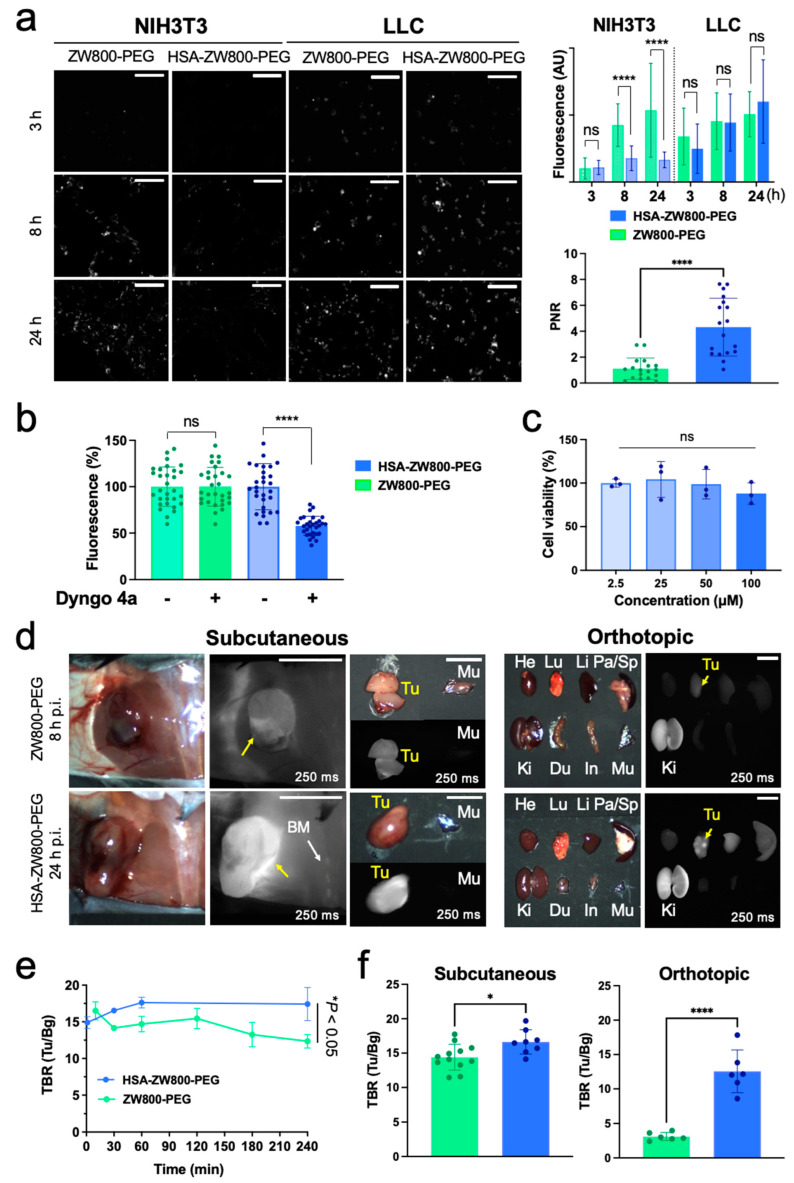
Small molecule fluorophores often face challenges such as short blood half-life, limited physicochemical and optical stability, and poor pharmacokinetics. To overcome these limitations, we conjugated the zwitterionic near-infrared fluorophore ZW800-PEG to human serum albumin (HSA), creating HSA-ZW800-PEG. This conjugation notably improves chemical, physical, and optical stability under physiological conditions, addressing issues commonly encountered with small molecules in biological applications. Additionally, the high molecular weight and extinction coefficient of HSA-ZW800-PEG enhances biodistribution and tumor targeting through the enhanced permeability and retention effect. The unique distribution and elimination dynamics, along with the significantly extended blood half-life of HSA-ZW800-PEG, contribute to improved tumor targetability in both subcutaneous and orthotopic xenograft tumor-bearing animal models. This modification not only influences the pharmacokinetic profile, affecting retention time and clearance patterns, but also enhances bioavailability for targeting tissues. Our study guides further development and optimization of targeted imaging agents and drug-delivery systems.

Keywords: NIR imaging; enhanced permeability and retention; human serum albumin; photostability; tumor targeting.


Conflict of interest statement

The authors declare no conflicts of interest. H.S.C. reports a relationship with Nawoo Vision and Ferrex Therapeutics: board membership, stock, and royalties.

Figures

Figure 1
Figure 1
Preparation and optophysical analyses of HSA-ZW800-PEG. (a) Schematic illustration of passive and active tumor targeting using HSA-ZW800-PEG. (b) Chemical synthesis of HSA-ZW800-PEG. (c) High-performance liquid chromatography (HPLC) of ZW800-PEG and HSA-ZW800-PEG equipped with a photodiode array (PDA) detector (200–800 nm). 1x PBS, pH 7.4 was used as a running buffer. (d) Absorbance (abs) and fluorescence (Fl) spectra of HSA-ZW800-PEG at a concentration of 2.5 µM in 5% bovine serum albumin (BSA) solution. (e) Optophysical properties of HSA-ZW800-PEG by comparing with ZW800-PEG. MW = molecular weight; HD = hydrodynamic diameter; λAbs = absorption maxima; λEm = emission maxima; ε = molar extinction coefficient; QY = quantum yield. * Values were adapted from our previous publication [19].
Figure 1
Figure 1
Preparation and optophysical analyses of HSA-ZW800-PEG. (a) Schematic illustration of passive and active tumor targeting using HSA-ZW800-PEG. (b) Chemical synthesis of HSA-ZW800-PEG. (c) High-performance liquid chromatography (HPLC) of ZW800-PEG and HSA-ZW800-PEG equipped with a photodiode array (PDA) detector (200–800 nm). 1x PBS, pH 7.4 was used as a running buffer. (d) Absorbance (abs) and fluorescence (Fl) spectra of HSA-ZW800-PEG at a concentration of 2.5 µM in 5% bovine serum albumin (BSA) solution. (e) Optophysical properties of HSA-ZW800-PEG by comparing with ZW800-PEG. MW = molecular weight; HD = hydrodynamic diameter; λAbs = absorption maxima; λEm = emission maxima; ε = molar extinction coefficient; QY = quantum yield. * Values were adapted from our previous publication [19].
Figure 2
Figure 2
In vitro optophysical stability of HSA-ZW800-PEG. (a) Color and NIR images (exposure time = 1000 ms, Scale bars = 0.5 cm) of ZW800-PEG, HSA-ZW800-PEG, and ICG in saline at a concentration of 20 µM pre- and post-exposure 760 nm laser diode (3 mW·cm−2) with a white light up to 240 min. The photostability pattern of each fluorophore was calculated by plotting the percent fluorescence (n = 3; mean ± SD). (b) Absorbance spectra of HSA-ZW800-PEG at various concentrations in saline. (c) NIR fluorescence images of HSA-ZW800-PEG at different concentrations in saline (exposure time = 100 ms, Scale bars = 0.5 cm). Optical fluorescence quenching of HSA-ZW800-PEG was observed at concentrations over 12.5 µM.
Figure 3
Figure 3
Biodistribution and pharmacokinetics of HSA-ZW800-PEG. (a) 50 nmol of HSA-ZW800-PEG was injected retro-orbitally in CD-1 mice at 4 h prior to imaging. Abbreviations used are Bl: bladder; BM: bone marrow; BV: brain vasculature; CP: choroid plexus; Du: duodenum; In: intestine; Ki: kidneys; Li: liver; LN: lymph nodes; Lu: lungs; Pa: pancreas; Sp: spleen; Ur: ureter. Scale bars = 0.5 cm. (b) Signal-to-background ratio (SBR) of resected organs (Ors) against system background (Bg) measured by ImageJ version 1.53t and compared statistically using unpaired multiple t-tests (n = 3; mean ± SD; * p < 0.05, ** p < 0.01, ns = not significant). (c) Blood curves of HSA-ZW800-PEG and ZW800-PEG in normal mice. (d) Pharmacokinetic (PK) parameters of fluorophores (t1/2α: distribution half-life; t1/2β: elimination half-life; AUC: area under the curve; Vd: volume of distribution; % ID: percent injected dose) were calculated using Prism 9 software (n = 3, mean ± SD). Urinary excretion was calculated at 4 h post-injection. * Values were adapted from our previous publication [19].
Figure 4
Figure 4
Tumor targetability of HSA-ZW800-PEG and ZW800-PEG in lung cancer cell lines and tumor-bearing animal models. (a) Cellular uptake and intracellular localization after treating 100 µM of each fluorophore in NIH3T3 and LLC cell lines. Fluorescence images were obtained using Cytation5 at each time point and compared statistically using unpaired multiple t-tests (n = 20–30, mean ± SD; **** p < 0.0001, ns = not significant). The positive-to-negative ratio (PNR) was analyzed identically for the experiment condition by analyzing NIR images using ImageJ version 1.53t. Scale bars = 100 μm. (b) Cell binding inhibition test after pretreatment with 30 μM of Dyngo 4a followed by incubation with 100 μM of HSA-ZW800-PEG and ZW800-PEG for 8 h. Statistically compared using unpaired t-tests (n = 30, mean ± SD; **** p < 0.0001, ns = not significant) (c) Cell viability test was performed by treating 2.5–100 µM of HSA-ZW800-PEG in NIH3T3 cell lines for 24 h. The number of cells in different concentrations was calculated using bright-field images and compared statistically using one-way ANOVA followed by Tukey’s multiple comparisons test (n = 3, ns = not significant). (d) 50–100 nmol (2–4 μmol/kg) of each fluorophore was injected into orthotopic and subcutaneous xenograft LLC tumor-bearing B6 male mice. Shown are representative images obtained at 8 h post-injection of ZW800-PEG and 24 h post-injection of HSA-ZW800-PEG, respectively. Abbreviations used are BM: bone marrow; Du: duodenum; In: intestine; Ki: kidneys; Li: liver; Lu: lungs; Pa: pancreas; Sp: spleen; Tu: tumor. Scale bars = 0.5 cm. (e) Kinetics of tumor-to-background ratios (TBRs) obtained from subcutaneous tumors (Tu) compared with background (Bg). (f) TBR of obtained tumors from subcutaneous versus orthotopic xenograft animal models. NIR fluorescence images for each condition have identical exposure times (exposure time = 250 ms). Fluorescence images were obtained using the FLARE imaging system at each time point and compared statistically using unpaired t-tests (n = 6 or 12; mean ± SD; * p < 0.05, **** p < 0.0001).

Similar articles

Cited by

References

    1. Feng B., Chu F., Bi A., Huang X., Fang Y., Liu M., Chen F., Li Y., Zeng W. Fidelity-oriented fluorescence imaging probes for beta-galactosidase: From accurate diagnosis to precise treatment. Biotechnol. Adv. 2023;68:108244. doi: 10.1016/j.biotechadv.2023.108244. - DOI - PubMed
    1. Barroso M., Monaghan M.G., Niesner R., Dmitriev R.I. Probing organoid metabolism using Fluorescence Lifetime Imaging Microscopy (FLIM): The next frontier of drug discovery and disease understanding. Adv. Drug Deliv. Rev. 2023;201:115081. doi: 10.1016/j.addr.2023.115081. - DOI - PMC - PubMed
    1. Thenuwara G., Curtin J., Tian F. Advances in Diagnostic Tools and Therapeutic Approaches for Gliomas: A Comprehensive Review. Sensors. 2023;23:9842. doi: 10.3390/s23249842. - DOI - PMC - PubMed
    1. Ding C., Ren T. Near infrared fluorescent probes for detecting and imaging active small molecules. Coord. Chem. Rev. 2023;482:215080. doi: 10.1016/j.ccr.2023.215080. - DOI
    1. Yin H., Jiang W., Liu Y., Zhang D., Wu F., Zhang Y., Li C., Chen G., Wang Q. Advanced near-infrared light approaches for neuroimaging and neuromodulation. BMEMat. 2023;1:e12023. doi: 10.1002/bmm2.12023. - DOI