

Pigment Diversity in Leaves of Caladium × hortulanum Birdsey and Transcriptomic and Metabolic Comparisons between Red and White Leaves
- PMID: 38203776
- PMCID: PMC10779550
- DOI: 10.3390/ijms25010605
Pigment Diversity in Leaves of Caladium × hortulanum Birdsey and Transcriptomic and Metabolic Comparisons between Red and White Leaves
Abstract
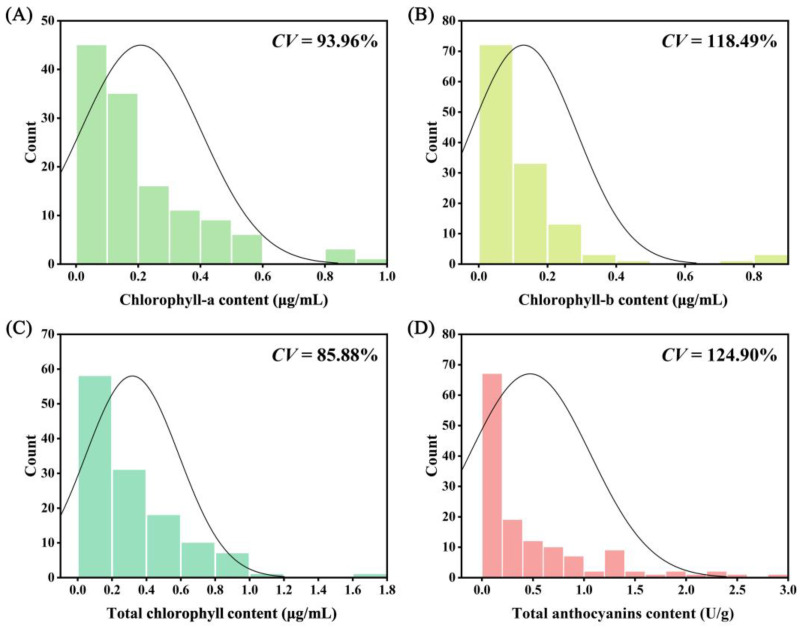
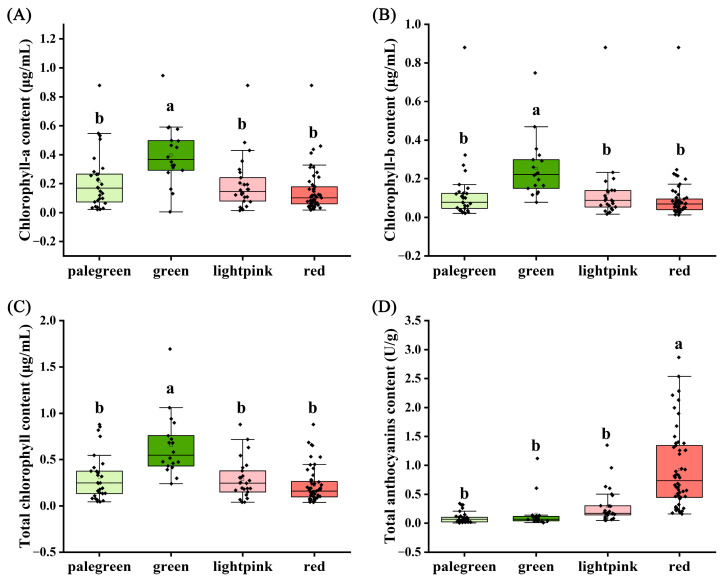
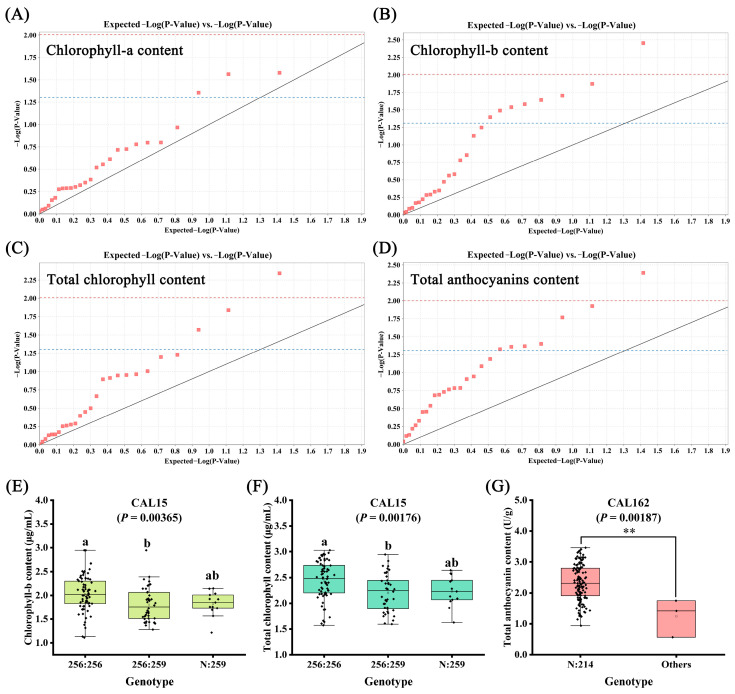
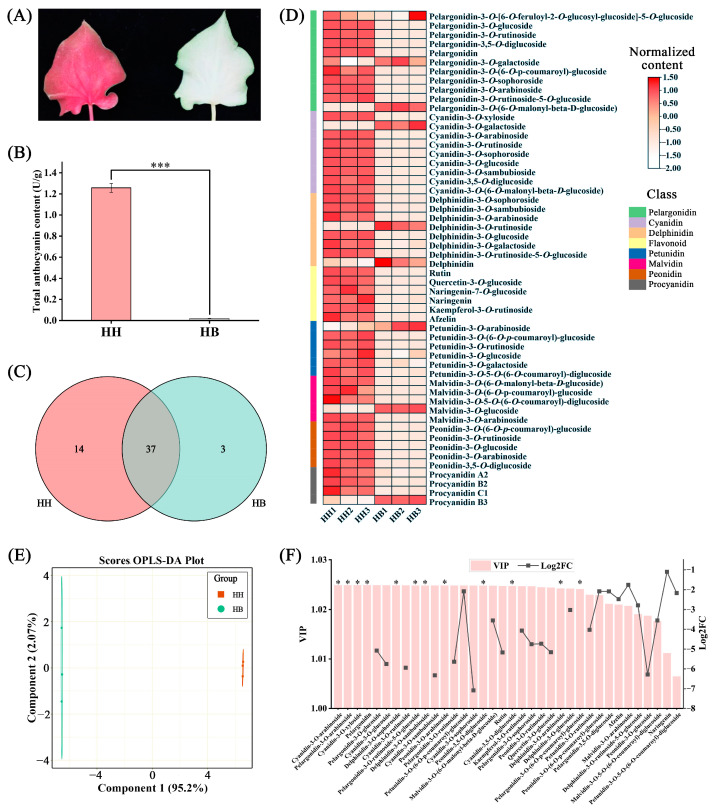
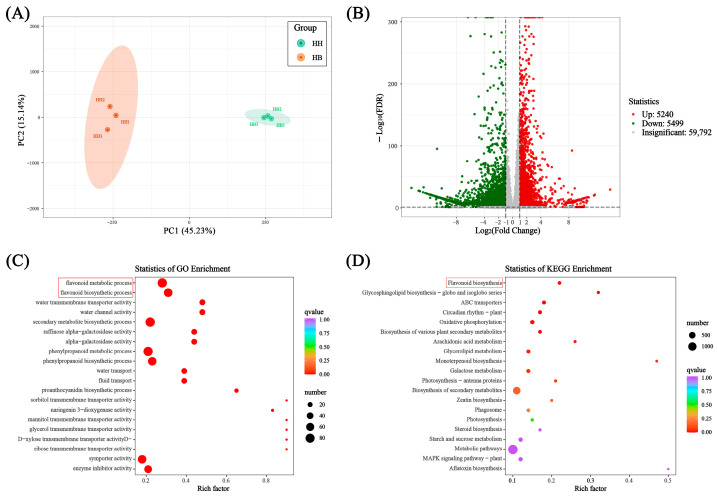
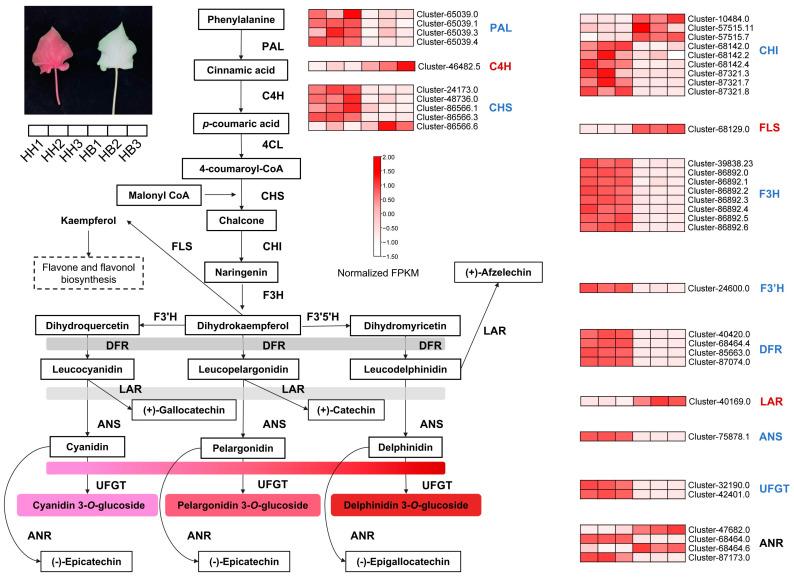
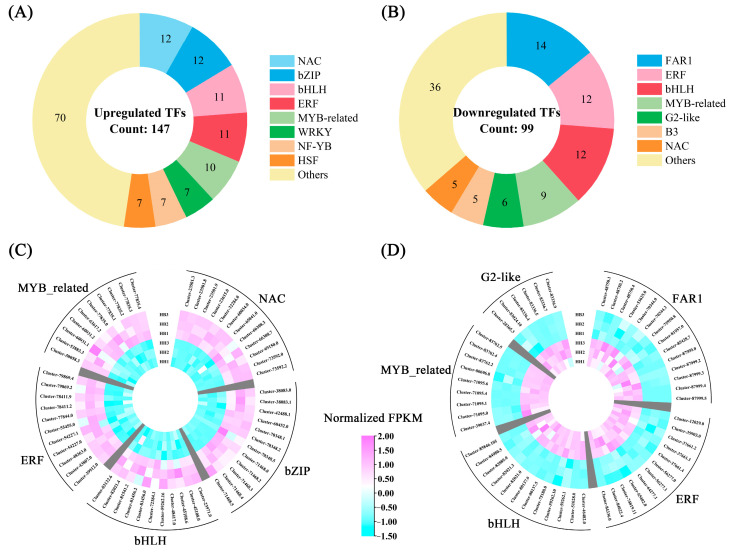
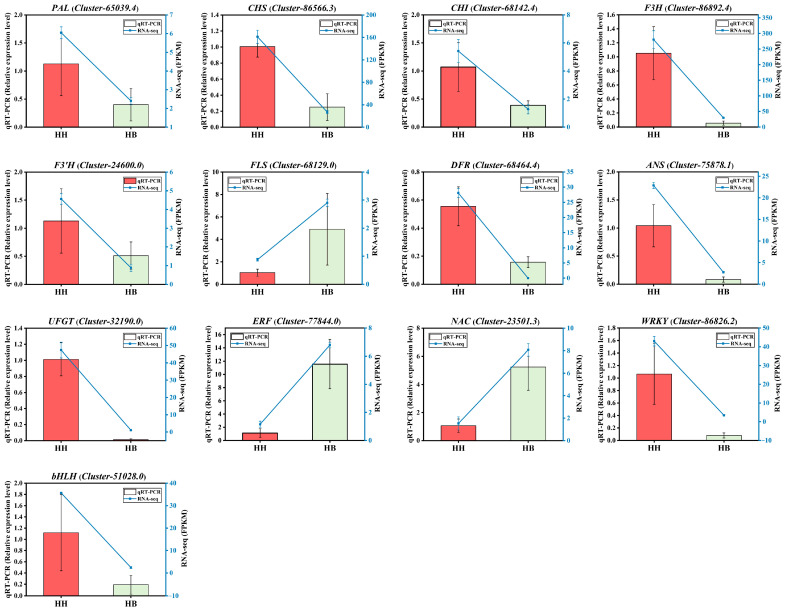
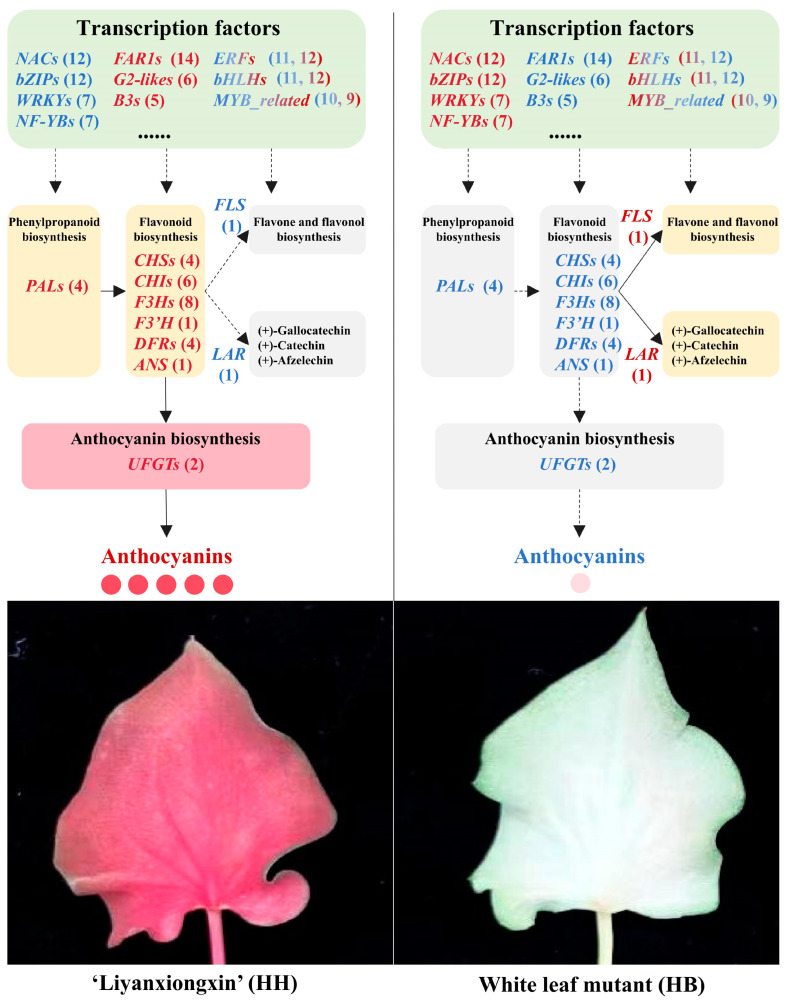
Leaf color is a key ornamental characteristic of cultivated caladium (Caladium × hortulanum Birdsey), a plant with diverse leaf colors. However, the genetic improvement of leaf color in cultivated caladium is hindered by the limited understanding of leaf color diversity and regulation. In this study, the chlorophyll and anthocyanin content of 137 germplasm resources were measured to explore the diversity and mechanism of leaf color formation in cultivated caladium. Association analysis of EST-SSR markers and pigment traits was performed, as well as metabolomics and transcriptomics analysis of a red leaf variety and its white leaf mutant. We found significant differences in chlorophyll and anthocyanin content among different color groups of cultivated caladium, and identified three, eight, three, and seven EST-SSR loci significantly associated with chlorophyll-a, chlorophyll-b, total chlorophyll and total anthocyanins content, respectively. The results further revealed that the white leaf mutation was caused by the down-regulation of various anthocyanins (such as cyanidin-3-O-rutinoside, quercetin-3-O-glucoside, and others). This change in concentration is likely due to the down-regulation of key genes (four PAL, four CHS, six CHI, eight F3H, one F3'H, one FLS, one LAR, four DFR, one ANS and two UFGT) involved in anthocyanin biosynthesis. Concurrently, the up-regulation of certain genes (one FLS and one LAR) that divert the anthocyanin precursors to other pathways was noted. Additionally, a significant change in the expression of numerous transcription factors (12 NAC, 12 bZIP, 23 ERF, 23 bHLH, 19 MYB_related, etc.) was observed. These results revealed the genetic and metabolic basis of leaf color diversity and change in cultivated caladium, and provided valuable information for molecular marker-assisted selection and breeding of leaf color in this ornamental plant.
Keywords: Caladium × hortulanum; anthocyanin; chlorophyll; leaf color; metabolome; transcriptome.
Conflict of interest statement
The authors declare no conflicts of interest.
Figures
Similar articles
-
Diversity, classification, and EST-SSR-based association analysis of caladium ornamental traits.Physiol Plant. 2023 Jan;175(1):e13841. doi: 10.1111/ppl.13841. Physiol Plant. 2023. PMID: 36513960
-
Mechanisms for leaf color changes in Osmanthus fragrans 'Ziyan Gongzhu' using physiology, transcriptomics and metabolomics.BMC Plant Biol. 2023 Sep 27;23(1):453. doi: 10.1186/s12870-023-04457-8. BMC Plant Biol. 2023. PMID: 37752431 Free PMC article.
-
Molecular and Metabolic Insights into Anthocyanin Biosynthesis for Leaf Color Change in Chokecherry (Padus virginiana).Int J Mol Sci. 2021 Oct 2;22(19):10697. doi: 10.3390/ijms221910697. Int J Mol Sci. 2021. PMID: 34639038 Free PMC article.
-
For a Colorful Life: Recent Advances in Anthocyanin Biosynthesis during Leaf Senescence.Biology (Basel). 2024 May 9;13(5):329. doi: 10.3390/biology13050329. Biology (Basel). 2024. PMID: 38785811 Free PMC article. Review.
-
A Comprehensive Review: Genetic Mapping of Genes Associated with Green Leaf Color Variations in Main Vegetable Crops.Plants (Basel). 2025 May 25;14(11):1609. doi: 10.3390/plants14111609. Plants (Basel). 2025. PMID: 40508284 Free PMC article. Review.
Cited by
-
Transcriptome sequencing and anthocyanin metabolite analysis involved in leaf red color formation of Cinnamomum camphora.Sci Rep. 2024 Dec 28;14(1):31470. doi: 10.1038/s41598-024-83235-4. Sci Rep. 2024. PMID: 39732975 Free PMC article.
-
Decoding the color palette in the ornamental bracts of Globba spp.: insights from phenotypic, metabolomic, and transcriptomic analyses.Planta. 2025 Jun 2;262(1):11. doi: 10.1007/s00425-025-04726-w. Planta. 2025. PMID: 40457093
-
Advances in Bract Coloration: Diversity, Pigment Synthesis, and Regulatory Mechanisms in Ornamental Plants.Plants (Basel). 2025 Jul 13;14(14):2155. doi: 10.3390/plants14142155. Plants (Basel). 2025. PMID: 40733391 Free PMC article. Review.
References
-
- Zhao M.-H., Li X., Zhang X.-X., Zhang H., Zhao X.-Y. Mutation Mechanism of Leaf Color in Plants: A Review. Forests. 2020;11:851. doi: 10.3390/f11080851. - DOI
-
- Xie Y., Pei N., Hao Z., Shi Z., Chen L., Mai B., Liu Q., Luo J., Luo M., Sun B. Juvenile Leaf Color Changes and Physiological Characteristics of Acer tutcheri (Aceraceae) during the Spring Season. Forests. 2023;14:328. doi: 10.3390/f14020328. - DOI
MeSH terms
Substances
Grants and funding
LinkOut - more resources
Full Text Sources
Research Materials
Miscellaneous
