. 2024 Jan 3;25(1):618.
doi: 10.3390/ijms25010618.

Bidirectional Allosteric Coupling between PIP2 Binding and the Pore of the Oncochannel TRPV6

Affiliations

Bidirectional Allosteric Coupling between PIP2 Binding and the Pore of the Oncochannel TRPV6

Christina Humer et al. Int J Mol Sci. .

Abstract

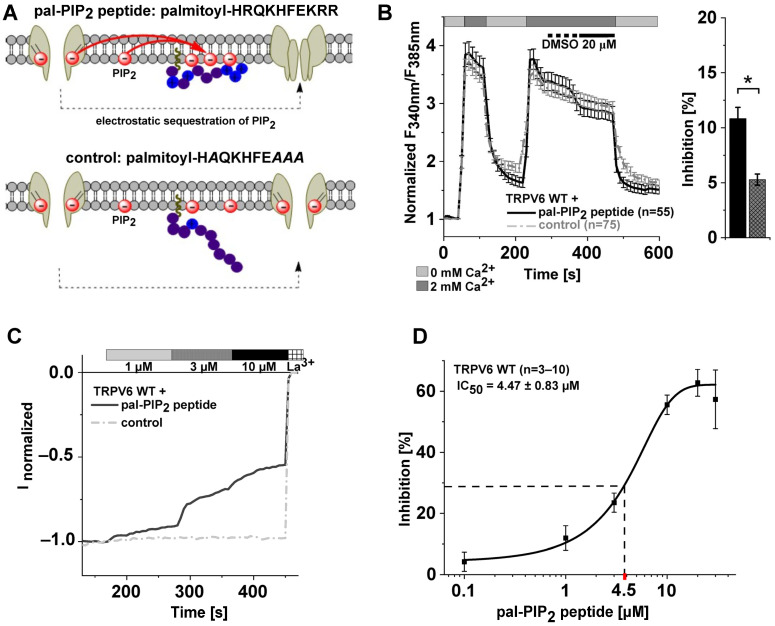
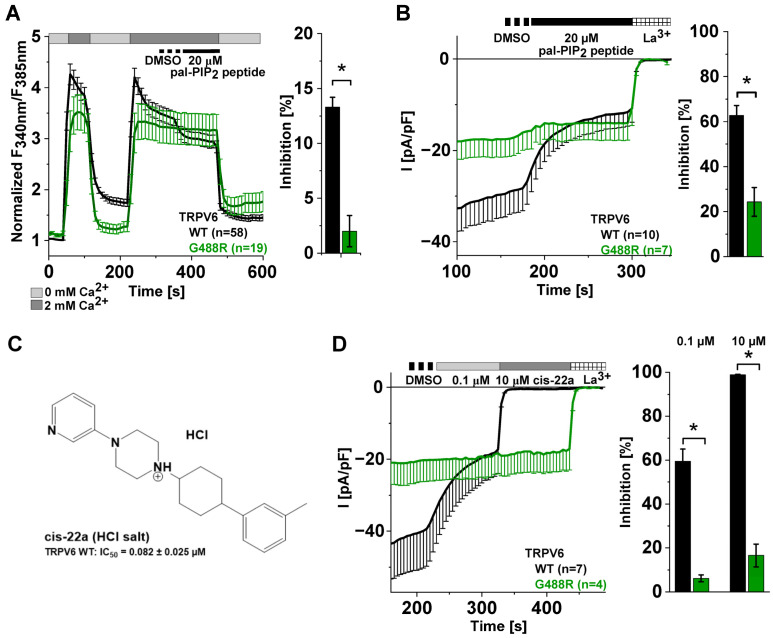
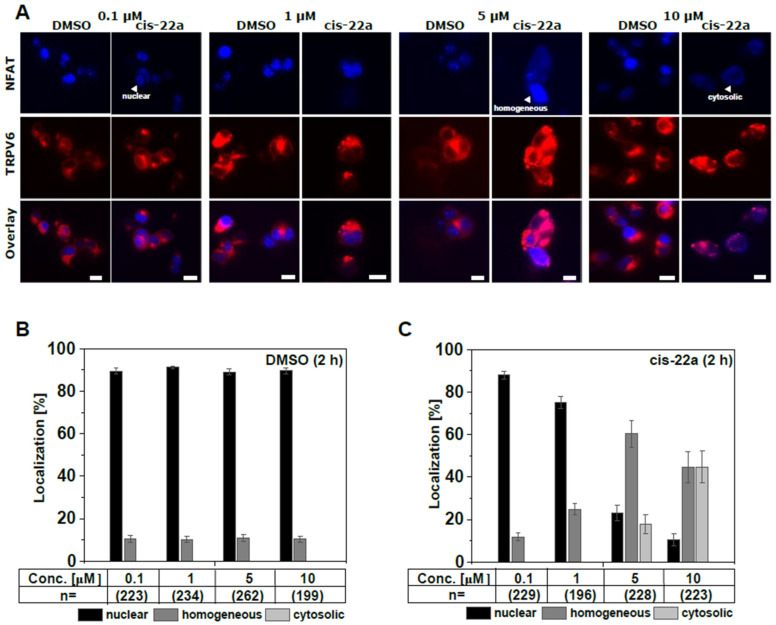
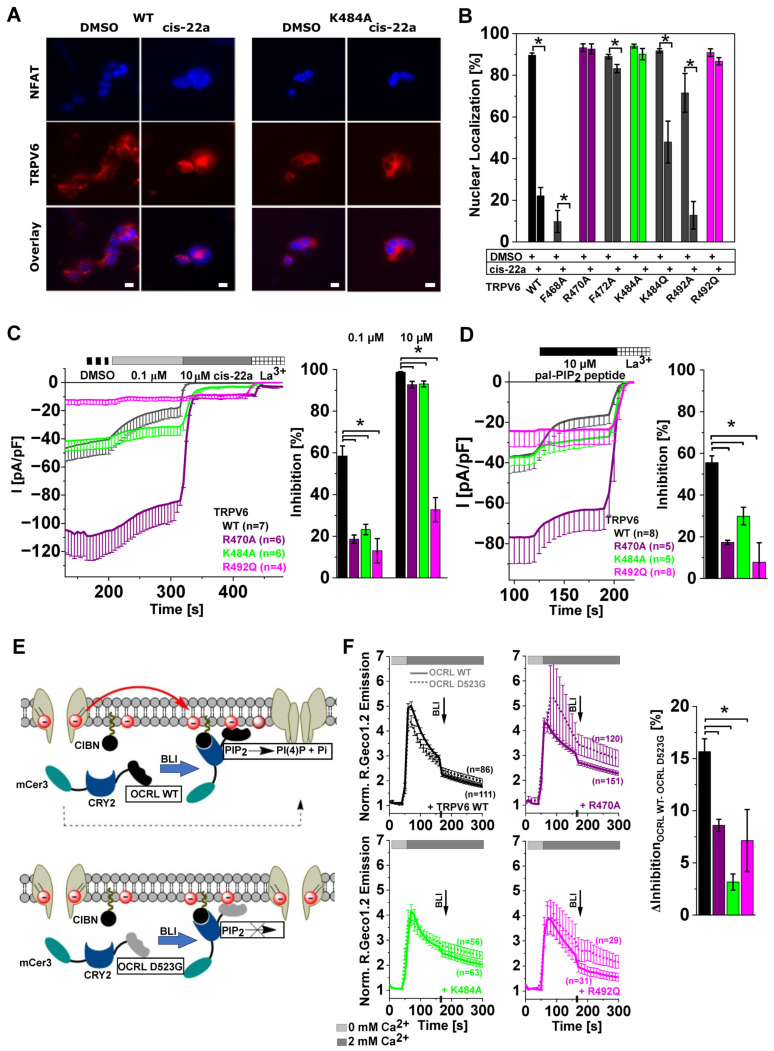
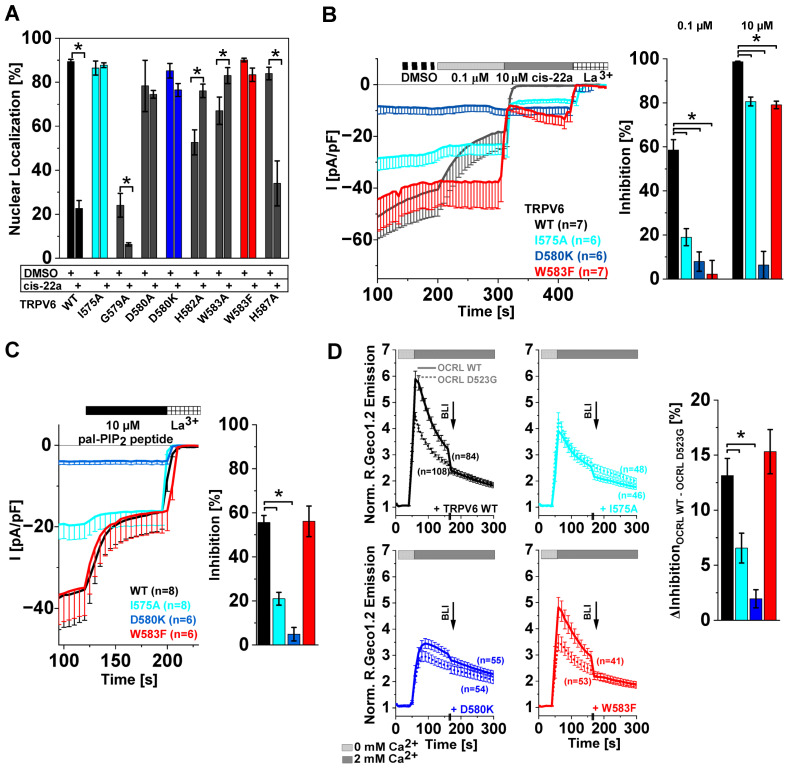
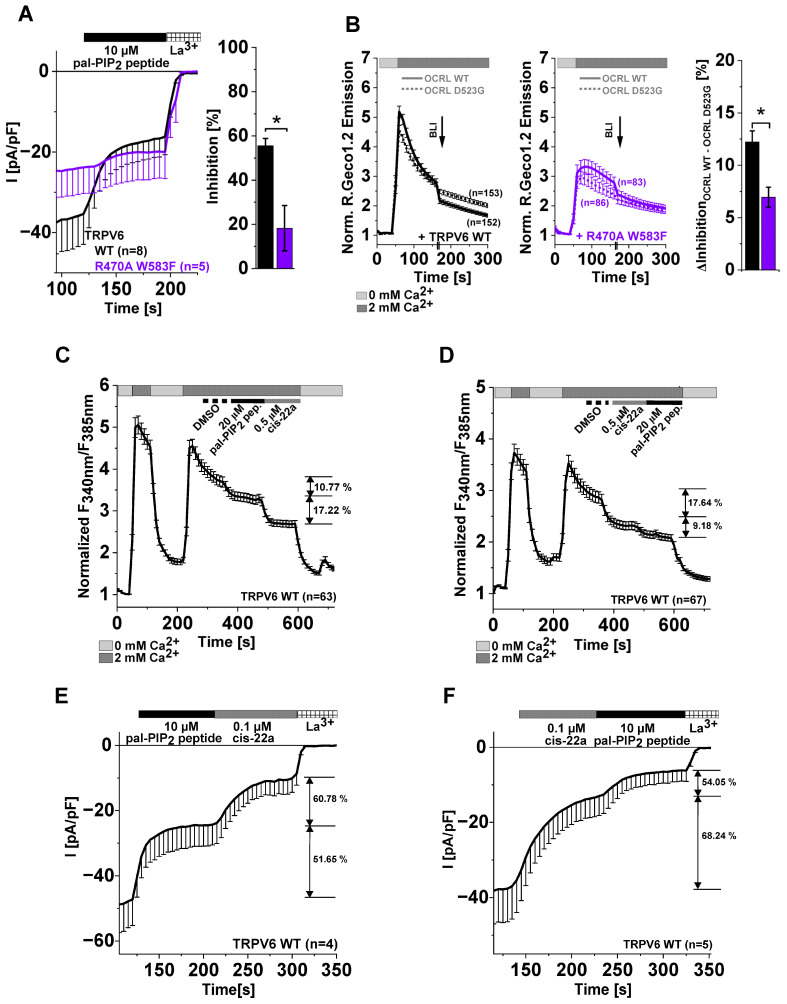
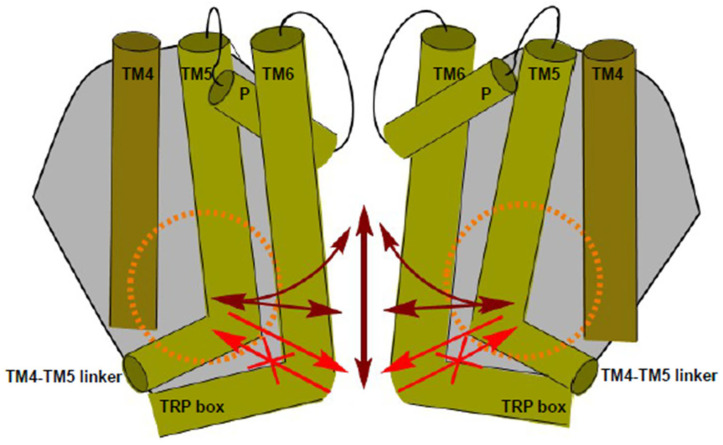
The epithelial ion channel TRPV6 plays a pivotal role in calcium homeostasis. Channel function is intricately regulated at different stages, involving the lipid phosphatidylinositol-4,5-bisphosphate (PIP2). Given that dysregulation of TRPV6 is associated with various diseases, including different types of cancer, there is a compelling need for its pharmacological targeting. Structural studies provide insights on how TRPV6 is affected by different inhibitors, with some binding to sites else occupied by lipids. These include the small molecule cis-22a, which, however, also binds to and thereby blocks the pore. By combining calcium imaging, electrophysiology and optogenetics, we identified residues within the pore and the lipid binding site that are relevant for regulation by cis-22a and PIP2 in a bidirectional manner. Yet, mutation of the cytosolic pore exit reduced inhibition by cis-22a but preserved sensitivity to PIP2 depletion. Our data underscore allosteric communication between the lipid binding site and the pore and vice versa for most sites along the pore.

Keywords: PIP2; TRPV6; calcium; cis-22a; inhibition; lipid.


Conflict of interest statement

The authors declare no conflict of interest.

Figures

Figure 1
Figure 1
TRPV6 activity is sensitive to pal-PIP2 peptide administration. (A) Scheme of electrostatic PIP2 sequestration by positive charges of the pal-PIP2 peptide (upper panel). The consequent lower amount of free PIP2 within the membrane leads, depending on the respective interaction strength, to dissociation of the lipid from other proteins, given constant equilibration between free PIP2 and protein-bound PIP2. This is impeded by substituting positively charged residues by alanine in the palmitoylated control peptide (lower panel). (B) (left): Normalized Fura-2 measurements (mean ± SEM) on HEK293 cells overexpressing TRPV6 WT treated either with 20 μM pal-PIP2 peptide (black solid line) or the control peptide (grey dashed line). Before peptide addition, accordingly diluted DMSO was perfused as solvent control, as indicated. (right): Corresponding mean reduction (±SEM) in signal intensity after peptide administration; the asterisk (*) indicates statistical significance (p < 0.05) between treatment with the pal-PIP2 peptide (black) and the control peptide (grey). (C) Representative normalized whole-cell current of TRPV6 WT-transfected HEK293 cells obtained during perfusion with the indicated dose of either the pal-PIP2 peptide (black, solid) or the control peptide (grey, dashed). At the end of the measurements, currents were blocked by 1 mM La3+, as indicated. (D) Dose–response curve of TRPV6 WT inhibition by the pal-PIP2 peptide using a Hill fit and the calculated IC50 value (means ± SEM; Hill coefficient: 1.95).
Figure 2
Figure 2
A mutation-based increase in PIP2 affinity reduces TRPV6 sensitivity to PIP2 depletion and lowers inhibition by cis-22a. (A) (left): Normalized Fura-2 measurements (mean ± SEM) on HEK293 cells expressing TRPV6 WT (black) or TRPV6 G488R (green) treated with 20 μM pal-PIP2 peptide subsequent to the solvent control (DMSO). (right): Mean inhibition (± SEM) derived from the measurements on TRPV6 WT (black) and TRPV6 G488R (green) shown on the left. (B) (left): Averaged whole-cell current densities (−SEM) of HEK293 cells transfected with TRPV6 WT (black) or TRPV6 G488R (green). Cells were successively perfused with DMSO, 20 μM pal-PIP2 peptide, and 1 mM La3+, as indicated. (right): Mean inhibition (±SEM) derived from the measurements shown on the left. (C) Chemical structure of the TRPV6 inhibitor cis-22a and the previously determined IC50 value [47]. (D) (left): Mean whole-cell current densities (−SEM) recorded from HEK293 cells expressing TRPV6 WT (black) or TRPV6 G488R (green). Throughout the measurements, cells were kept in 10 mM Ca2+ solution, containing the consecutively added DMSO, cis-22a (0.1 and 10 μM), and 1 mM La3+. (right): Block diagram of the respective extents of inhibition by cis-22a relative to the La3+ block. In all bar charts, asterisks (*) indicate statistical significance between TRPV6 WT and the mutant (p < 0.05).
Figure 3
Figure 3
Cis-22a-based inhibition of TRPV6 WT reduces NFAT basal nuclear localization in a dose-dependent manner. (A) Exemplary fluorescence images on HEK293 cells co-transfected with N-terminally CFP-tagged NFAT (cyan) and TagRFP-labeled TRPV6 WT (red) after incubation for two hours with DMSO (solvent control) or cis-22a at increasing concentrations (0.1 μM to 10 μM). The scale bar indicates 10 μm. (B) Average (mean ± SEM) localization of NFAT in the nucleus (black), the cytosol (light grey), or an indifferent, homogeneous distribution after incubation with different concentrations of DMSO for 2 h serving as control for the measurements shown in (C), representing the mean (±SEM) localization of NFAT upon co-expression with TRPV6 WT following treatment with the indicated dose of cis-22a for two hours.
Figure 4
Figure 4
Point mutations within the extended TM4-TM5 linker/LBS-2 reduce channel sensitivity to PIP2 depletion and lower inhibition by cis-22a. (A) Representative fluorescence images on HEK293 cells co-transfected with CFP-NFAT (cyan) and TagRFP-labeled TRPV6 (red) WT (left) or TRPV6 K484A (right) recorded after incubation for two hours with DMSO or 5 μM cis-22a. The scale bar indicates 10 μm. (B) Average (mean ± SEM) of cells showing a nuclear localization of NFAT upon co-expression with TRPV6 WT or the indicated mutants after treatment with DMSO or 5 μM cis-22a for two hours. Asterisks (*) indicate statistically significant differences (p < 0.05) in nuclear localization between both treatments. (C) (Left): Mean (−SEM) whole-cell current density of TRPV6 WT/R470A/K484A or R492Q expressing HEK293 cells recorded in 10 mM Ca2+ solution successively supplemented with DMSO, 0.1 μM cis-22a, 10 μM cis-22a, and 1 mM La3+, as indicated. (right): Corresponding mean (±SEM) levels of inhibition reached by 0.1 μM and 10 μM cis-22a relative to the La3+ block. (D) Time traces (mean − SEM) of whole-cell current densities of HEK293 cells transfected with the same constructs as in (C) upon treatment with 10 μM pal-PIP2 peptide (left) and the corresponding values of inhibition (right). (E) Scheme on the components and principle of the optogenetic PIP2 depletion system. Blue light illumination (BLI) triggers interactions between CRY2 and prenylated, thus membrane-anchored, CIBN, which brings the CRY2-linked phosphatase domain of OCRL to the membrane. This localization enables PIP2 depletion by OCRL WT (upper panel) but not in the case of the catalytically inactive D523G mutant (lower panel). (F) (left): Time traces of normalized R.Geco1.2 intensities (mean ± SEM) derived from HEK293 cells co-expressing TRPV6 WT or the indicated mutant with the optogenetic PIP2 depletion system including either OCRL WT (solid line) or OCRL D523G (dashed line). CRY2-CIBN interactions were triggered by illumination with 475 nm for 30 s, as indicated by the arrow. The extents of reduction in signal intensity were determined for both constellation (OCRL WT or D523G) for each TRPV6 construct and the reduction derived upon co-expression of the inactive OCRL mutant was consequently subtracted from the value determined for OCRL WT to yield channel inhibition due to phosphatase activity ((right); mean ± SEM). For the shown patch clamp and Ca2+ imaging data, asterisks (*) indicate statistical significance between TRPV6 WT and mutants (p < 0.05).
Figure 5
Figure 5
A reduction in the inhibitory potential of cis-22a on TRPV6 pore mutants does not necessarily go along with a lower sensitivity to PIP2 depletion. (A) NFAT screening data on nuclear localization of CFP-tagged NFAT in HEK293 cells expressing TRPV6 pore mutants and the wildtype control after incubation with 5 μM cis-22a or analogously diluted DMSO for two hours. The asterisk (*) indicates a statistically significant difference in nuclear NFAT localization between both treatments for the respective TRPV6 construct. (B) (left): Average (mean − SEM) whole-cell current density recorded in HEK293 cells expressing TRPV6 WT or the pore mutants TRPV6 I575A, TRPV6 D580K, or TRPV6 W583F in 10 mM Ca2+ solution upon consecutive addition of DMSO, 0.1 μM cis-22a, 10 μM cis-22a, and 1 mM La3+. (right): Mean (±SEM) levels of inhibition reached by 0.1 μM and 10 μM cis-22a, corresponding to the time traces. (C) Whole-cell patch clamp-based analysis of the sensitivity of TRPV6 I575A, TRPV6 D580K, TRPV6 W583F, and the wildtype control to PIP2 sequestration by 10 μM pal-PIP2 peptide ((left): time traces, mean − SEM; (right): mean percent of inhibition by 10 μM pal-PIP2 peptide ± SEM). (D) Ca2+ imaging data (normalized mean R.Geco1.2 emission ± SEM) on optogenetic PIP2 depletion in HEK293 cells upon co-expressing TRPV6 WT or the indicated mutant with prenylated CIBN, CRY2-OCRL WT (solid lines), or the D523G mutant (dashed lines), respectively. The difference in inhibition in the presence of OCRL WT and OCRL D523G derived from the time traces on the left was used to evaluate TRPV6 inhibition by phosphatase activation (right, mean ± SEM). For the shown patch clamp data and R.Geco1.2 measurements, asterisks (*) indicate statistical significance between TRPV6 WT and mutants (p < 0.05).
Figure 6
Figure 6
Pretreatment of TRPV6 with pal-PIP2 peptide or cis-22a does not alter inhibition by the consecutively added other compound. (A) Whole-cell current densities (mean − SEM) of HEK293 cells transfected with TRPV6 WT or the LBS-2/pore double mutant TRPV6 R470A W583F upon treatment with 10 μM pal-PIP2 peptide (left) and the extents of inhibition therefrom derived relative to the La3+ block (right). (B) Normalized R.Geco1.2 emission intensities (mean ± SEM) derived from measurements on HEK293 cells co-expressing TRPV6 WT (left) or TRPV6 R470A W583F (middle) with the optogenetic PIP2 depletion system, including either OCRL WT (solid line) or the inactive control OCRL D523G (dashed line). The differences in signal reduction after blue light illumination (BLI, 475 nm 30 s) between the measurements made in the context of OCRL WT and OCRL D523G for TRPV6 WT and the mutant are shown on the (right). For the bar charts in (A,B), the asterisk (*) indicates statistical significance (p < 0.05) between the TRPV6 WT control and the mutant. (C) Normalized Fura-2 measurements (mean ± SEM) on HEK293 cells overexpressing TRPV6 WT upon consecutive perfusion with 20 μM pal-PIP2 peptide and 0.5 μM cis-22a following the DMSO solvent control, as indicated by the bars. The mean percentage of inhibition by the pal-PIP2 peptide and cis-22a is highlighted by arrows. (D) Analogous measurement to (C) with the reverse order of cis-22a and pal-PIP2 peptide application. (E) Whole-cell current densities (mean − SEM) of HEK293 cells transfected with TRPV6 WT upon treatment with 10 μM pal-PIP2 peptide followed by 0.1 μM cis-22a and 1 mM La3+; the corresponding measurements, including the reverse order of application (0.1 μM cis-22a, 10 μM pal-PIP2 peptide), are shown in (F). In both graphs, the mean percentage of inhibition by either compound is indicated by the arrows.
Figure 7
Figure 7
Position-dependent bidirectional allosteric coupling between LBS-2 and the pore. LBS-2 (orange, dashed circle) influences upper and lower regions of the pore. Allosteric communication exists also along the ion permeation pathway and while upper loci within the pore affect LBS-2, the cytosolic exit site TRPV6 W583 is devoid of retrograde coupling to LBS-2, as indicated by the arrows.

Similar articles

References

    1. Idevall-Hagren O., Dickson E.J., Hille B., Toomre D.K., De Camilli P. Optogenetic control of phosphoinositide metabolism. Proc. Natl. Acad. Sci. USA. 2012;109:E2316–E2323. doi: 10.1073/pnas.1211305109. - DOI - PMC - PubMed
    1. Katan M., Cockcroft S. Phosphatidylinositol(4,5)bisphosphate: Diverse functions at the plasma membrane. Essays Biochem. 2020;64:513–531. doi: 10.1042/EBC20200041. - DOI - PMC - PubMed
    1. Li S., Ghosh C., Xing Y., Sun Y. Phosphatidylinositol 4,5-bisphosphate in the Control of Membrane Trafficking. Int. J. Biol. Sci. 2020;16:2761–2774. doi: 10.7150/ijbs.49665. - DOI - PMC - PubMed
    1. Suh B.-C., Hille B. PIP2 Is a Necessary Cofactor for Ion Channel Function: How and Why? Annu. Rev. Biophys. 2008;37:175–195. doi: 10.1146/annurev.biophys.37.032807.125859. - DOI - PMC - PubMed
    1. Feng X., Huang Y., Lu Y., Xiong J., Wong C.-O., Yang P., Xia J., Chen D., Du G., Venkatachalam K., et al. Drosophila TRPML Forms PI(3,5)P2-activated Cation Channels in Both Endolysosomes and Plasma Membrane. J. Biol. Chem. 2014;289:4262–4272. doi: 10.1074/jbc.M113.506501. - DOI - PMC - PubMed

LinkOut - more resources