. 2023 Dec 31;17(1):230.
doi: 10.3390/ma17010230.

Bronze Age Raw Material Hoard from Greater Poland: Archaeometallurgical Study Based on Material Research, Thermodynamic Analysis, and Experiments

Affiliations

Bronze Age Raw Material Hoard from Greater Poland: Archaeometallurgical Study Based on Material Research, Thermodynamic Analysis, and Experiments

Aldona Garbacz-Klempka et al. Materials (Basel). .

Abstract

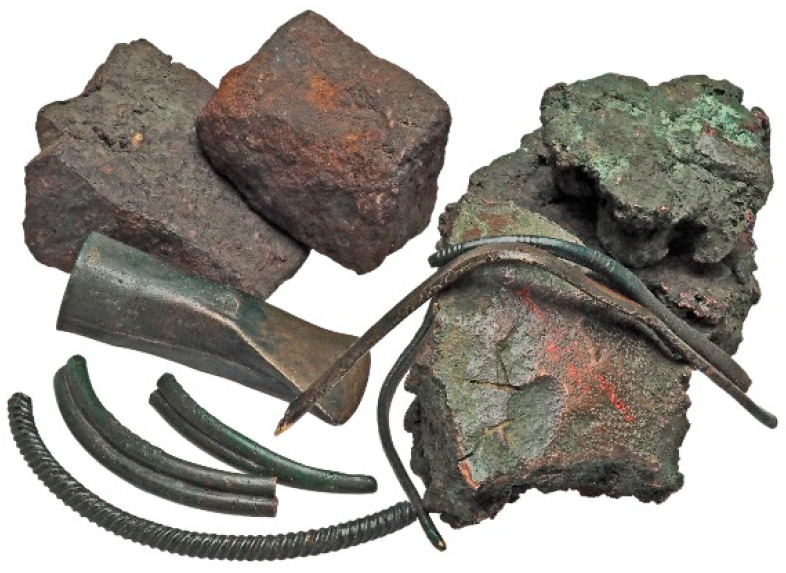
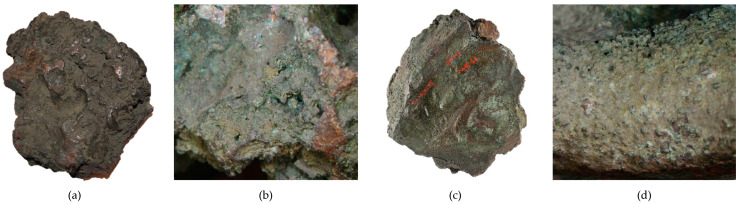
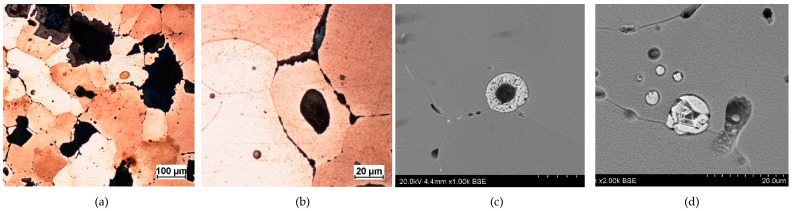
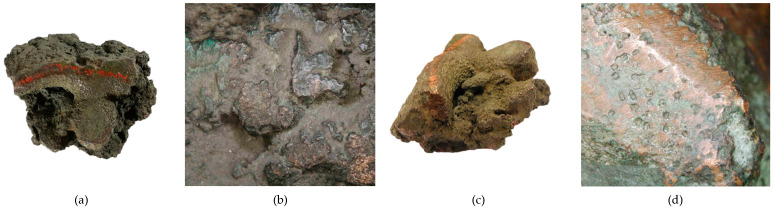
Hoard finds from the Bronze Age have appeared all over Europe, prompting questions about their functions (either as raw materials for recycling or votive objects). The hoard trove of raw materials from Przybysław in Greater Poland is an interesting example of a discovery that is related to the foundry activities of Late Bronze Age and Early Iron Age communities (c. 600 BC). The deposit consists of fragments of raw materials that were damaged end products intended for smelting. The research included the characterisation of the material in terms of the variety of the raw materials that were used. The individual elements of the hoard were characterised in terms of their chemical compositions, microstructures, and properties. A range of modern instrumental research methods were used: metallographic macroscopic and microscopic observations by optical microscopy (OM), scanning electron microscopy (SEM), chemical-composition analysis by X-ray fluorescence spectroscopy (ED-XRF), X-ray microanalysis (EDS), and detailed crystallisation analysis by electron microscopy with an emphasis on electron backscatter diffraction (EBSD). As part of this study, model alloys were also prepared for two of the selected chemical compositions, (i.e., CuPbSn and CuPb). These alloys were analysed for their mechanical and technological properties. This research of the hoard from Przybysław (Jarocin district, Greater Poland) has contributed to the recognition and interpretation of the function and nature of the hoard by using modern research and modelling methods as a cultic raw material deposit.

Keywords: CALPHAD; EBSD; ED-XRF; Late Bronze Age; SEM-EDS; archaeometallurgy; casting; computer modelling; copper; copper alloys; deposits; hoarding; metal hoards; metalwork; recycling.


Conflict of interest statement

The authors declare no conflicts of interest.

Figures

Figure 1
Figure 1
Hoard found in Przybysław including three lumps of raw bronze material, two lumps of iron raw material, six fragments of four necklaces, and a socketed axe.
Figure 2
Figure 2
Macrostructure of the Prz.184i_R1 ingots: top of ingot (a); an apparent volumetric shrinkage effect closer to centre of slab (b); bottom of ingot (c); fragment with visible rim (d).
Figure 3
Figure 3
Microstructure of the Prz.184i.R1 ingot: 100× (a); 500× (b); 1000× (c); 2000× (d).
Figure 4
Figure 4
Macrostructure of the Prz.184i_R2 ingot: top of ingot (ac); an apparent volumetric shrinkage effect (b); bottom of ingot (d).
Figure 5
Figure 5
Microstructure of the Prz.184i.R2 ingot: 100× (a); 500× (b); 1000× (c,d).
Figure 6
Figure 6
Macrostructure of the Prz.184i_R3 ingot: top of ingot (a,b); bottom of ingot (c,d).
Figure 7
Figure 7
Microstructure of the Prz.184i.R3 ingot: 100× (a); 500× (b,c); 1000× (d).
Figure 8
Figure 8
Macrostructure of the Prz.184a axles: general view (a); appearance of the gating system (b); fin (burr) on the parting plane (c), shrinkage depression (d).
Figure 9
Figure 9
Microstructure of the Prz.184a axes: 500× (a); 1000× (b); 1000× (c); 2000× (d).
Figure 10
Figure 10
Macrostructure of the Prz.184b necklace: general view (a); breakthrough (b); ornamentation (c,d).
Figure 11
Figure 11
Microstructure of the Prz.184b necklace: 500× (a); 1000× (b); 2000× (c); 5000× (d).
Figure 12
Figure 12
Macrostructure of the Prz.184c necklace: general view (a); tordering (b,c); breakthrough (d).
Figure 13
Figure 13
Microstructure of the Prz.184c necklace: 9× (a); 500× (b); 1000× (c); 1000× (d).
Figure 14
Figure 14
Macrostructure of the Prz.184d necklace: general view of necklace fragments Prz.184d-f (a); ending of necklace (b); ornamentation (c); traces made with a chisel for the secondary division of necklace (d).
Figure 15
Figure 15
Microstructure of the Prz.184d necklace: 50× (a); 200× (b); 200× (c); 500× (d).
Figure 16
Figure 16
Macrostructure of the Prz.184e necklace: breakthrough (a,b); ornamentation (c,d).
Figure 17
Figure 17
Microstructure of the Prz.184e necklace: 500× (a); 1000× (b); 2000× (c); 2000× (d).
Figure 18
Figure 18
Macrostructure of the Prz.184f necklace: breakthrough (a); ornamentation (bd).
Figure 19
Figure 19
Microstructure of the Prz.184f necklace: 32× (a); 500× (b); 1000× (c); 2000× (d).
Figure 20
Figure 20
Microstructure of the Prz.184i.R2 ingot with the areas of chemical composition analysis in the micro-areas (Table 2).
Figure 21
Figure 21
Microstructure of the Prz.184i.R2 ingot with the areas of chemical composition analysis in micro-areas (Table 3).
Figure 22
Figure 22
Microstructure of the ingot Prz.184i.R2. Map of elemental distribution: area of analysis (a), the presence of Cu (b); the presence of As (c); and the presence of Pb (d). Mag: 2000×.
Figure 23
Figure 23
Microstructure of the Prz.184i.R3 ingot. Map of elemental distribution: area of analysis (a); the presence of Pb (b); the presence of S (c) and the presence of As (d) (mag: 10,000×).
Figure 24
Figure 24
SEM-EDS layered image of the Prz.184i.R3 ingot (mag: 10,000×).
Figure 25
Figure 25
Elemental spectrum of the Prz.184i.R3 ingot and the quantitative elemental content in the micro-area of object (cf. Figure 24).
Figure 26
Figure 26
Phase-distribution map of the Prz.184i.R3 ingot (by EBSD) and phase identification (by PXRD): general view with phase identification (a); enlarged fragment—upper left area (b); enlarged fragment—lower right area (c); identification Cu, Cu2O, AsS, and CuPbAsS3 (d).
Figure 26
Figure 26
Phase-distribution map of the Prz.184i.R3 ingot (by EBSD) and phase identification (by PXRD): general view with phase identification (a); enlarged fragment—upper left area (b); enlarged fragment—lower right area (c); identification Cu, Cu2O, AsS, and CuPbAsS3 (d).
Figure 27
Figure 27
EBSD inverse pole figure (IPF) map of the Prz.184i.R3 copper ingot (a); IPF Z (b).
Figure 28
Figure 28
Copper grain size distribution in the Prz.184i. R3 ingot.
Figure 29
Figure 29
Circumferential size distribution of lead precipitations in the Prz.184i. R3 ingot.
Figure 30
Figure 30
Microstructure of the Prz.184a axe, with the areas of chemical composition analysis in the micro-areas (Table 5).
Figure 31
Figure 31
Microstructure of the Prz.184a axe, with the areas of chemical composition analysis in the micro-areas (Table 6).
Figure 32
Figure 32
Microstructure of the Prz.184b necklace, with the areas of chemical composition analysis in the micro areas (Table 7).
Figure 33
Figure 33
Microstructure of the Prz.184c necklace, with the areas of chemical composition analysis in the micro-areas (Table 8).
Figure 34
Figure 34
Microstructure of the Prz.184c necklace, with the areas of chemical composition analysis in the micro-areas (Table 9).
Figure 35
Figure 35
Microstructure of the Prz.184d necklace, with the areas of chemical composition analysis in the micro-areas (Table 10).
Figure 36
Figure 36
Microstructure of the Prz.184e necklace, with the areas of chemical composition analysis in the micro-areas (Table 11).
Figure 37
Figure 37
Microstructure of the Prz.184e necklace, with the areas of chemical composition analysis in the micro-areas (Table 12).
Figure 38
Figure 38
Curves that were recorded during crystallisation of the tested CuPbSn alloys with Sn, Bi, and As additives.
Figure 39
Figure 39
Phase-transition temperatures according to TDA during the CuSn alloy crystallisation (Prz.184c).
Figure 40
Figure 40
Crystallisation path of the CuPbSn system (Prz.184b) and phase-transition temperatures according to Thermo-Calc.
Figure 41
Figure 41
Crystallisation path of the CuSn system (Prz.184c) and the phase transition temperatures according to Thermo-Calc.
Figure 42
Figure 42
Casting mould, 100x: K1 CuPb (a); K2 CuPbP (b); K3 CuPbSn (c); K4 CuPbSnBi (d).
Figure 43
Figure 43
Sand mould, 100x: P1 CuPb (a); P2 CuPbP (b); P3 CuPbSn (c); P4 CuPbSnBi (d).
Figure 44
Figure 44
Ceramic moulds, 100x: C1 CuPb (a); C2 CuPbP (b); C3 CuPbSn (c); C4 CuPbSnBi (d).

Similar articles

Cited by

References

    1. Dietrich O. Learning from ‘Scrap’ about Late Bronze Age Hoarding Practices: A Biographical Approach to Individual Acts of Dedication in Large Metal Hoards of the Carpathian Basin. Eur. J. Archaeol. 2014;17:468–486. doi: 10.1179/1461957114Y.0000000061. - DOI
    1. Bradley R. Hoards and the Deposition of Metalwork. In: Fokkens H., Harding A., editors. The Oxford Handbook of the European Bronze Age. Oxford Academic; Oxford, UK: 2013. pp. 121–139. - DOI
    1. Fontijn D. Traders «Hoards». In: Quilliec C.H.B., editor. Reviewing the Relationship between Trade and Permanent Deposition: The Case of the Dutch Voorhout hoard, Hoards from the Neolithicto the Metal Ages Technical and Codified Practices. Archaeopress; Oxford, UK: 2008. pp. 5–17. BAR International Series 1758. Publishers of British Archaeological Reports.
    1. Gori M. Circulation, Collection and Alienation of Bronze Artefacts in Late Bronze Age Europe. Gift Giving and the “Embedded” Economy in the Ancient World. Heidelberg Universitätsverlag; Heidelberg, Germany: 2014. Metal Hoards as Ritual Gifts; pp. 269–288.
    1. Nebelsick L. Rent Asunder: Ritual Violence in Late Bronze Age Hoards. In: Christopher F.E.P., editor. Metals Make the World Go Round. The Supply and Circulation of Metals in Bronze Age Europe. Oxbow Book; Oxford, UK: 2000. pp. 160–175.