. 2024 Mar;11(11):e2306373.
doi: 10.1002/advs.202306373. Epub 2024 Jan 10.

Extracellular Vesicular Analysis of Glypican 1 mRNA and Protein for Pancreatic Cancer Diagnosis and Prognosis

Affiliations

Extracellular Vesicular Analysis of Glypican 1 mRNA and Protein for Pancreatic Cancer Diagnosis and Prognosis

Hong Li et al. Adv Sci (Weinh). 2024 Mar.

Abstract

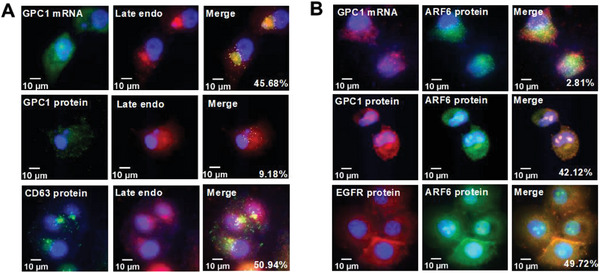
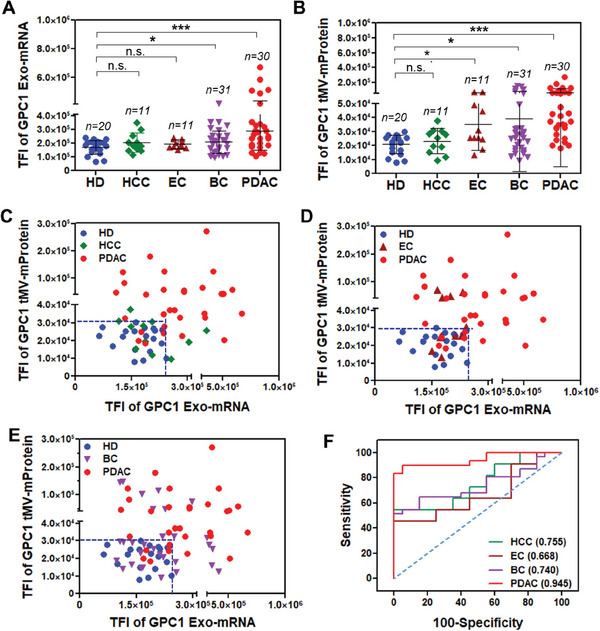
Detecting pancreatic duct adenocarcinoma (PDAC) in its early stages and predicting late-stage patient prognosis undergoing chemotherapy is challenging. This work shows that the activation of specific oncogenes leads to elevated expression of mRNAs and their corresponding proteins in extracellular vesicles (EVs) circulating in blood. Utilizing an immune lipoplex nanoparticle (ILN) biochip assay, these findings demonstrate that glypican 1 (GPC1) mRNA expression in the exosomes-rich (Exo) EV subpopulation and GPC1 membrane protein (mProtein) expression in the microvesicles-rich (MV) EV subpopulation, particularly the tumor associated microvesicles (tMV), served as a viable biomarker for PDAC. A combined analysis effectively discriminated early-stage PDAC patients from benign pancreatic diseases and healthy donors in sizable clinical from multiple hospitals. Furthermore, among late-stage PDAC patients undergoing chemotherapy, lower GPC1 tMV-mProtein and Exo-mRNA expression before treatment correlated significantly with prolonged overall survival. These findings underscore the potential of vesicular GPC1 expression for early PDAC screenings and chemotherapy prognosis.

Keywords: Glypican 1 mRNA in exosomes and protein in tumor-associated microvesicles as a dual biomarker; PDAC screening and chemotherapy prognosis; immune lipoplex nanoparticle biochip assay; single extracellular vesicle analysis.


Conflict of interest statement

L.J.L. is a shareholder at Spot Biosystems Ltd. Other co‐authors declare no competing interests.

Figures

Figure 1
Figure 1
Design of the ILN biochip assay for vesicular GPC1 expression. A) Schematic of the ILN biochip assay. Total Internal Reflection Fluorescence (TIRF) microscopy images were enlarged from 80 µm × 80 µm to 20 µm × 20 µm to show bright spots. B) GPC1 mRNA expression in EVs was verified by two MB designs recognizing different local sequences in GPC1 mRNA. One (2052‐2069, NM_002081.3) showed slightly better discrimination between 10 healthy individuals (Zen‐bio Inc.) and 10 PDAC patient samples (OSU) than the other (1173‐1195, NM_002081.3). C) The performance of MB (2052‐2069, (NM_002081.3) was confirmed by the serial dilution of synthetic standard vesicles with or without a synthetic RNA oligo as a GPC1 mRNA mimic. D) Transmission electron microscopy (TEM) images showed large and small EVs in a PDAC patient serum sorted by size exclusion chromatography (SEC, qEV column, 70 nm), Scale bar, 50 nm. E) NanoSight nanoparticle tracking analysis on EVs from conditioned media of PANC‐1 cells (Blue) or serum of a PDAC patient (Orange) showed two sized groups with mean diameters of 125 and 200 nm, respectively. The EV concentration was ranged in 1E7 particles per mL. F) PANC‐1cell‐derived EVs were captured by different antibodies and vesicular GPC1 mRNA expression was measured by the ILN biochip. Vesicular GPC1 mRNA showed higher expression in the exosome‐dominated EV subpopulation (captured by CD63, CD81, or CD9 antibody). G) Vesicular GPC1 protein showed higher expression in the EV subpopulations captured by PDAC‐associated antibodies (EpCAM/EGFR/GPC1). Calibration curves of EV GPC1 H) mRNA and I) mProtein expression in PANC‐1 cell‐derived EVs spiked into healthy donor serum in comparison with qRT‐PCR and ELISA, respectively. Both limit of detection (LOD) and cut‐off values to distinguish PDAC from control are marked. TFI; Total Fluorescence Intensity. Data were presented as means ± SD (n = 2 wells, each well with 100 images). p values were determined by the two‐way ANOVA test. *p < 0.05.
Figure 2
Figure 2
Distribution of GPC1 mRNA and protein in different EV subpopulations of non‐cancer and PDAC cells and human serum. A) Three sets of antibodies were used for capturing different EV subpopulations, including i) anti‐CD63/CD81/CD9 for exosome‐dominated vesicles (Exo), ii) anti‐ARF6/ANXA1 for microvesicle‐dominated vesicles (MV), and iii) anti‐EGFR/EpCAM/GPC1 for tumor‐associated microvesicle (tMV). B) Cell and vesicular GPC1 protein expression in each subpopulation (Exo, MV, and tMV) was measured by Western blot. Vesicular GPC1 protein is highly expressed in MV and tMV from the PANC‐1 cell line, but low in Exo. Lower GPC1 protein expression in a non‐cancerous cell line (HPDE6c7) and its EVs. C) GPC1 mRNA expression in cell, MV, tMV, and Exo were measured by qRT‐PCR. PANC‐1 and MIA PaCa‐2 cells expressed higher GPC1 mRNA expression in Exo but less in MV and tMV. D) By comparing qRT‐PCR results between two priming methods, random hexamer (Black, fragment) versus oligo dT (Gray, full length), we observed mostly GPC1 mRNA fragments rather than full length in Exo from PANC‐1 and MIA PaCa‐2 cells. Data were presented as means ± SD (n = 3). E) GPC1 mRNA expression in Exo, MV, and tMV in HPDE6c7, PANC‐1, and MIA PaCa‐2 cell‐derived EVs using the ILN biochip assay. F) GPC1 mProtein expression in Exo, MV, and tMV in HPDE6c7, PANC‐1, and MIA PaCa‐2 cell‐derived EVs using the ILN biochip assay. TIRF microscopy images were enlarged from 80 µm × 80 µm to 20 µm × 20 µm to show bright spots. RFI: Relative Fluorescence Intensity. G) GPC1 mRNA and H) GPC1 mProtein expression in Exo, MV, and tMV in HD and PDAC patient samples (n = 5). Data were presented as means (n = 2 wells, each well with 100 images). p values were determined by the paired two‐tailed Student's t‐test. *p < 0.05, **p < 0.01, n.s., not significant.
Figure 3
Figure 3
GPC1 mRNA and protein co‐localization with exosome and microvesicle markers. A) Co‐localization images of GPC1 mRNA, GPC1 protein, and CD63 protein with late endosome (endo)/ILV marker Rab7 in PANC‐1 cells. B) Co‐localization images of GPC1 mRNA, GPC1 protein, and EGFR protein with MV marker ARF6 in PANC‐1 cells.
Figure 4
Figure 4
The ILN biochip assay of GPC1 Exo‐mRNA and tMV‐mProtein expression for discovery, non‐blinded validation, and blinded validation studies. A,B) Representative TIRF images for GPC1 Exo‐mRNA and tMV‐mProtein expression. C) GPC1 Exo‐mRNA expression for discovery and non‐blinded validation studies. D) GPC1 tMV‐mProtein expression for discovery and non‐blinded validation studies. TIRF images were enlarged from 80 µm × 80 µm to 20 µm × 20 µm to show bright spots. E) Scatter plot for discovery samples from OSU. F) ROC curves of GPC1 Exo‐mRNA and tMV‐mProtein expression as a single‐ or dual‐marker for Stage I/II PDAC patient for discovery set compared to control. G) Scatter plot for non‐blinded validation samples from combined MSKCC and TVGH. H) ROC curves of dual GPC1 Exo‐mRNA and tMV‐mProtein expression for Stage I/II and Stage III/IV PDAC patients for non‐blinded validation set compared to control. I,J) GPC1 Exo‐mRNA and tMV‐mProtein expression for blinded validation samples. K) Scatter plot for blinded validation samples. L) Predicted ROC curves for dual‐GPC1 expression for blinded validation samples. Pairwise comparison p values were determined by the Mann–Whitney U test. *p < 0.05, ***p < 0.001, n.s., not significant. Dotted lines in (E, G, and K) indicate the cut‐off values from the control (green). All data were presented as means (n = 2 wells, each well with 100 images).
Figure 5
Figure 5
Blood CA19‐9 levels and GPC1 Exo‐mRNA/tMV‐mProtein expression as single‐, dual‐ or triple‐biomarkers for PDAC patients with Stage I/II and Stage III/IV. A) CA19‐9 levels in patients with Stage I/II and III/IV. B,C) ROC curves for PDAC patients with Stage I/II and III/IV compared to the control. D) Scatter plot of GPC1 Exo‐mRNA and tMV‐mProtein expression for patients with Stage I/II and III/IV. E) 3D scatter plot of CA19‐9, GPC1 Exo‐mRNA, and GPC1 tMV‐mProtein for PDAC patients with Stage I/II and III/IV. F) Statistical analysis of ROC curves of CA19‐9 and GPC1 Exo‐mRNA/tMV‐mProtein as single‐, dual‐ or triple biomarkers. Pairwise comparison p values were determined by the Mann–Whitney U test. ***p < 0.001. All data were presented as means (n = 2 wells, each well with 100 images).
Figure 6
Figure 6
GPC1 Exo‐mRNA/tMV‐mProtein expression for PDAC and non‐PDAC cancer patient samples. GPC1 A) Exo‐mRNA and B) tMV‐mProtein expression in patients with HCC, EC, BC, and PDAC. Scatter plot of GPC1 Exo‐mRNA and tMV‐mProtein expression in patients with C) HCC, D) EC, and E) BC. F) ROC curves of GPC1 Exo‐mRNA/tMV‐mProtein expression for PDAC, BC, HCC, and EC patients versus HD. HCC: hepatocellular carcinoma; EC: esophageal cancer; BC: breast cancer; Pairwise comparison p values were determined by the Mann–Whitney U test. *p < 0.05, **p < 0.01, ***p < 0.001, n.s. not significant. All data were presented as means (n = 2 wells, each well with 100 images).
Figure 7
Figure 7
GPC1 expression and IC50 of Gemcitabine in pancreatic cancer cells and non‐cancer pancreatic cells. A) GPC1 protein expression in HPDE6c7, MIA PaCa‐2, and PANC‐1 cells by flow cytometry. B) Cell viability after 48 h treatment of Gemcitabine in HPDE6c7, MIA PaCa‐2 and PANC‐1 cells by MTS assay. C) Relative GPC1 Exo‐mRNA, tMV‐mProtein, and cell‐mProtein expression with IC50 of Gemcitabine in HPDE6c7, MIA PaCa‐2, and PANC‐1 cells and their EVs. Data were presented as means ± SD (n = 3).
Figure 8
Figure 8
GPC1 Exo‐mRNA and tMV‐mProtein dual‐biomarker for pancreatic cancer prognosis in chemotherapy. A) GPC1 Exo‐mRNA and GPC1 tMV‐mProtein expression of mostly late‐stage PDAC patients from CGMH, TVGH, and NCKUH before chemotherapy (C0) with <12 months or ≥12 months overall survival (OS). B) Scatter plot of GPC1 Exo‐mRNA versus GPC1 tMV‐mProtein expression at C0. C) AUC/ROC of dual‐GPC1 and CA19‐9 with OS ≥12 months compared to OS <12 months. D) Kaplan‐Meier curves (log‐rank test) of OS based on cut‐off values of GPC1 Exo‐mRNA and tMV‐mProtein expression at C0. Cut‐off value for GPC1 Exo‐mRNA (TFI = 331,725 or 7E7 PANC‐1 EVs per mL HD serum) and mProtein (TFI = 51,480 or 6E8 PANC‐1 EVs per mL HD serum) were determined using AUC/ROC and calibration curves. Pairwise comparison P values were determined by the Mann–Whitney U test. *p < 0.05, **p < 0.01, ***p < 0.001, ****p < 0.0001, n.s. not significant. All data were presented as means (n = 2 wells, each well with 100 images).
Figure 9
Figure 9
Dual GPC1 Exo‐mRNA and tMV‐mProtein biomarker for PDAC screening and prediction of prognostic outcome. Graphical summary showing that a combination of GPC1 mRNA expression in Exos and the GPC1 membrane protein expression in tMVs can serve as a viable biomarker for PDAC detection. The control group (HD and BPD) exhibited low GPC1 Exo‐mRNA expression (TFI ≤ 3.2E5 equivalent to 6.5E7 PANC‐1 EVs in 1 mL blood) and tMV‐mProtein expression (TFI ≤ 3.2E4 equivalent to 2.0E8 PANC‐1 EVs in 1 mL blood). PDAC patients with moderate GPC1 Exo‐mRNA expression (2.4E5 < TFI < 3.2E5 equivalent to ≈1.6E7–7.0E7 PANC‐1 EVs in 1 mL blood) and tMV‐mProtein expression (3.0E4 < TFI < 5.1E4 equivalent to ≈1.6E8–6.0E8 PANC‐1 EVs in 1 mL blood) were associated with longer OS. PDAC patients with high GPC1 Exo‐mRNA and tMV‐mProtein expression showed poor outcomes undergoing chemotherapy.

References

    1. Balasenthil S., Huang Y., Liu S., Marsh T., Chen J., Stass S. A., Kukuruga D., Brand R., Chen N., Frazier M. L., Jack Lee J., Srivastava S., Sen S., Mcneill Killary A., J. Natl. Cancer Inst. 2017, 109, djw341. - PMC - PubMed
    1. Siegel R. L., Miller K. D., Fuchs H. E., Jemal A., Jemal A., Ca‐Cancer J. Clin. 2022, 72, 7. - PubMed
    1. Shah S. C., Kayamba V., Peek R. M. Jr., Heimburger D. C., J. Global. Oncol. 2019, 5, 1. - PMC - PubMed
    1. Poruk K. E., Gay D. Z., Brown K., Mulvihill J. D., Boucher K. M., Scaife C. L., Firpo M. A., Mulvihill S. J., Curr. Mol. Med. 2013, 13, 340. - PMC - PubMed
    1. Hamada E., Taniguchi T., Baba S., Maekawa M., Maekawa M., Ann. Clin. Biochem. 2012, 49, 266. - PubMed

MeSH terms

LinkOut - more resources