. 2024 Mar;11(11):e2307245.
doi: 10.1002/advs.202307245. Epub 2024 Jan 10.

De Novo Generation and Identification of Novel Compounds with Drug Efficacy Based on Machine Learning

Affiliations

De Novo Generation and Identification of Novel Compounds with Drug Efficacy Based on Machine Learning

Dakuo He et al. Adv Sci (Weinh). 2024 Mar.

Abstract

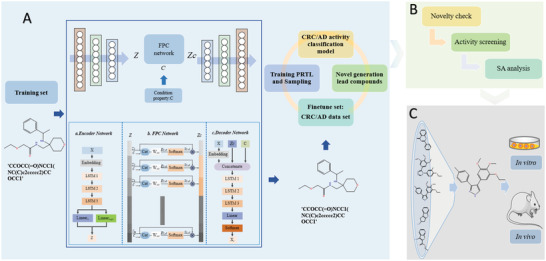
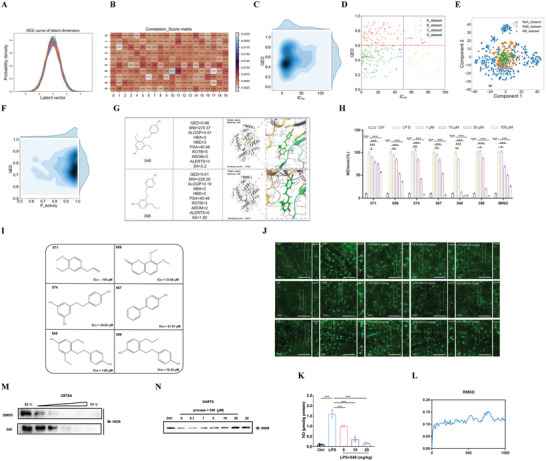
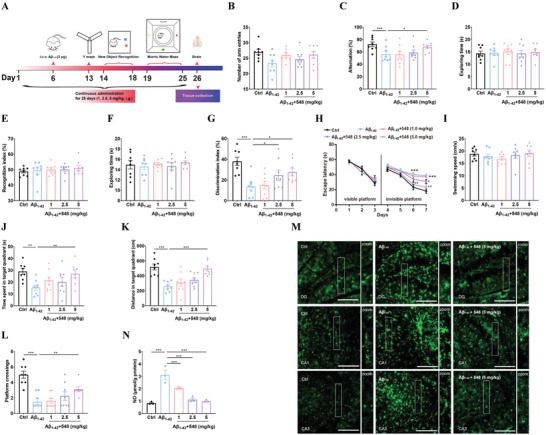
One of the main challenges in small molecule drug discovery is finding novel chemical compounds with desirable activity. Traditional drug development typically begins with target selection, but the correlation between targets and disease remains to be further investigated, and drugs designed based on targets may not always have the desired drug efficacy. The emergence of machine learning provides a powerful tool to overcome the challenge. Herein, a machine learning-based strategy is developed for de novo generation of novel compounds with drug efficacy termed DTLS (Deep Transfer Learning-based Strategy) by using dataset of disease-direct-related activity as input. DTLS is applied in two kinds of disease: colorectal cancer (CRC) and Alzheimer's disease (AD). In each case, novel compound is discovered and identified in in vitro and in vivo disease models. Their mechanism of actionis further explored. The experimental results reveal that DTLS can not only realize the generation and identification of novel compounds with drug efficacy but also has the advantage of identifying compounds by focusing on protein targets to facilitate the mechanism study. This work highlights the significant impact of machine learning on the design of novel compounds with drug efficacy, which provides a powerful new approach to drug discovery.

Keywords: de novo design; drug efficacy; lead compound; machine learning.


Conflict of interest statement

The authors declare no conflict of interest.

Figures

Figure 1
Figure 1
The architecture of de novo design of novel structured lead compounds based on machine learning. A) DTLS contain VAE_FPC and PRTL network. VAE_FPC network was trained using a preprocessed dataset to generate chemically valid and drug‐like molecules. PRTL was proposed to generate novel structured lead compounds for specific targets. B) Novelty screening was performed using the SciFinder database. The SA score was used to evaluate the synthetic feasibility of the molecules. We selected the molecules with the lowest SA score from Top 10 and Top 11–20, respectively. Retrosynthetic analysis and route of synthesis were performed. C) An in vitro cell model was used to determine the empirical IC50 values of the novel compounds and several known compounds were tested for comparison. Based on the characteristics of the specific disease, an in vivo animal model was established to confirm the efficacy of the lead compounds.
Figure 2
Figure 2
Model training using the anti‐CRC drug efficacy dataset and identification of compound 1901. A) KDE of each dimensional distribution for latent vectors for CRC molecule generation model, which was encoded by Encoder network. B) The correlation score matrix of QED property with latent vectors for CRC molecule generation model, which was obtained by FPC network, the depth of color in which indicates how important that feature is, the darker the color, the stronger the correlation. C) The joint KDE distribution of pIC50 and QED property for CRC dataset, the pIC50 value and QED value ranges in (5, 10.7) and (0.03, 0.93), respectively. D) The scatter distribution of CRC target domain, QED = 0.6 and pIC50 = 6 was used to divide the whole CRC target domain into four sub target domains (Adataset, Bdataset, Cdataset, Ddataset), the relationship of which can be described Methods. E) T‐SNE with ECFP4 descriptor of generate novel structured lead compounds, the resulting molecules by PRTL method form a chemical space that expands around the CRC target domain. F) The joint KDE of predicted pIC50 value and QED value for generate lead compounds, QED ranges in (0.60, 0.95) and predicted pIC50 value ranges in (5.05, 9.60). G) The physiochemical properties of compound 1901 and compound 2238. H–L) HT29 cells were co‐incubated with five compounds 1901 (H), 2238 (I), 600 (J), 3141 (K) and 2524 (L) at the indicated concentrations for 48 h or 72 h. Effect of five compounds on HT29 cell viability were measured by MTT assay and IC50 was calculated. N = 3 independent cell batches. One‐way ANOVA followed by Bonferroni's post hoc test for statistical analyses. M) Practical measured values of IC50 compared with predicted values of IC50 were shown. For (H–L), ** P <0.01, *** P <0.001 compared with the indicated group.
Figure 3
Figure 3
In vivo efficacy investigation of compound 1901 against CRC. A) Experiment design for anti‐CRC efficacy exploration of compound 1901. B) The effect of compound 1901 on tumorigenesis were analyzed. Tumor size were monitored during the administration of compound 1901. Pictures of tumor were shown. C) Representative pictures of HE staining for tumor tissue were shown. D–F) Tumor weight, tumor burden and tumor inhibition rate were calculated. G) The body weight of HT29 bearing nude mice were monitored during the administration of compound 1901. H,I) spleen weight and spleen index were calculated for immune organ analysis. J,K) ALT and AST were measured using commercial kits for liver function analysis. N = 5 different animals. One‐way ANOVA followed by Bonferroni's post hoc test for statistical analyses. For (B,D–F), * P < 0.05, ** P < 0.01, *** P < 0.001 compared with the indicated group.
Figure 4
Figure 4
Insights into the mechanisms of compound 1901 on CRC. A) The effect of compound 1901 on cell viability was measured combined with ferroptosis inhibitor Fer‐1 (10 µm, 72 h). N = 3 independent cell batches. B–E) The effects of 1901 on ferroptosis in tumor tissue were analyzed. N = 3 different animals. F–K) The effects of compound 1901 on ferroptosis in HT29 cells were analyzed. N = 3 independent cell batches. GSH content, free iron level and MDA level were measured using commercial kits. GPX4 protein were measured by western blot. Lipid ROS was measured using BODIPY 581/591 C11 staining. ROS level was tested using dihydroethidium staining. L–N) The effect of compound 1901 on ROS, lipid ROS and MDA levels were analysis combined with ferroptosis inhibitor Fer‐1 (10 µm, 72 h). N = 3 independent cell batches. O) Compound 1901 promoted resistance of GSS to different temperature gradients by CETSA and compound 1901 promoted resistance of GSS to proteases by DARTS. N = 3 independent cell batches. One‐way ANOVA followed by Bonferroni's post hoc test for statistical analyses for (B–K), Two‐way ANOVA followed by Bonferroni's post hoc test for statistical analyses for (A,L–N). * P < 0.05, ** P < 0.01, *** P < 0.001 compared with the indicated group.
Figure 5
Figure 5
Model training using the anti‐AD drug efficacy dataset and identification of compound 548. A) KDE of each dimensional distribution for latent vectors for AD molecule generation model, which was encoded by Encoder network. B) The correlation score matrix of QED property with latent vectors for AD molecule generation model, which was obtained by FPC network, the depth of color in which indicates how important that feature is, the darker the color, the stronger the correlation. C) The joint KDE distribution of IC50 and QED property for AD dataset, the IC50 value and QED value ranges in (4, 7) and (0.13, 0.91), respectively. D) The scatter distribution of AD target domain, QED = 0.6 and IC50 = 50 was used to divide the whole AD target domain into four sub target domains. E) T‐SNE with ECFP4 descriptor of generate novel structured lead compounds for AD, the resulting molecules by PRTL method form a chemical space that expands around the AD target domain. F) The joint KDE distribution of predicted activity probability value and QED value for generate molecules, QED ranges in (0.60, 0.94) and the activity probability values were all higher than 0.58. G) Physiochemical properties and docking scores between compound 548 and iNOS, and compound 398 and iNOS. H) BV‐2 cells were co‐incubated with six compounds at the indicated concentrations for 24 h. Effect of six compounds (548, 398, 571, 698, 574 and 467) on NO release were measured by nitrite assay. N = 3 independent cell batches. One‐way ANOVA followed by Bonferroni's post hoc test for statistical analyses. I) chemical structure of the compounds and calculated IC50. J,K) LPS induced mice model was established. Iba‐1 positive cells by immunofluorescence in CA1, CA3 and DG of brain tissue were shown (J). NO content by nitrite assay in brain tissue was measured after different dose of 548 (5, 10, 20 mg kg−1) treatment (K). N = 3 different animals. One‐way ANOVA followed by Bonferroni's post hoc test for statistical analyses for (K). L) RMSD curve of compound 548 and iNOS. M) Compound 548 promoted resistance of iNOS to proteases by DARTS and compound 548 promoted resistance of iNOS to different temperature gradients by CETSA. N = 3 independent cell batches. For (H) and (K), * P < 0.05, ** P < 0.01, *** P < 0.001 compared with the indicated group.
Figure 6
Figure 6
Efficacy investigation of compound 548 against AD. A) Aβ1‐42‐induced AD model was established and the experiment schedule of behavioral assessment. B,C) Y‐maze test was used to measure working memory impairment of Aβ1‐42‐treated mice. Number of arm entries (B) and Alternation (C) were measured. N = 8 different animals. D–G) novel object recognition task was used to measure visual recognition ability of Aβ1‐42‐treated mice. Exploring time (D) and Recognition index (E) in the acquisition stage, Exploring time (F) and Discrimination index (G) in the test stage were measures. N = 8 different animals. H–L) Morris water maze test was used to measure spatial learning and memory impairment of Aβ1‐42‐treated mice. Escape latency (H), Swimming speed (I), Time spent in target quadrant (J), Distance spent in target quadrant (K) and Platform crossings (L) were measures. N = 8 different animals. M) Iba‐1 positive cells by immunofluorescence in CA1, CA3 and DG of brain tissue were shown. N) NO content by nitrite assay in brain tissue was measured after compound 548 treatment. N = 3 different animals. One‐way ANOVA followed by Bonferroni's post hoc test for statistical analyses. * P < 0.05, ** P < 0.01, *** P < 0.001 compared with the indicated group.

Similar articles

Cited by

References

    1. Chan H. C. S., Shan H., Dahoun T., Vogel H., Yuan S., Trends Pharmacol. Sci. 2019, 40, 592. - PubMed
    1. Yang X., Wang Y., Byrne R., Schneider G., Yang S., Chem. Rev. 2019, 19, 10520. - PubMed
    1. Vamathevan J., Clark D., Czodrowski P., Dunham I., Ferran E., Lee G., Li B., Madabhushi A., Shah P., Spitzer M., Zhao S., Nat. Rev. Drug Discovery 2019, 18, 463. - PMC - PubMed
    1. Issa N. T., Stathias V., Schürer S., Dakshanamurthy S., Semin. Cancer Biol. 2021, 68, 132. - PMC - PubMed
    1. Bannigan P., Aldeghi M., Bao Z., Häse F., Aspuru‐Guzik A., Allen C., Adv. Drug Delivery Rev. 2021, 175, 113806. - PubMed

LinkOut - more resources