. 2024 Apr;121(4):742-766.
doi: 10.1111/mmi.15225. Epub 2024 Jan 11.

TbsP and TrmB jointly regulate gapII to influence cell development phenotypes in the archaeon Haloferax volcanii

Affiliations

TbsP and TrmB jointly regulate gapII to influence cell development phenotypes in the archaeon Haloferax volcanii

Rylee K Hackley et al. Mol Microbiol. 2024 Apr.

Abstract

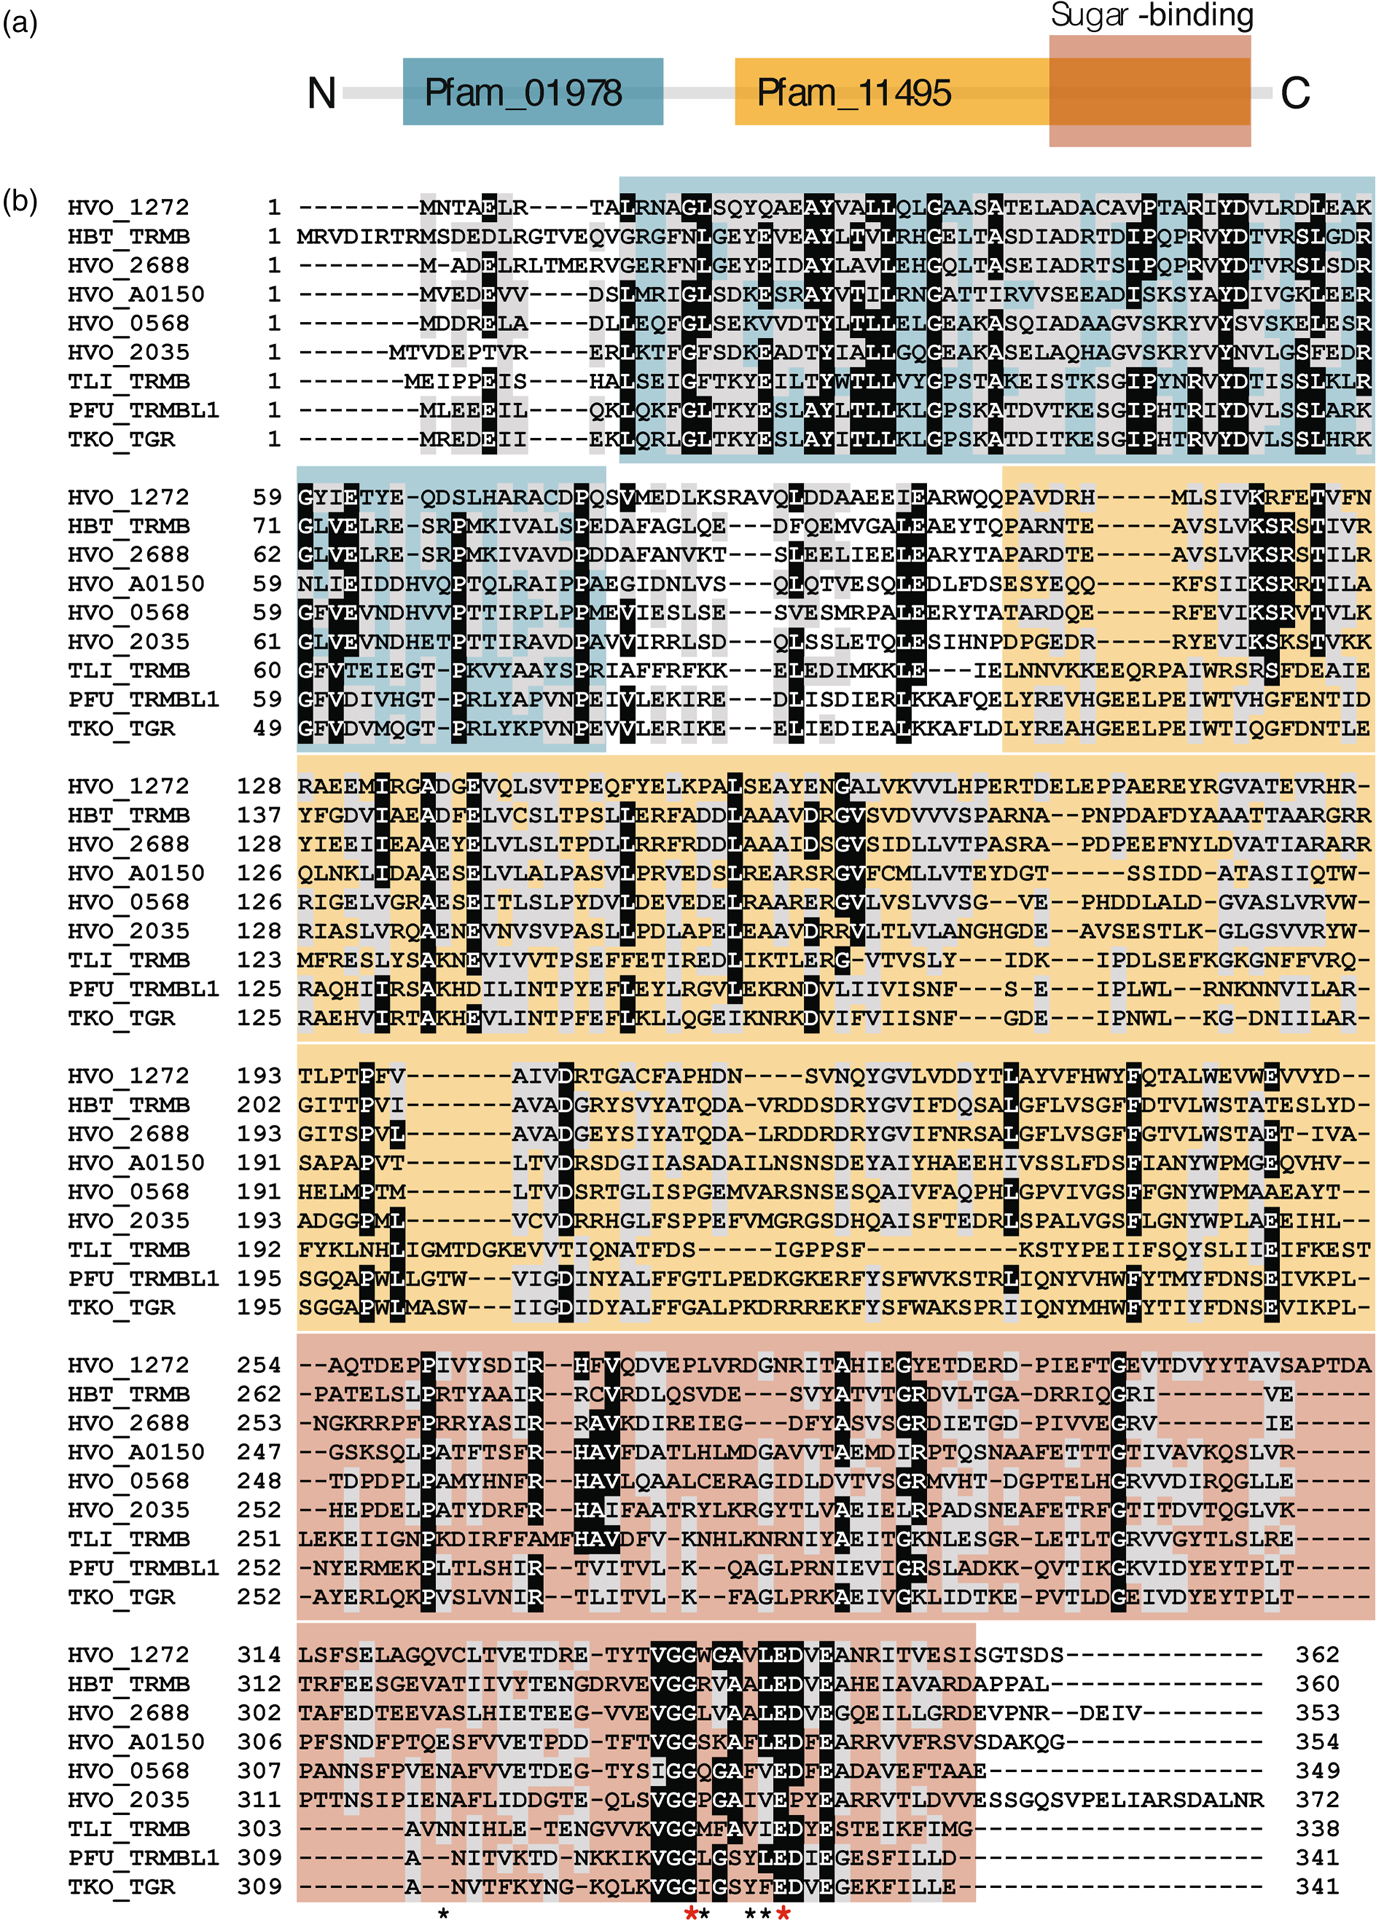
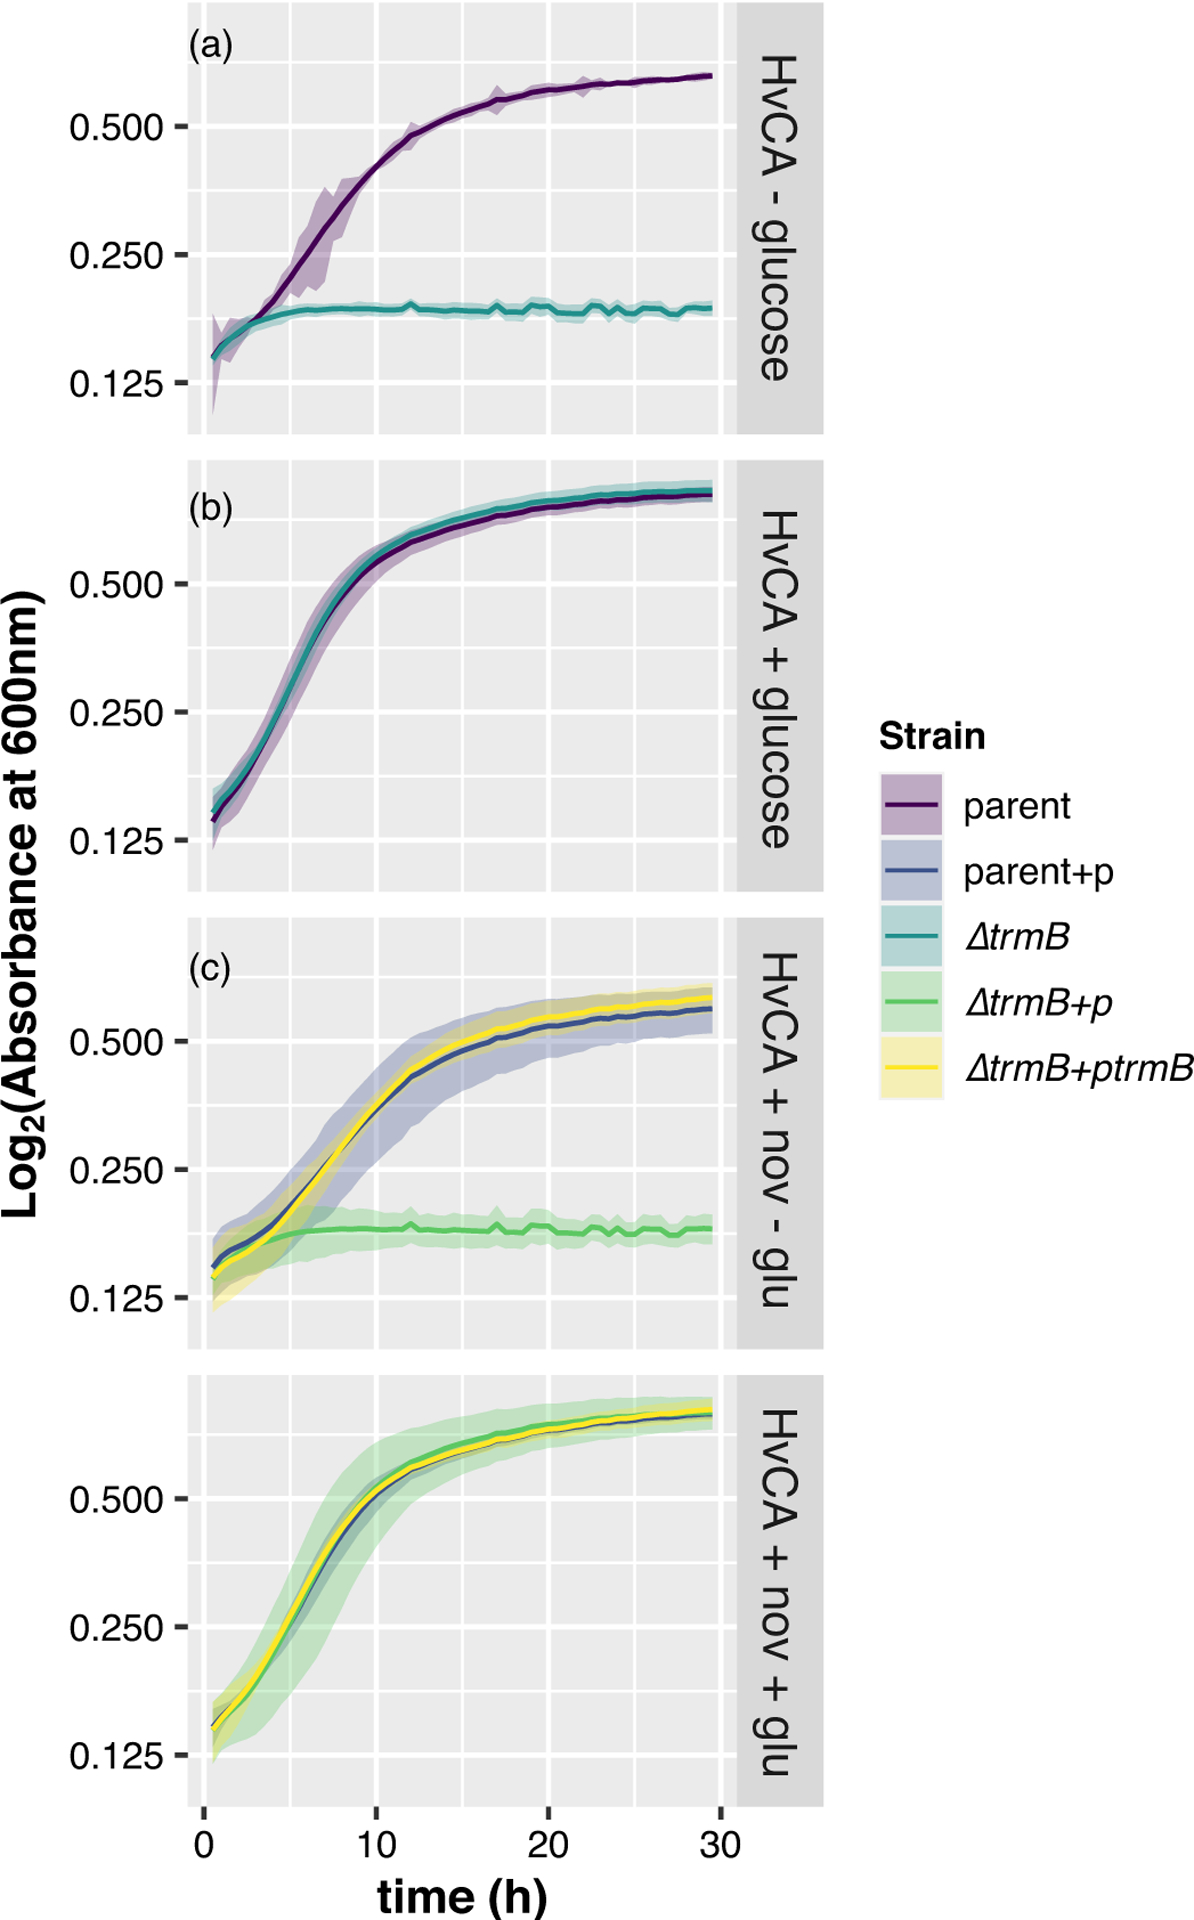
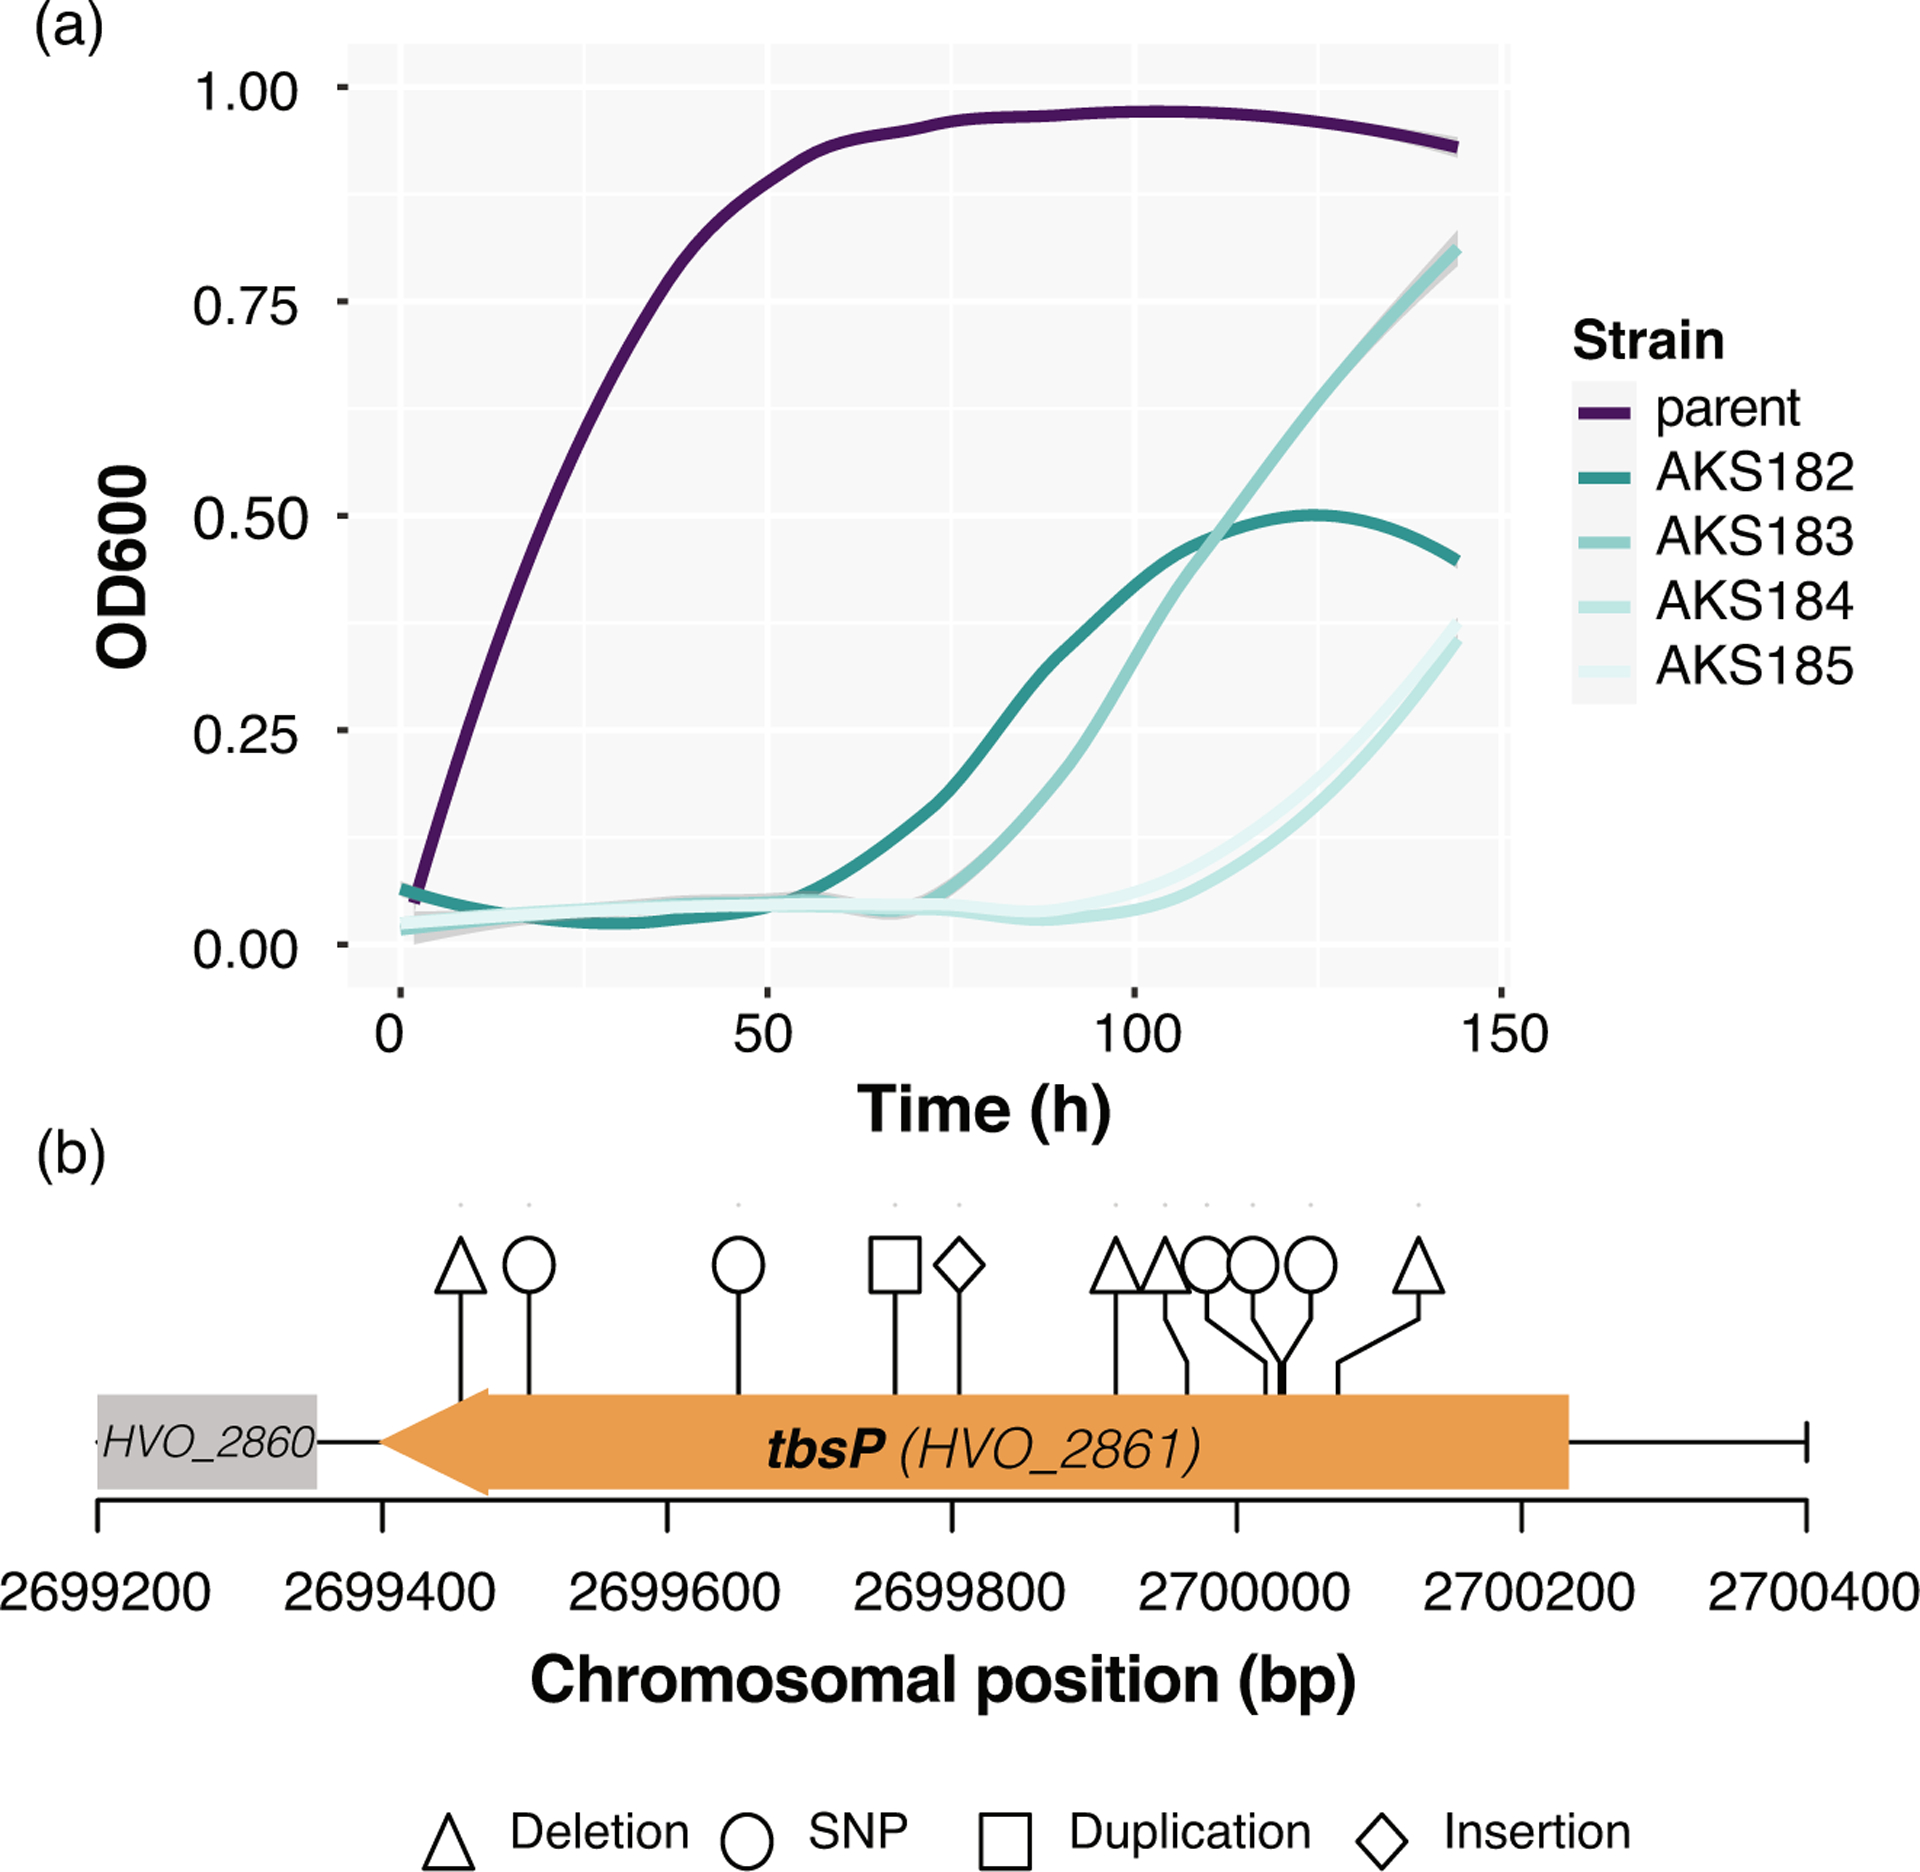
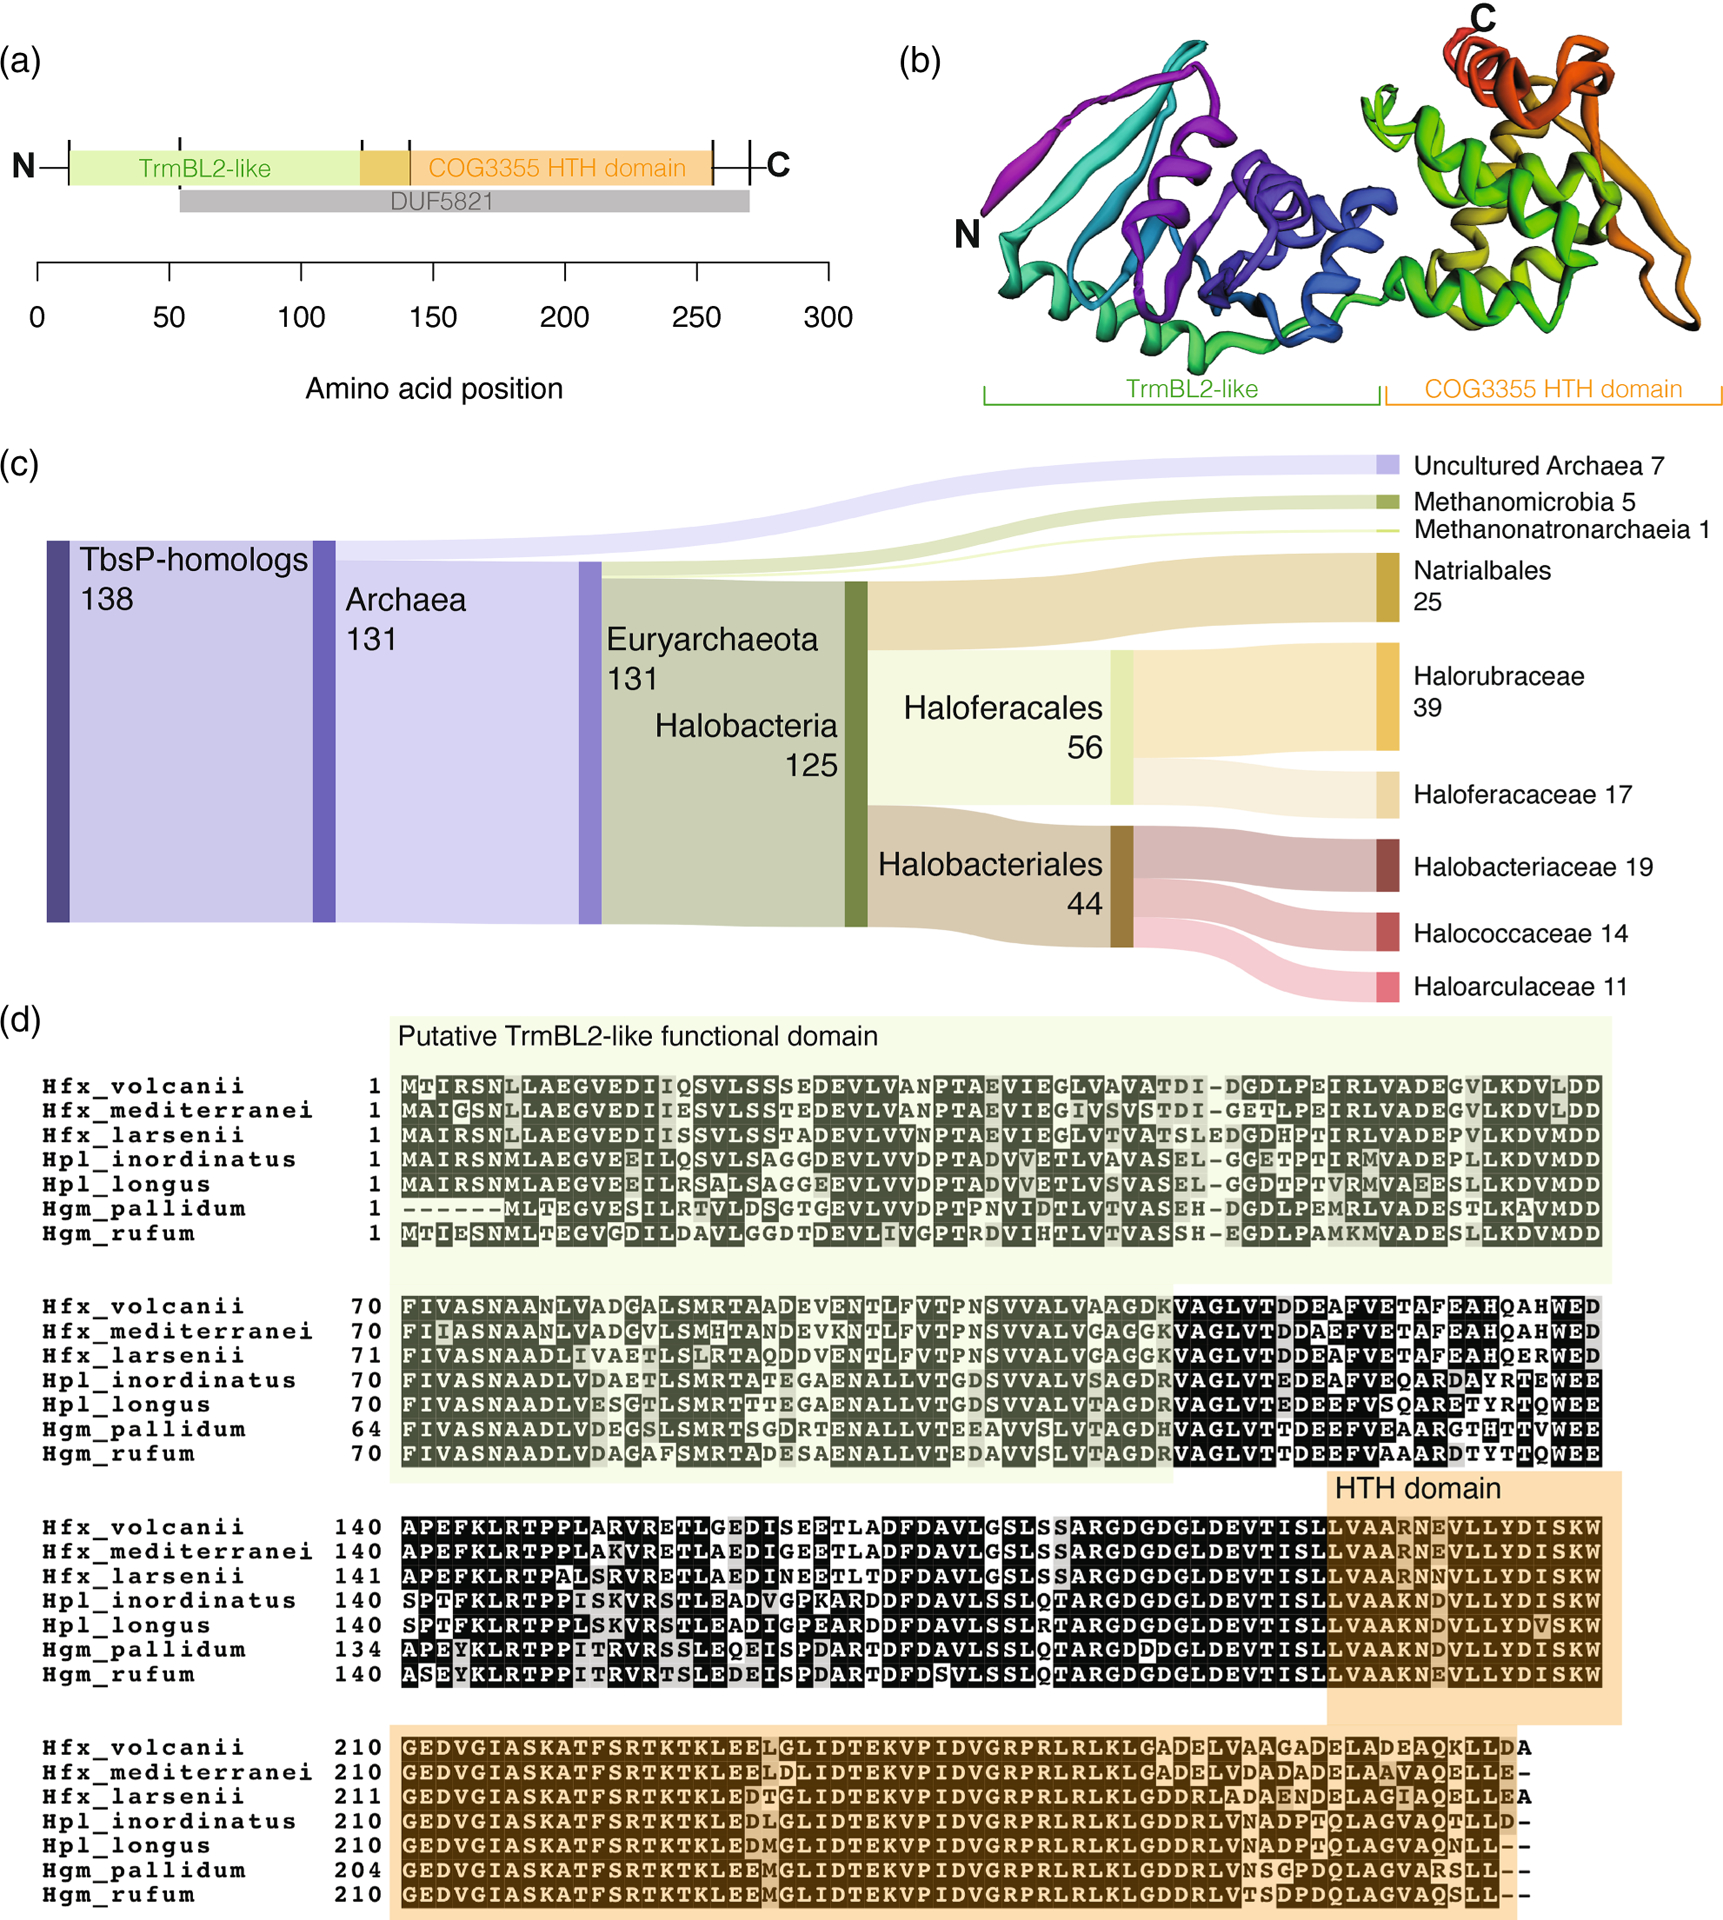
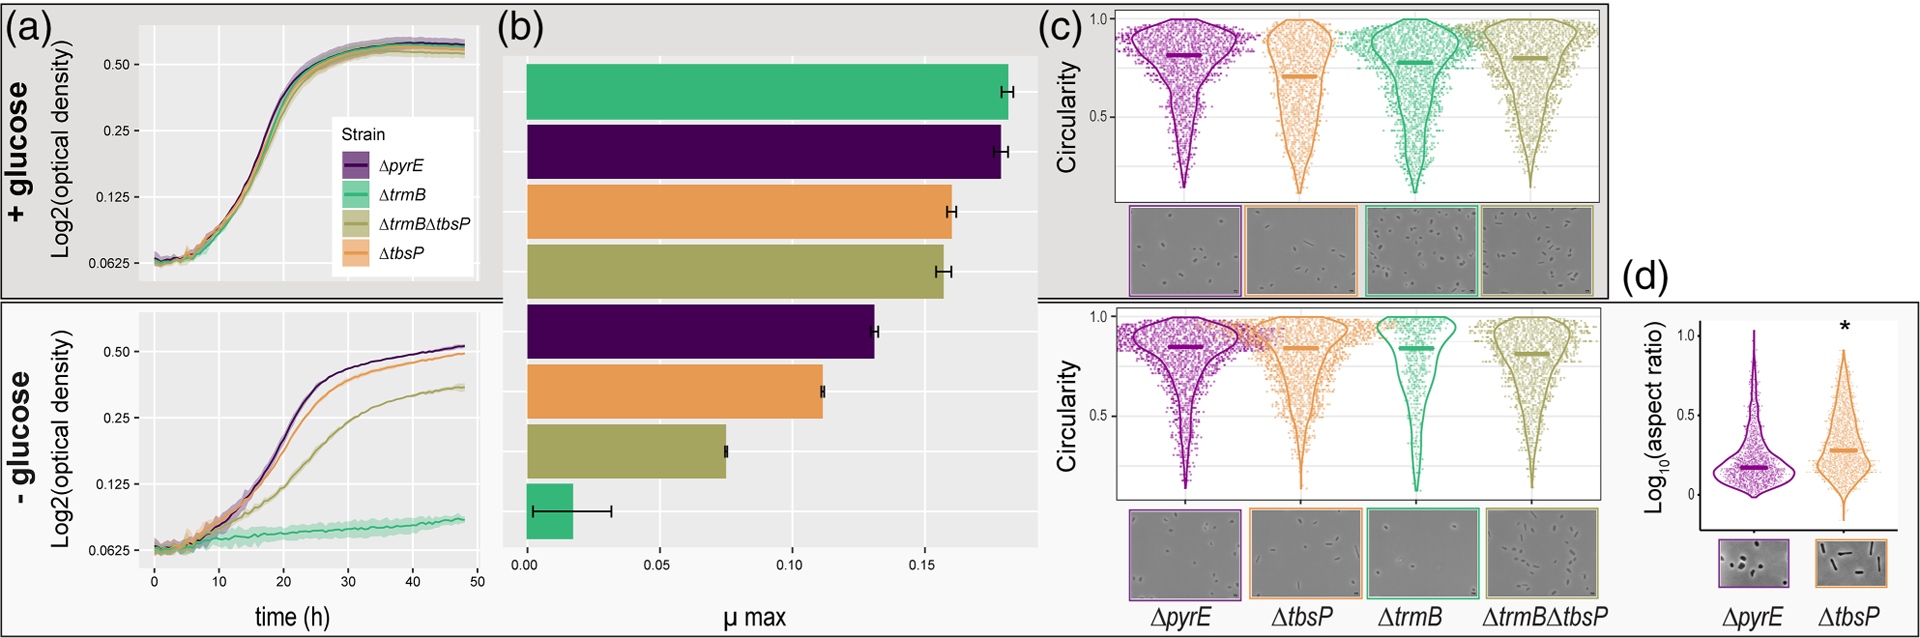
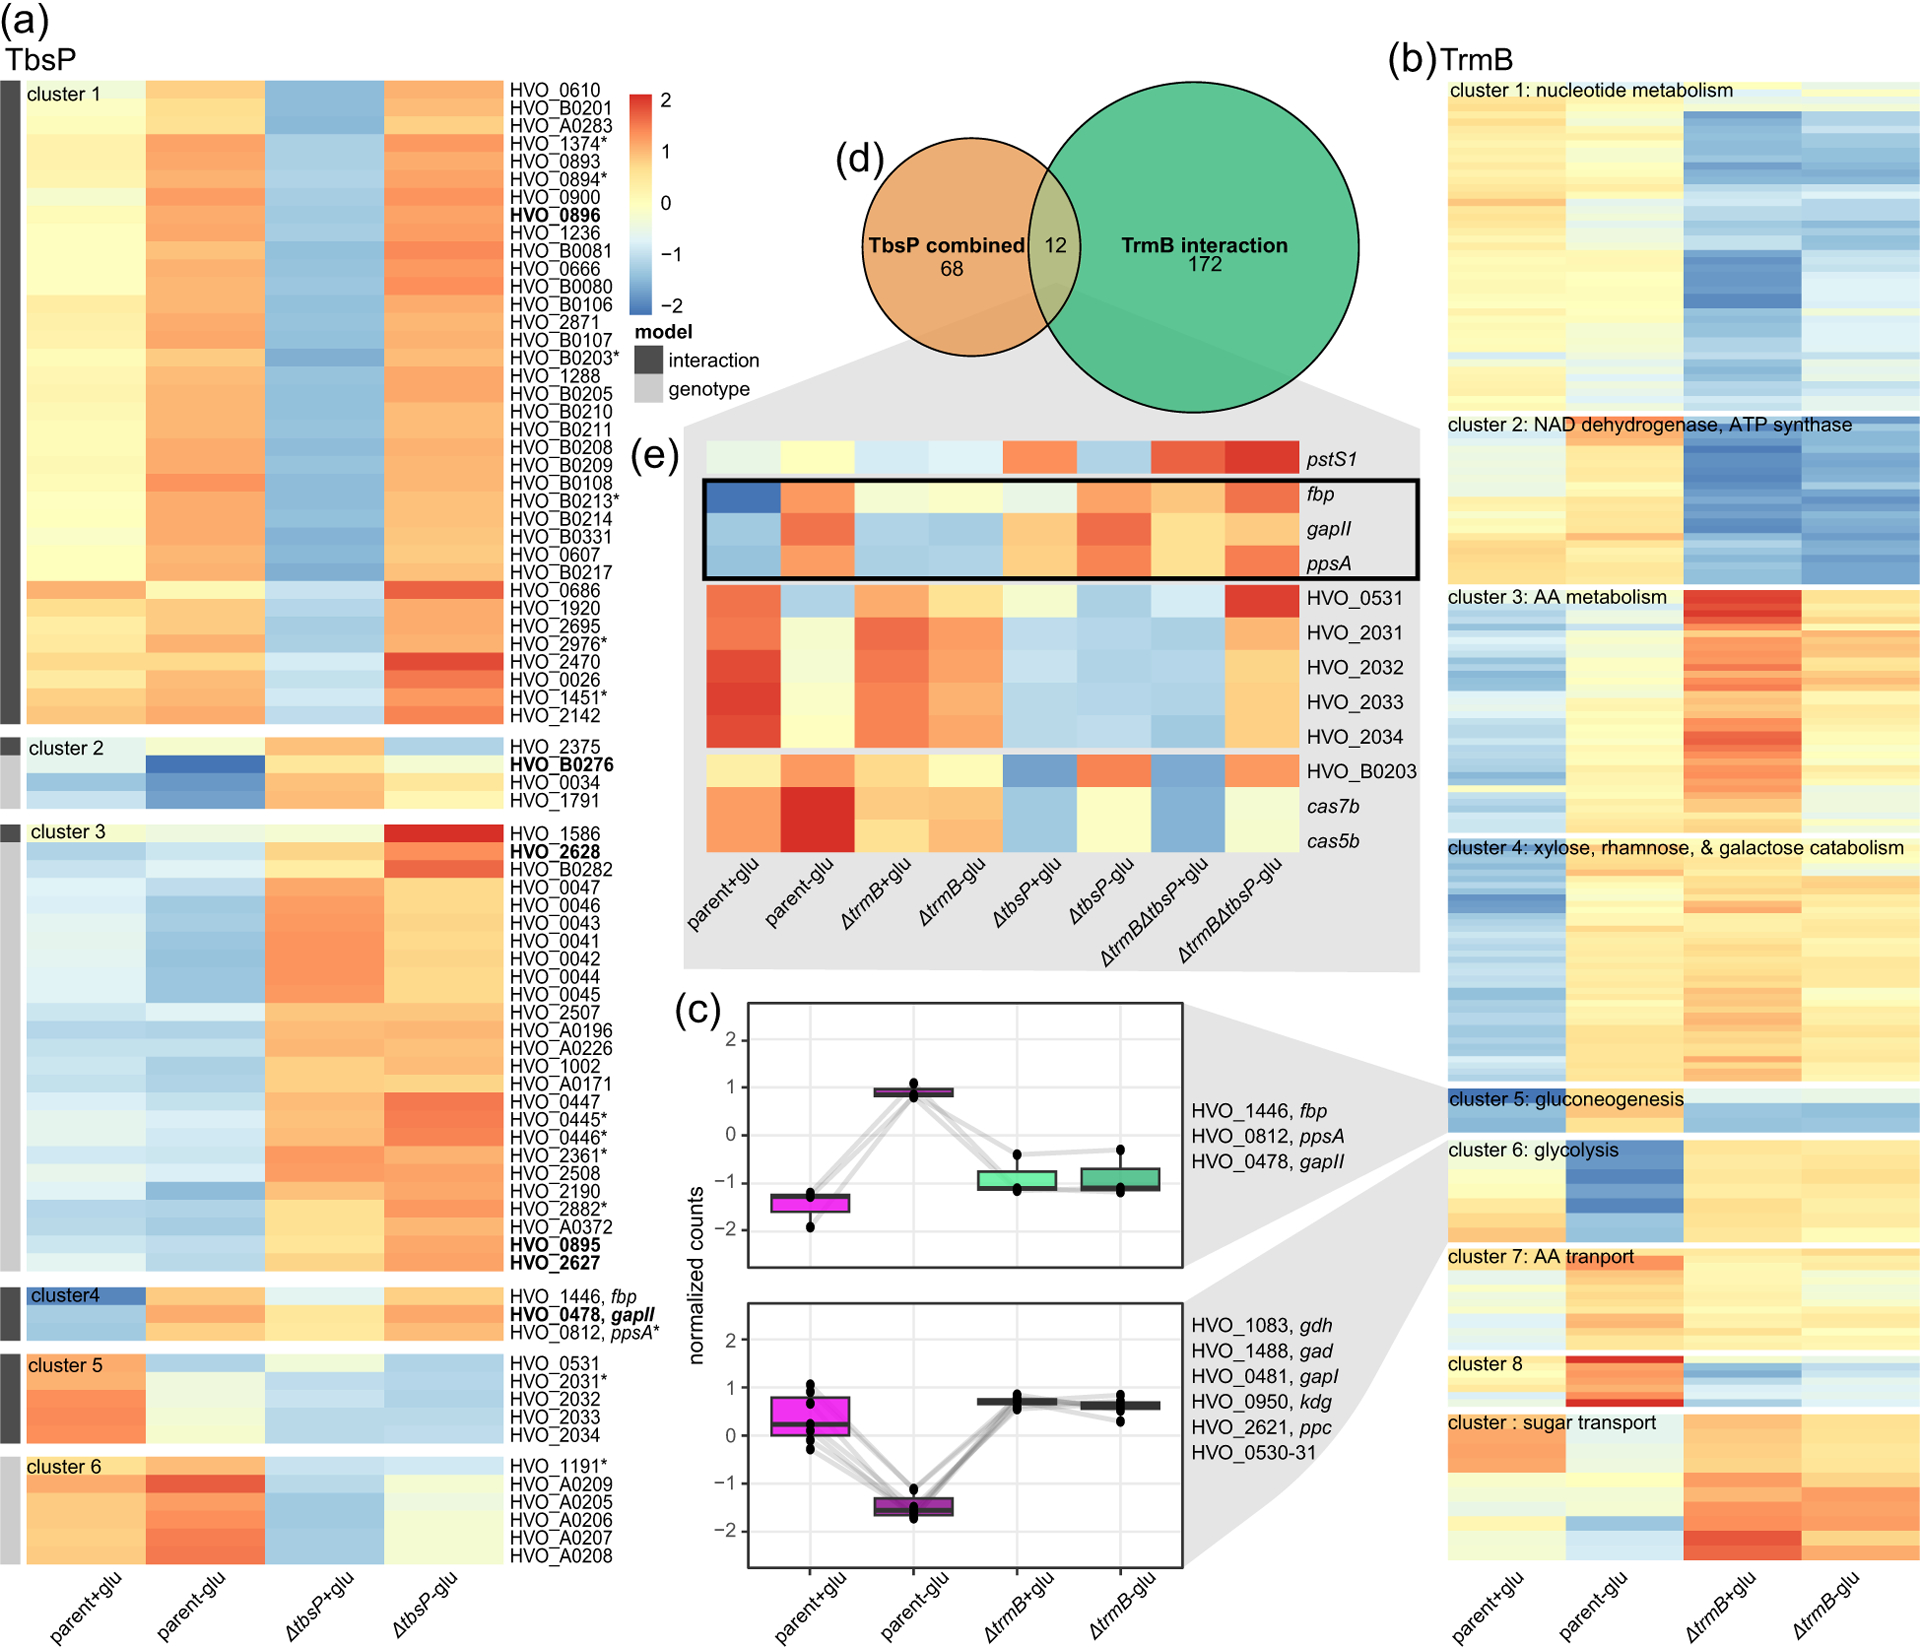
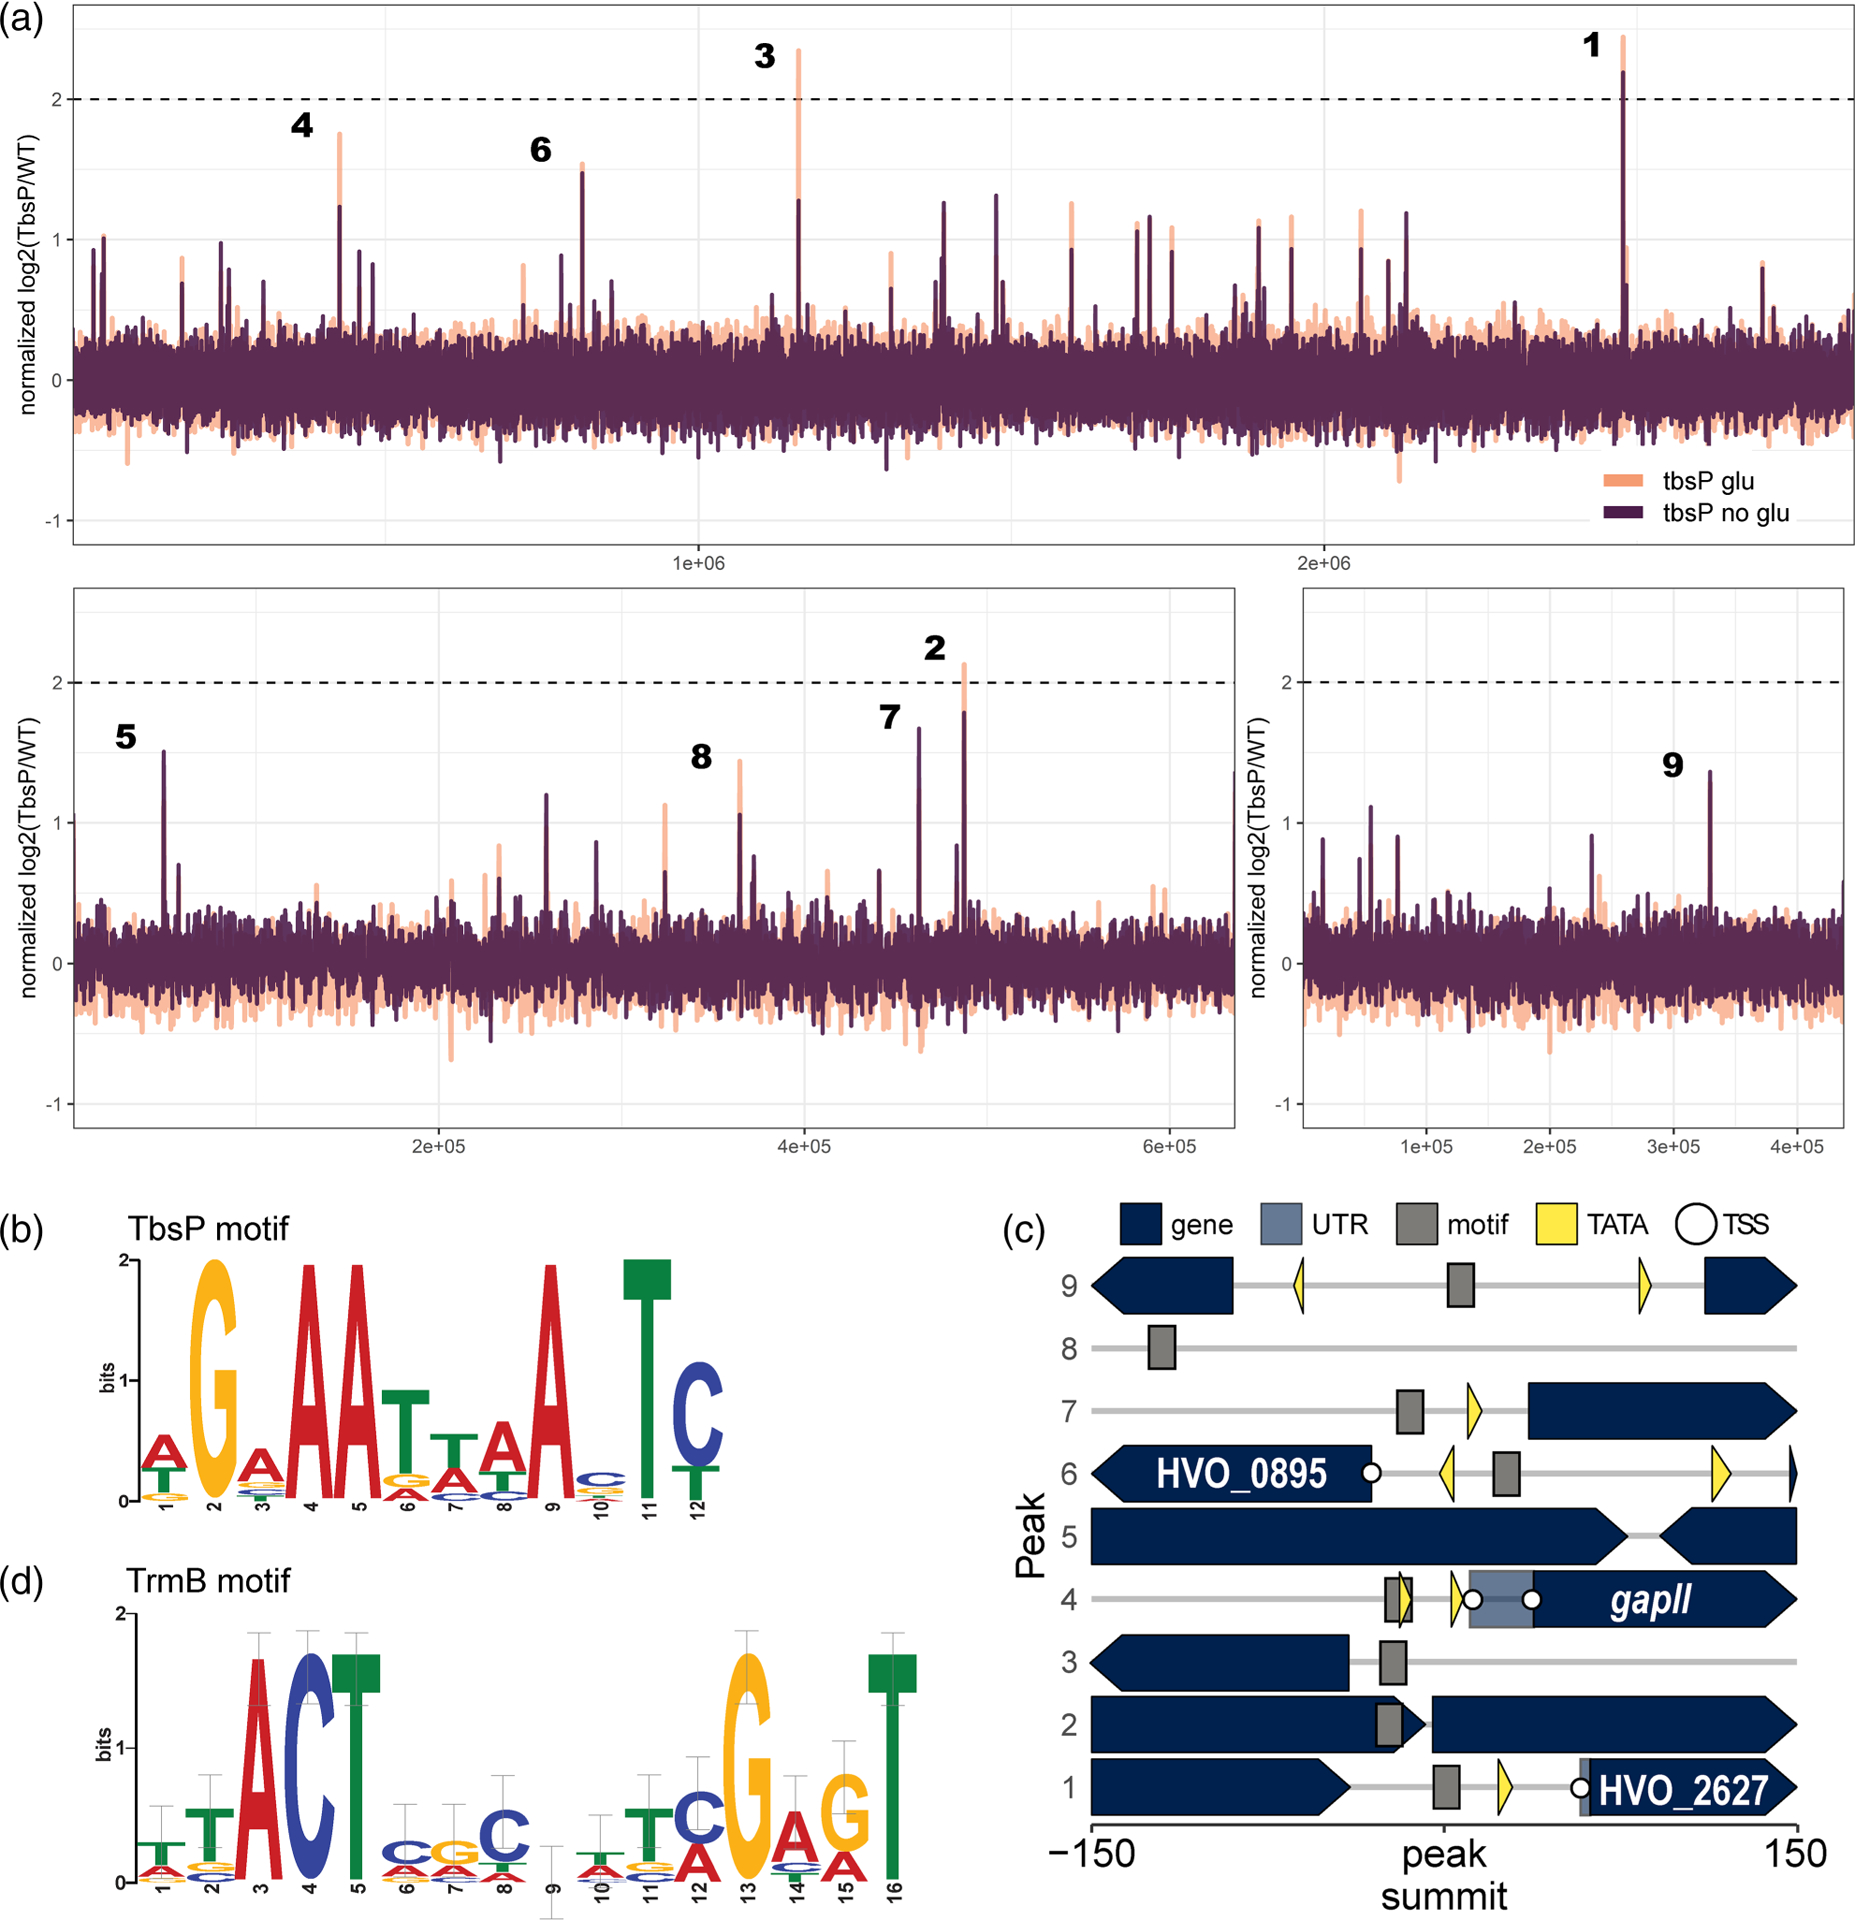
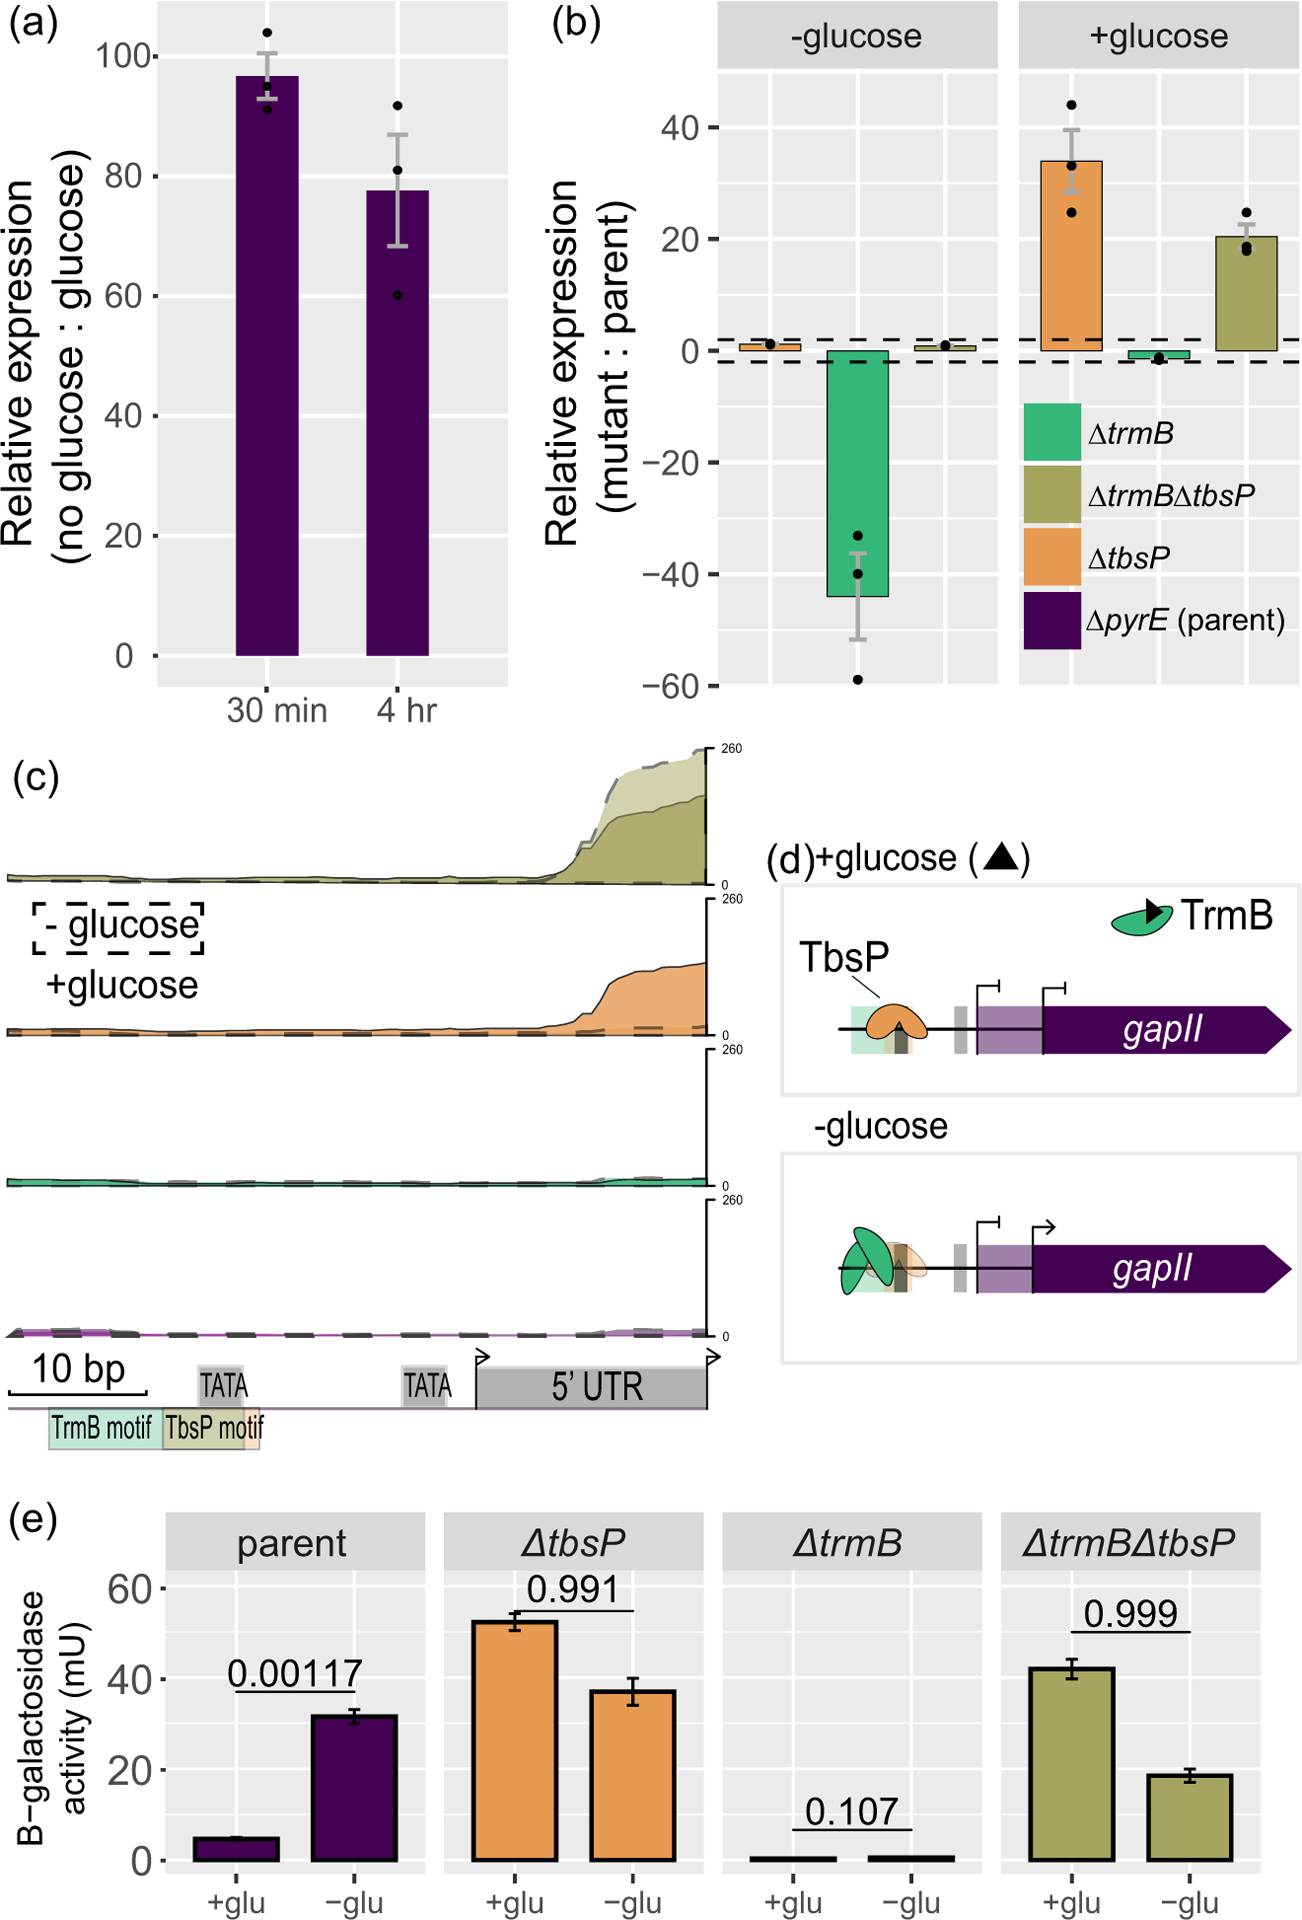
Microbial cells must continually adapt their physiology in the face of changing environmental conditions. Archaea living in extreme conditions, such as saturated salinity, represent important examples of such resilience. The model salt-loving organism Haloferax volcanii exhibits remarkable plasticity in its morphology, biofilm formation, and motility in response to variations in nutrients and cell density. However, the mechanisms regulating these lifestyle transitions remain unclear. In prior research, we showed that the transcriptional regulator, TrmB, maintains the rod shape in the related species Halobacterium salinarum by activating the expression of enzyme-coding genes in the gluconeogenesis metabolic pathway. In Hbt. salinarum, TrmB-dependent production of glucose moieties is required for cell surface glycoprotein biogenesis. Here, we use a combination of genetics and quantitative phenotyping assays to demonstrate that TrmB is essential for growth under gluconeogenic conditions in Hfx. volcanii. The ∆trmB strain rapidly accumulated suppressor mutations in a gene encoding a novel transcriptional regulator, which we name trmB suppressor, or TbsP (a.k.a. "tablespoon"). TbsP is required for adhesion to abiotic surfaces (i.e., biofilm formation) and maintains wild-type cell morphology and motility. We use functional genomics and promoter fusion assays to characterize the regulons controlled by each of TrmB and TbsP, including joint regulation of the glucose-dependent transcription of gapII, which encodes an important gluconeogenic enzyme. We conclude that TrmB and TbsP coregulate gluconeogenesis, with downstream impacts on lifestyle transitions in response to nutrients in Hfx. volcanii.

Keywords: Haloferax volcanii; Archaea; cell morphology; central metabolism; gene regulatory network; gluconeogenesis; transcription factor.


Conflict of interest statement

CONFLICT OF INTEREST STATEMENT

The authors have no conflicts of interest to report.

Figures

FIGURE 1
FIGURE 1
Bioinformatic identification of HVO_2688 as the candidate gluconeogenic transcription factor TrmB in Haloferax volcanii. (a) Diagram of the TrmB protein domains. Pfam_01978 denotes the N-terminal DNA-binding domain, and Pfam_11495 denotes the C-terminal substrate-binding domain. Haloferax. volcanii TrmB contains residues conserved in the putative sugar-binding domain (region shaded in red-brown). (b) Primary sequence alignment of Hfx. volcanii TrmB paralogs with TrmB-family proteins from other species, including the previously characterized TrmB homologs. Shaded regions correspond to the protein-domain architecture and location of PFAM domains in (a). Asterisks indicate amino acid residues specifically associated with sugar binding in the crystal structure of T. litoralis TrmB (Krug et al., 2006, 2013; Lee et al., 2003), red asterisks indicate the two residues essential for binding substrate. Conserved residues are shaded in black, conservative substitutions in gray, and poorly conserved residues are not shaded. Organism abbreviations and locus tags are as follows: TLI_TRMB, Thermococcus litoralis OCC_03542; PFU_TRMBL1, Pyrococcus furiosus PF0124 (Krug et al., 2013); TKO_TGR, Thermococcus kodakarensis TK1769 (Kanai et al., 2007); HBT_TRMB, Halobacterium salinarum VNG_1451C (Schmid et al., 2009).
FIGURE 2
FIGURE 2
TrmB is required for growth in the absence of glucose. (a) Growth curves of ΔtrmB versus parent strain cultured on HvCa without glucose. (b) Growth curves of ΔtrmB versus ΔpyrE2 cultured with glucose. (c) Complementation experiment: parent versus the ΔtrmB carrying empty vector (AKS232) versus ΔtrmB expressed in trans (AKS235), cultured in HvCa without (top) and with (bottom) glucose, with novobiocin to maintain plasmid selection. For each graph, bolded lines indicate the mean growth curves for biological replicate cultures, each with three technical replicates. Shaded regions indicate 95% confidence intervals. Strains are as follows: parent, ΔpyrE2 (H26); parent + p, H26 carrying empty vector pJAM202c (i.e. AKS229); ΔtrmB, AKS154; ΔtrmB + p, AKS154 carrying pJAM202c (i.e. AKS 232); ΔtrmB + ptrmB, AKS154 carrying pAKS91B (expresses wild-type trmB gene, i.e., AKS235).
FIGURE 3
FIGURE 3
TrmB accumulates suppressor mutations in tbsP (HVO_2861). (a) Growth curves comparing the H26 parent strain to the ΔtrmB strain (JM13) in HvCa medium lacking glucose. Suppressor strain growth curves are indicated by shades of teal. Each line represents the loess-smoothed growth curve for a representative culture. (b) Lollipop plot indicating the location of suppressor mutations within the tbsP gene. Mutation types are indicated in the legend below the plot. Details of suppressor genotypes are listed in Table 2 and Table S1.
FIGURE 4
FIGURE 4
TbsP is a putative transcriptional regulator that is conserved across halophiles. (a) Schematic of the predicted domain structure of the TbsP protein. The overlapping predicted DUF5821 domain is shown in gray. The amino acid positions of the protein are indicated in the scale bar below. (b) RosettaFold prediction for the tertiary structure of TbsP. (c) Predicted TbsP homologs in Archaea. (d) HMMER alignment of TbsP orthologs across closely related species of halophiles. Domains are shaded, as in (a). Perfectly conserved residues are shaded in black, conservative substitutions in gray, and there is no shading for poorly conserved residues.
FIGURE 5
FIGURE 5
TbsP plays a role in growth-phase dependent cell morphology transitions. (a) Growth curves for each strain in the presence (upper panel) or absence of glucose (lower panel). The colors in the legend are consistent throughout the figure. Dark lines indicate the Loess-smoothed mean of three biological replicates grown from separate colonies in technical triplicate, and the shaded region depicts the 95% confidence intervals. (b) Maximum instantaneous growth rates (μmax) for each strain under each condition in (a). Error bars represent the SD from the mean. (c, d) The distribution of cell shape from (c) mid-exponential and (d) early stationary liquid cultures. A score of 1 indicates a perfectly circular cell, and 0 indicates a perfectly linear cell. Crossbars represent the median of each distribution. Representative phase-contrast micrograph images for each strain are shown below. Scale bars, 3 μm, are shown. Raw images are shown in Figure S4, with statistical summaries and significance metrics given in Table S3. Asterisk represents a significant p-value in Welch’s t-test comparison between distributions of quantile normalized distribution of aspect ratios across strains.
FIGURE 6
FIGURE 6
Comparison of differentially expressed genes across deletion strains. (a) Clustering heatmap of genes differentially expressed in response to tbsP deletion across glucose replete and depleted conditions (interaction model) and genes differentially expressed in response to tbsP deletion (genotype model). Columns correspond to genotype and condition combinations, and rows represent the averaged normalized counts for each gene. Each row is self-standardized for normalization. Genes labeled in bold are near TbsP binding sites (Figure 7), while genes labeled with an asterisk encode proteins whose differential abundance has been implicated in Haloferax volcanii motility (Esquivel et al., 2016; Schiller et al., 2023). (b) Clustering heatmap of genes differentially expressed in response to trmB deletion across glucose replete and depleted conditions. Gene functions statistically overrepresented in each cluster are shown (p-values are cited in the text). Annotations for genes in each cluster, and whether the encoded proteins have been implicated in motility in previous studies (Esquivel et al., 2016; Schiller et al., 2023), are listed in Table S5. (c) Clusters with expression patterns consistent with TrmB-dependent induction and repression that are conserved with TrmB targets in other haloarchaeal species (Hackley et al., 2023, Schmid et al., 2009; Todor et al., 2013, 2014). Light gray lines connect normalized expression values for each transcript across strains and conditions. (d) Euler diagram representing the number of genes differentially expressed in each mutant strain and the overlap between gene sets in panels (a) and (b). (e) Genes differentially expressed in both TrmB and TbsP deletion backgrounds, clustered according to expression pattern across all strains and conditions. Genes exhibiting glucose-dependent expression in the parent that is absent in all mutant strains are boxed in black.
FIGURE 7
FIGURE 7
TbsP binds metabolic gene promoters in a glucose-independent manner. (a) Per base enrichment of ChIP-seq reads across the genome. Samples were normalized to paired input samples and averaged across replicates in the presence or absence of glucose and log-transformed. Numbers indicate the enrichment rank of each TbsP-binding site. Dashed lines indicate log2 fold change = 2. (b) Cis-regulator sequence motif logo resulting from XSTREME analysis (see Section 2) of the nine binding sites shown in (a). The y-axis height of each base pair in the logo represents the level of enrichment, and the x-axis numbers represent the bp position in the cis-regulatory motif. (c) Relative location of genomic features near TbsP-binding sites. Peak numbers correspond to those in (a). White circles indicate experimentally detected transcription start sites (TSS) from Babski et al. (2016). (d) Logo for the TrmB-like cis-regulatory binding motif identified in the promoters of differentially expressed genes. The location of each TrmB motif within promoters and the comparison of this motif across species are shown in Figure S6.
FIGURE 8
FIGURE 8
TrmB and TbsP interact with cis-regulatory regions upstream of gapII to modulate isoform-specific expression. (a) Relative expression of gapII in the H26 parent strain. Expression is calculated as a ratio of no glucose:glucose. (b) Relative expression of gapII in each mutant background in the absence and presence of glucose at 4 h following a split into (+) or (−) glucose medium. Error bars indicate the SE of the mean of three biological replicate trials, each conducted in technical triplicate. (c) Paired-end transcript reads aligning to the 93 bp upstream of the gapII start codon. The Y-axis represents the read pileup. Predicted core promoter elements and transcription factor binding sites are shown below. Colors are as in (b). (d) Model of TrmB and TbsP regulation of gapII expression in the presence and absence of glucose. (e) Promoter activity of the region in (c) in each strain background in milli units. Error bars depict the SE of three biological replicates done in technical triplicate. The significance values of the one-sided t-test given above. Colors are as in B. Promoter activities from control plasmids in each genetic background are shown in Figure S7.
FIGURE 9
FIGURE 9
TbsP represses archaellin-based motility and is required for pilin-dependent cell adhesion to surfaces. (a) False-color image of soft agar motility plates analyzed in the ImageJ program. Red spots represent motility halos for three replicate stabs of each strain per plate. ΔtrmB and ΔtrmBΔtbsP strains are shown in Figure S8. (b, c) Quantification of migration expressed as a proportion of the parent motility colony area for strains derived from (b) H26 or (c) H53. Error bars represent the SD from the mean of 3–6 replicate plates, and asterisks represent significant differences. p-values are given in the text. (d) Log10 normalized adhesion ratio (mutant:parent) for each mutant strain (see also Methods in Section 2). Dots represent the mean of at least three independent trials. Along the x-axis, symbols indicate whether glucose was added (+) or not (−). Strains with no such symbols were grown only in the absence of glucose. Error bars represent the SE of the mean. Overbars indicate groups compared in significance tests. Asterisks are: ***p < 8.01 × 10⁻¹⁵; *p < 0.02.

Similar articles

Cited by

References

    1. Ahmad MUD, Waege I, Hausner W, Thomm M, Boos W, Diederichs K et al. (2015) Structural insights into nonspecific binding of DNA by TrmBL2, an archaeal chromatin protein. Journal of Molecular Biology, 427, 3216–3229. - PubMed
    1. Allers T & Ngo HP (2003) Genetic analysis of homologous recombination in Archaea: Haloferax volcanii as a model organism. Biochemical Society Transactions, 31, 706–710. - PubMed
    1. Allers T, Ngo HP, Mevarech M & Lloyd RG (2004) Development of additional selectable markers for the halophilic archaeon Haloferax volcanii based on the leuB and trpA genes. Applied and Environmental Microbiology, 70, 943–953. - PMC - PubMed
    1. Babski J, Haas KA, Nather-Schindler D, Pfeiffer F, Forstner KU, Hammelmann M et al. (2016) Genome-wide identification of transcriptional start sites in the haloarchaeon Haloferax volcanii based on differential RNA-Seq (dRNA-seq). BMC Genomics, 17, 629. - PMC - PubMed
    1. Baek M, DiMaio F, Anishchenko I, Dauparas J, Ovchinnikov S, Lee GR et al. (2021) Accurate prediction of protein structures and interactions using a three-track neural network. Science, 373, 871–876. - PMC - PubMed

Publication types

MeSH terms