. 2024 Jan 2:2024:8843214.
doi: 10.1155/2024/8843214. eCollection 2024.

Different Degrees of Sulfated Laminaria Polysaccharides Recovered Damaged HK-2 Cells and Inhibited Adhesion of Nano-COM and Nano-COD Crystals

Affiliations

Different Degrees of Sulfated Laminaria Polysaccharides Recovered Damaged HK-2 Cells and Inhibited Adhesion of Nano-COM and Nano-COD Crystals

Qiu-Shi Xu et al. Bioinorg Chem Appl. .

Abstract

Purpose: The crystal adhesion caused by the damage of renal tubular epithelial cells (HK-2) is the key to the formation of kidney stones. However, no effective preventive drug has been found. This study aims to explore the recovery effects of four Laminaria polysaccharides (SLPs) with different sulfate (-OSO3-) contents on damaged HK-2 cells and the difference in the adhesion of damaged cells to nanometer calcium oxalate monohydrate (COM) and calcium oxalate dihydrate (COD) before and after recovery.

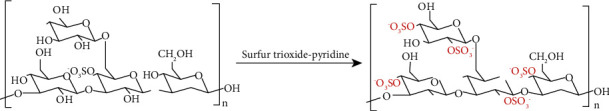
Methods: Sodium oxalate (2.6 mmol/L) was used to damage HK-2 cells to establish a damaged model. SLPs (LP0, SLP1, SLP2, and SLP3) with -OSO3- contents of 0.73%, 15.1%, 22.8%, and 31.3%, respectively, were used to restore the damaged cells, and the effects of SLPs on the adhesion of COM and COD, with a size of about 100 nm before and after recovery, were measured.

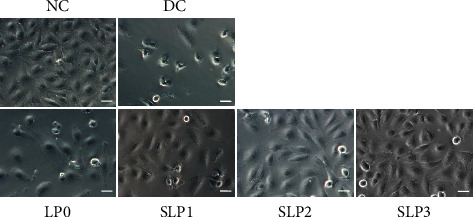
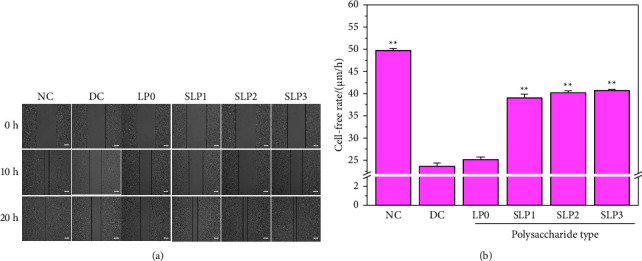
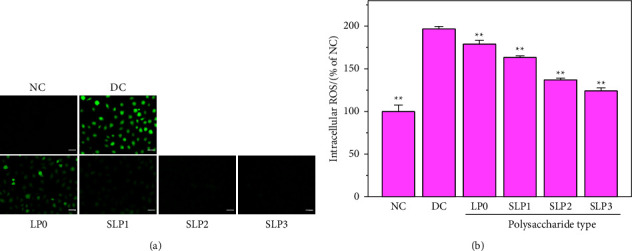
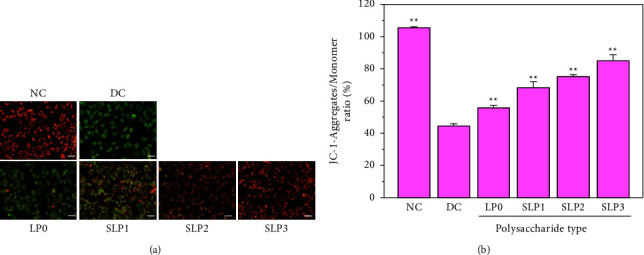
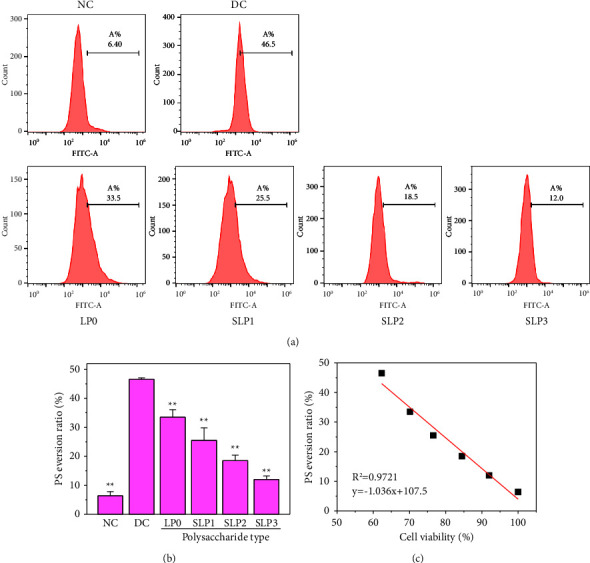
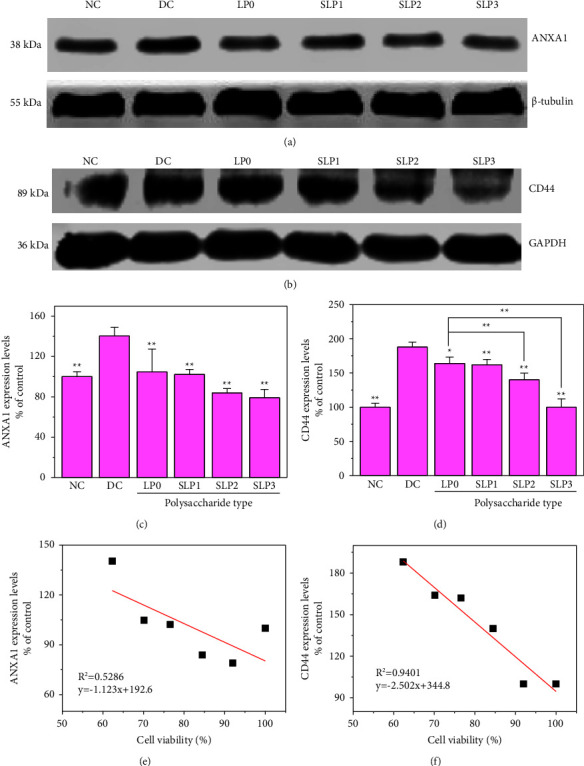
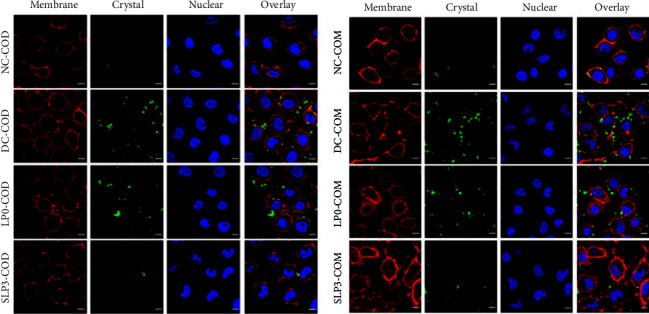
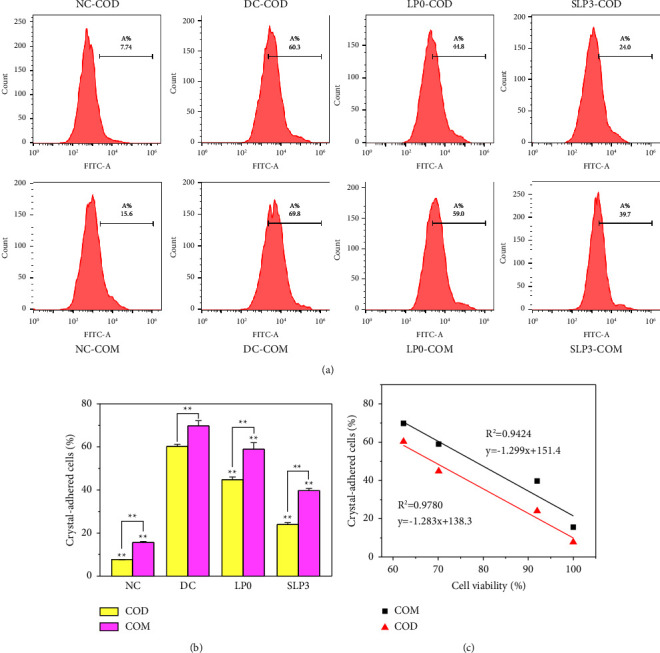
Results: The following results were observed after SLPs recovered the damaged HK-2 cells: increased cell viability, restored cell morphology, decreased reactive oxygen levels, increased mitochondrial membrane potential, decreased phosphatidylserine eversion ratio, increased cell migration ability, reduced expression of annexin A1, transmembrane protein, and heat shock protein 90 on the cell surface, and reduced adhesion amount of cells to COM and COD. Under the same conditions, the adhesion ability of cells to COD crystals was weaker than that to COM crystals.

Conclusions: As the sulfate content in SLPs increases, the ability of SLPs to recover damaged HK-2 cells and inhibit crystal adhesion increases. SLP3 with high -OSO3- content may be a potential drug to prevent kidney stones.


Conflict of interest statement

The authors declare that they have no conflicts of interest.

Figures

Figure 1
Figure 1
LP0 sulfation reaction equation.
Figure 2
Figure 2
The CCK-8 method was used to detect the cell viability before and after the recovery of damaged HK-2 cells by SLPs at different concentrations. Oxalate damage concentration: 2.6 mmol/L; damage time: 3.5 h; polysaccharide concentration: 20, 40, and 80 μg/mL; recovery time: 12 h; NC: normal control; DC: damaged control. Compared with the DC group, P < 0.05, ∗∗P < 0.01.
Figure 3
Figure 3
The cell morphology was observed by optical microscope before and after SLPs recovered damaged HK-2 cells. Oxalate damage concentration: 2.6 mmol/L; damage time: 3.5 h; polysaccharide concentration: 80 μg/mL; recovery time: 12 h; scale bars: 50 μm; NC: normal control; DC: damaged control.
Figure 4
Figure 4
Effects of SLPs on cell healing before and after recovery of damaged HK-2 cells. (a) Cell healing observed by optical microscope. It can be seen that the cell scratch healing rate of SLP1∼SLP3 repair groups is significantly increased than that of the injury group. (b) Statistical results of the cell-free width within 24 h oxalate damage concentration: 2.6 mmol/L; damage time: 3.5 h; polysaccharide concentration: 80 μg/mL; recovery time: 12 h; scale bars: 500 μm. NC: normal control; DC: damaged control. Compared with the DC group, P < 0.05, ∗∗P < 0.01.
Figure 5
Figure 5
ROS levels were observed by fluorescence microscope before and after SLPs recovered damaged HK-2 cells. (a) Fluorescence microscope images. (b) Statistical results of ROS fluorescence intensity. Oxalate damage concentration: 2.6 mmol/L; damage time: 3.5 h; polysaccharide concentration: 80 μg/mL; recovery time: 12 h; scale bars: 50 μm. NC: normal control; DC: damaged control. Compared with the DC group, P < 0.05, ∗∗P < 0.01.
Figure 6
Figure 6
Mitochondrial membrane potential was observed by fluorescence microscope before and after SLPs recovered damaged HK-2 cells. (a) Fluorescence microscope images. (b) Statistical results of JC-1 fluorescence intensity. Oxalate damage concentration: 2.6 mmol/L; damage time: 3.5 h; polysaccharide concentration: 80 μg/mL; recovery time: 12 h; scale bars: 50 μm. NC: normal control, DC: damaged control. Compared with the DC group, P < 0.05, ∗∗P < 0.01.
Figure 7
Figure 7
Detection of phosphatidylserine (PS) eversion ratio. (a) Flow cytometry was used to detect the PS eversion ratio of HK-2 cells. (b) Statistical results of PS eversion ratio. (c) Relationship between PS eversion amount on the cell surface and cell viability. Oxalate damage concentration: 2.6 mmol/L; damage time: 3.5 h; polysaccharide concentration: 80 μg/mL; recovery time: 12 h; NC: normal control, DC: damaged control. Compared with the DC group, P < 0.05, ∗∗P < 0.01.
Figure 8
Figure 8
Western blot was used to detect the expression levels of annexin A1 (ANXA1) and transmembrane protein (CD44). (a) Western blot of ANXA1. (b) Western blot of CD44. (c, d) Statistical results of ANXA1 and CD44 relative expression levels. (e, f) Relationship between cell viability and the expression levels of ANXA1 and CD44 on the cell surface. Oxalate damage concentration: 2.6 mmol/L; damage time: 3.5 h; polysaccharide concentration: 80 μg/mL; recovery time: 12 h; NC: normal control; DC: damaged control. Compared with the DC group, P < 0.05, ∗∗P < 0.01.
Figure 9
Figure 9
Fluorescence labeling of calcium oxalate crystals. Images of COD crystals (a, b) and COM crystals (c, d) before and after FITC fluorescence labeling. Flow cytometry analysis of COD (e, f) and COM crystals (g, h) before and after FITC fluorescence labeling. Statistical results of COD and COM crystals before and after FITC fluorescence labeling (i). FITC: fluorescein isothiocyanate.
Figure 10
Figure 10
Differences in the adhesion of nano-COM and nano-COD crystals before and after the recovery of damaged HK-2 cells by LP0 and SLP3. Oxalate damage concentration: 2.6 mmol/L; damage time: 3.5 h; polysaccharide concentration: 80 μg/mL; recovery time: 12 h nano-COM and nano-COD concentration: 200 μg/mL; adhesion time: 1 h NC: normal control, DC: damaged control.
Figure 11
Figure 11
Confocal qualitative observation of cell adhesion. Green fluorescence is FITC-labeled nano-COM and COD crystals, red fluorescence is the cell membrane stained by DiI, and blue fluorescence is the cell nucleus stained by DAPI. Oxalate damage concentration: 2.6 mmol/L; damage time: 3.5 h; polysaccharide concentration: 80 μg/mL; recovery time: 12 h nano-COM and nano-COD concentration: 200 μg/mL; adhesion time: 1 h Scale bars: 10 μm. NC: normal control, DC: damaged control.
Figure 12
Figure 12
Quantitative detection of cell adhesion to nano-COM and nano-COD crystals before and after SLPs recovered damaged HK-2 cells. (a) The proportion of cells that adhere to the crystals was quantitatively detected by flow cytometry; (b) Statistical results of the proportion of cells that adhere to the crystals; (c) Relationship between cell viability and the adhesion amount of COM and COD crystals on the cell surface. Oxalate damage concentration: 2.6 mmol/L; damage time: 3.5 h; polysaccharide concentration: 80 μg/mL; recovery time: 12 h nano-COM and nano-COD concentration: 200 μg/mL; adhesion time: 1 h NC: normal control, DC: damaged control. Compared with the DC group, P < 0.05, ∗∗P < 0.01.
Figure 13
Figure 13
Model diagram of SLPs recovered damaged HK-2 cells and inhibited adhesion of nano-CaOx crystals.

Similar articles

Cited by

References

    1. Khan S. R., Pearle M. S., Robertson W. G., et al. Kidney stones. Nature Reviews Disease Primers . 2016;2(1):16008–16023. doi: 10.1038/nrdp.2016.8. - DOI - PMC - PubMed
    1. Guerra A., Ticinesi A., Allegri F., Pinelli S., Aloe R., Meschi T. Idiopathic calcium nephrolithiasis with pure calcium oxalate composition: clinical correlates of the calcium oxalate dihydrate/monohydrate (COD/COM) stone ratio. Urolithiasis . 2020;48(3):271–279. doi: 10.1007/s00240-019-01156-8. - DOI - PubMed
    1. Khan S. R. Is oxidative stress, a link between nephrolithiasis and obesity, hypertension, diabetes, chronic kidney disease, metabolic syndrome? Urology Research and Practice . 2012;40(2):95–112. doi: 10.1007/s00240-011-0448-9. - DOI - PMC - PubMed
    1. O’Kell A. L., Grant D. C., Khan S. R. Pathogenesis of calcium oxalate urinary stone disease: species comparison of humans, dogs, and cats. Urolithiasis . 2017;45(4):329–336. doi: 10.1007/s00240-017-0978-x. - DOI - PMC - PubMed
    1. Song Q. L., He Z. Q., Li B., et al. Melatonin inhibits oxalate-induced endoplasmic reticulum stress and apoptosis in HK-2 cells by activating the AMPK pathway. Cell Cycle . 2020;19(20):2600–2610. doi: 10.1080/15384101.2020.1810401. - DOI - PMC - PubMed