. 2024 Jan 2:2024:6673550.
doi: 10.1155/2024/6673550. eCollection 2024.

Citrus limon (L.) Osbeck Fruit Peel Extract Attenuates Carbon Tetrachloride-Induced Hepatocarcinogenesis in Sprague-Dawley Rats

Affiliations

Citrus limon (L.) Osbeck Fruit Peel Extract Attenuates Carbon Tetrachloride-Induced Hepatocarcinogenesis in Sprague-Dawley Rats

Alex Boye et al. Biomed Res Int. .

Abstract

Background: Traditional herbal medicine practitioners in the Ashanti region of Ghana use the fruit peels of Citrus limon (L.) Osbeck (C. limon) in preventive and curative treatment of many cancers including liver cancer. This ethnobotanical claim remains to be verified scientifically. Aim of the Study. This study investigated prophylactic hepatoprotective and anti-HCC effects of C. limon peel extract (LPE) in CCl4/olive oil-induced HCC-like rats.

Materials and methods: After preparation of LPE, it was subjected to phytochemical screening using standard phytochemical methods. A total of 30 healthy adult male Sprague-Dawley rats (weighing 150-200 g) were randomly assigned into six groups of 5 rats each. Rats in the control group received olive oil (5 mL/kg ip) twice weekly for 16 weeks. Rats in the model group received CCl4/olive oil (2 mL/kg, ip) twice weekly for 16 weeks. Rats in capecitabine (10 mg/kg po) and LPE (50, 100, and 200 mg/kg po) groups received CCl4/olive oil (2 mL/kg, i.p) in the morning and their respective treatments in the afternoon twice a week for 16 weeks. Rats in all groups had free access to food and water ad libitum. Body weight and survival rates were monitored. Rats were sacrificed under deep anesthesia, blood was collected, and liver and other organs were isolated. Aspartate transaminase (AST), alanine transaminase (ALT), alkaline phosphatase (ALP), gamma-glutamyltransferase (GGT), prothrombin time, bilirubin, C-reactive protein (CRP), alpha- (α-) fetoprotein (AFP), and liver histology were assessed.

Results: Alkaloids, tannins, flavonoids, terpenoids, and saponins were detected in LPE. Model rats demonstrated increased serum levels of AFP, CRP, ALP, GGT, ALT, and AST, prothrombin time, total bilirubin, direct bilirubin, blood lymphocyte, and monocyte counts, but decreased serum albumin and total protein compared to control rats. Unlike the control, model rats demonstrated fat accumulation in periportal and centrilobular hepatocytes and neoplastic transformation. Semiquantitation of periodic acid Schiff- (PAS-) stained liver sections showed decreased glycogen storage in hepatocytes of model rats compared to control rats. Compared to the model, LPE treatment protected against CCl4-induced hepatocarcinogenesis, which was evidenced by decreased AFP, CRP, liver enzymes, total and direct bilirubin, prothrombin time, and blood lymphocyte and monocyte counts; attenuation of fat accumulation; and increased glycogen storage, albumin, and total protein.

Conclusion: LPE abates CCl4-induced hepatocarcinogenesis by attenuating liver inflammation and improving metabolic, biosynthetic, and detoxification functions of the liver. The prophylactic hepatoprotective and anti-hepatocarcinogenic effects of LPE are attributable to its phytochemical composition raising hopes of finding potential anticancer bioactive compounds from C. limon fruit peels.


Conflict of interest statement

The authors declare that they have no known competing financial interest or personal relationships that could have appeared to influence the work reported in this paper.

Figures

Figure 1
Figure 1
An illustration of the experimental design and dosing schedule for the study. AST: aspartate transaminase; ALT: alanine transaminase; ALP: alkaline phosphatase; GGT: gamma-glutamyltransferase; LPE: Citrus limon fruit peel extract; ip: intraperitoneal; po: per oral.
Figure 2
Figure 2
Effect of LPE treatment on body weight and survival rate of rats over 16 weeks of treatment. Mean change in body weight (a) and survival rate (b). Each bar is the mean ± SD, n = 3. Control group received olive oil (5 mL/kg ip) in the morning twice a week for 16 weeks. The model group received CCl4/olive oil (2 mL/kg ip) in the morning twice a week for 16 weeks. LPE and capecitabine groups received CCl4/olive oil (2 mL/kg ip) in the morning and, respectively, LPE (50, 100, and 200 mg/kg po) and capecitabine (100 mg/kg po) in the afternoon twice a week for 16 weeks. LPE: Citrus limon fruit peel extract.
Figure 3
Figure 3
Effect of LPE treatment on periodic acid Schiff- (PAS-) stained liver parenchyma. (a) Control group, (b) model group, (c) capecitabine group, (d) LPE (50 mg/kg po), (e) LPE (100 mg/kg po), and (f) LPE (200 mg/kg po). (I) Liver parenchyma. (II) Centrilobular hepatocytes. (III) Periportal hepatocytes. The control group received olive oil (5 mL/kg ip) in the morning twice a week for 16 weeks. The model group received CCl4/olive oil (2 mL/kg ip) in the morning twice a week for 16 weeks. LPE and capecitabine groups received CCl4/olive oil (2 mL/kg ip) in the morning and, respectively, LPE (50, 100, and 200 mg/kg po) and capecitabine (100 mg/kg po) in the afternoon twice a week for 16 weeks. Black arrows represent stromal invasion; red arrows represent hepatocytes exhibiting lipid accumulation; yellow arrows represent liver parenchyma where hepatocytes do not exhibit lipid accumulation. LPE: Citrus limon fruit peel extract.
Figure 4
Figure 4
Semiquantitative analysis of glycogen content of hepatocytes. (a) Image processing workflow of micrographs of periodic acid Schiff- (PAS-) stained liver photomicrographs for glycogen quantification. (A) control group, (B) model group, (C) capecitabine group, (D) LPE (50 mg/kg po), (E) LPE (100 mg/kg po), and (F) LPE (200 mg/kg po). (b) Bar graph showing percent threshold for PAS-stained glycogen content in each group. Original micrograph (I). (II, III) Processed images (PAS and hematoxylin, respectively) after color deconvolution using user-defined vectors (VI). (IV) The inverted forms of (II). The control group received olive oil (5 mL/kg ip) in the morning twice a week for 16 weeks. The model group received CCl4/olive oil (2 mL/kg ip) in the morning twice a week for 16 weeks. LPE and capecitabine groups received CCl4/olive oil (2 mL/kg ip) in the morning and, respectively, LPE (50, 100, and 200 mg/kg po) and capecitabine (100 mg/kg po) in the afternoon twice a week for 16 weeks. ×400. Each value is the mean ± SD, n = 3, P < 0.05, control vs. model, n = 3; #P ≤ 0.05, model vs. LPE, n = 3. LPE: Citrus limon fruit peel extract.
Figure 5
Figure 5
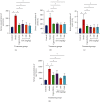
Effect of LPE on serum concentrations of alpha- (α-) fetoprotein (AFP) (a) and C-reactive protein (AFP) (b). Control group received olive oil (5 mL/kg ip) in the morning twice a week for 16 weeks. The model group received CCl4/olive oil (2 mL/kg ip) in the morning twice a week for 16 weeks. LPE and capecitabine groups received CCl4/olive oil (2 mL/kg ip) in the morning and, respectively, LPE (50, 100, and 200 mg/kg po) and capecitabine (100 mg/kg po) in the afternoon twice a week for 16 weeks. Each value is the mean ± SD, n = 3. P ≤ 0.05, Control vs. model; #P ≤ 0.05, LPE and capecitabine vs. model. LPE: Citrus limon fruit feel extract.
Figure 6
Figure 6
Effect of LPE treatment on serum liver enzymes after 16 weeks of oral exposure of rats to CCl4/olive oil. ALT (a), AST (b), GGT (c), and ALP (d). The control group received olive oil (5 mL/kg ip) in the morning twice a week for 16 weeks. The model group received CCl4/olive oil (2 mL/kg ip) in the morning twice a week for 16 weeks. LPE and capecitabine groups received CCl4/olive oil (2 mL/kg ip) in the morning and, respectively, LPE (50, 100, and 200 mg/kg po) and capecitabine (100 mg/kg po) in the afternoon twice a week for 16 weeks. Each value is the mean ± SD, n = 3. P ≤ 0.05 (control vs. model); #P ≤ 0.05, model vs. LPE. ALT: serum alanine transaminase; ALP: serum alkaline phosphatase; AST: serum aspartate transaminase; GGT: serum glutamyltransferase; LPE: Citrus limon fruit peel extract.
Figure 7
Figure 7
Effect of LPE treatment on full blood count after 16 weeks of oral exposure of rats to CCl4/olive oil. RBC (a), hemoglobin (b), WBC (c), monocyte (d), platelets (e), lymphocytes (f), and neutrophil (g). The control group received olive oil (5 mL/kg ip) in the morning twice a week for 16 weeks. The model group received CCl4/olive oil (2 mL/kg ip) in the morning twice a week for 16 weeks. LPE and capecitabine groups received CCl4/olive oil (2 mL/kg ip) in the morning and, respectively, LPE (50, 100, and 200 mg/kg po) and capecitabine (100 mg/kg po) in the afternoon twice a week for 16 weeks. Each value is the mean ± SD, n = 3. P ≤ 0.05, control vs. model; #P ≤ 0.05, model vs. LPE. RBC: red blood cells; Hb: hemoglobin; WBC: white blood cell; LPE: Citrus limon fruit peel extract.
Figure 8
Figure 8
Effect of LPE treatment on biosynthetic function of livers after 16 weeks of oral exposure of rats to CCl4/olive oil. (a) Serum total protein, (b) serum albumin, (c) prothrombin time, (d) total bilirubin, and (e) direct bilirubin. The control group received olive oil (5 mL/kg ip) in the morning twice a week for 16 weeks. The model group received CCl4/olive oil (2 mL/kg ip) in the morning twice a week for 16 weeks. LPE and capecitabine groups received CCl4/olive oil (2 mL/kg ip) in the morning and, respectively, LPE (50, 100, and 200 mg/kg po) and capecitabine (100 mg/kg po) in the afternoon twice a week for 16 weeks. Each value is the mean ± SD, n = 3. P ≤ 0.05, control vs. model; #P ≤ 0.05, model vs. LPE. ns: not significant; LPE: Citrus limon fruit peel extract.

Similar articles

References

    1. Yang J. D., Hainaut P., Gores G. J., Amadou A., Plymoth A., Roberts L. R. A global view of hepatocellular carcinoma: trends, risk, prevention and management. Nature Reviews Gastroenterology & Hepatology . 2019;16(10):589–604. doi: 10.1038/s41575-019-0186-y. - DOI - PMC - PubMed
    1. Orcutt S. T., Anaya D. A. Liver resection and surgical strategies for management of primary liver cancer. Cancer Control . 2018;25(1, article 107327481774462) doi: 10.1177/1073274817744621. - DOI - PMC - PubMed
    1. Mikolasevic I., Bozic D., Pavić T., et al. Liver disease in the era of COVID-19: is the worst yet to come? World Journal of Gastroenterology . 2021;27(36):6039–6052. doi: 10.3748/wjg.v27.i36.6039. - DOI - PMC - PubMed
    1. Chen Q., Shu C., Laurence A. D., et al. Effect of Huaier granule on recurrence after curative resection of HCC: a multicentre, randomised clinical trial. Gut . 2018;67(11):2006–2016. doi: 10.1136/gutjnl-2018-315983. - DOI - PubMed
    1. Rawat D., Shrivastava S., Naik R. A., Chhonker S. K., Mehrotra A., Koiri R. K. An overview of natural plant products in the treatment of hepatocellular carcinoma. Anti-Cancer Agents in Medicinal Chemistry . 2018;18(13):1838–1859. - PubMed

MeSH terms