. 2023 Dec 9;27(1):108703.
doi: 10.1016/j.isci.2023.108703. eCollection 2024 Jan 19.

YTHDF3 modulates the Cbln1 level by recruiting BTG2 and is implicated in the impaired cognition of prenatal hypoxia offspring

Affiliations

YTHDF3 modulates the Cbln1 level by recruiting BTG2 and is implicated in the impaired cognition of prenatal hypoxia offspring

Likui Lu et al. iScience. .

Abstract

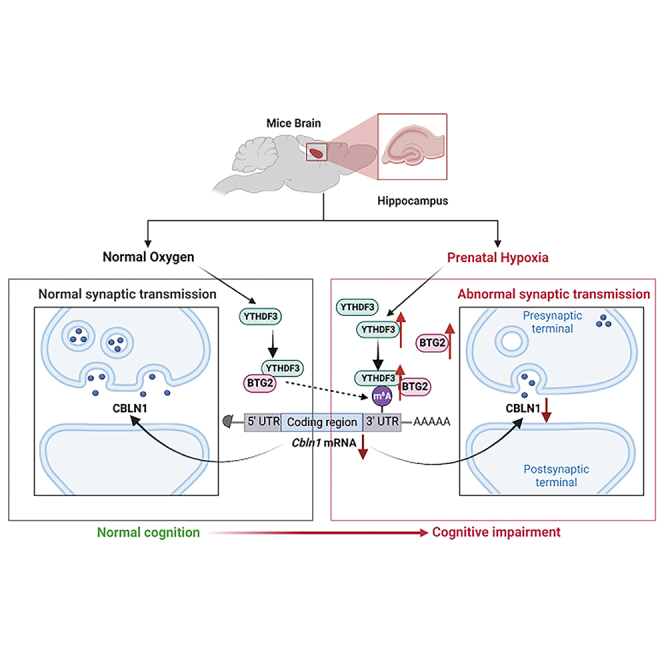
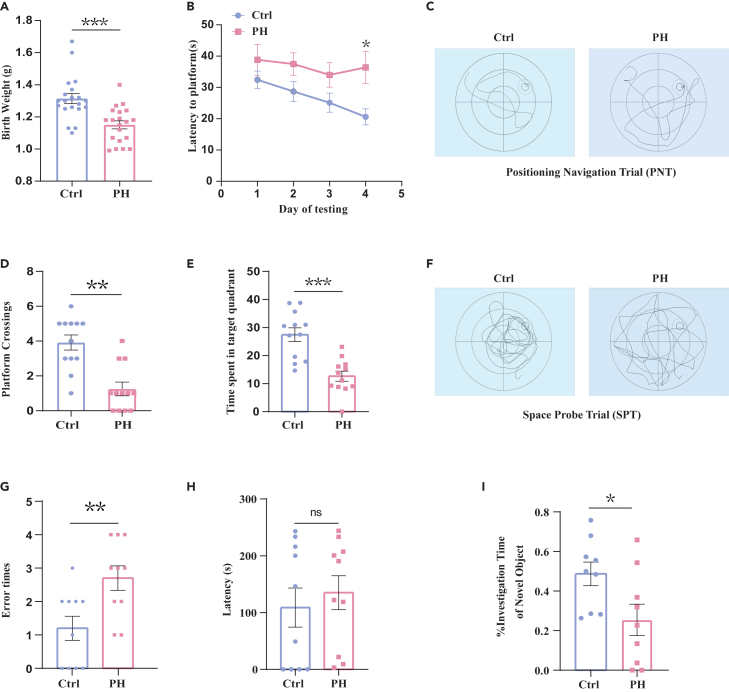
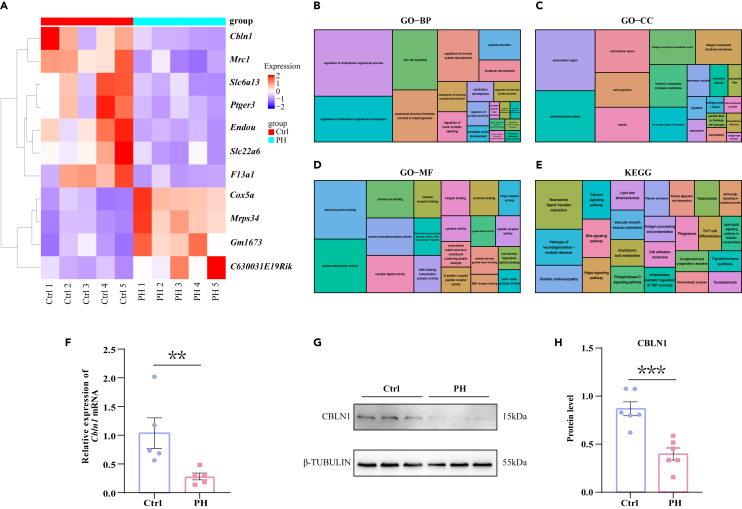
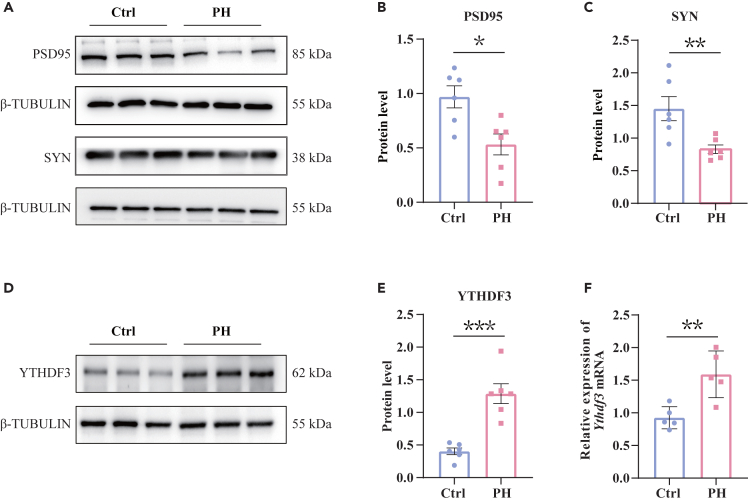
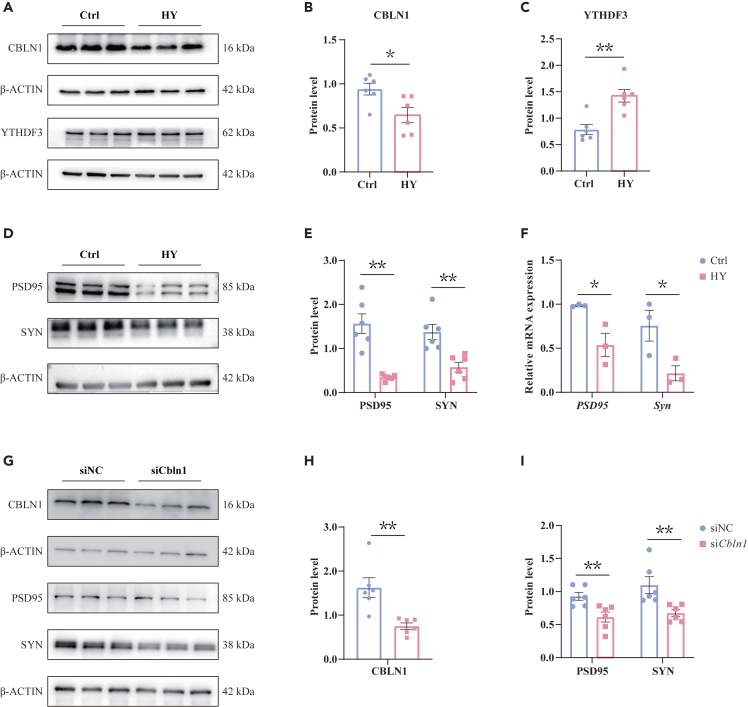
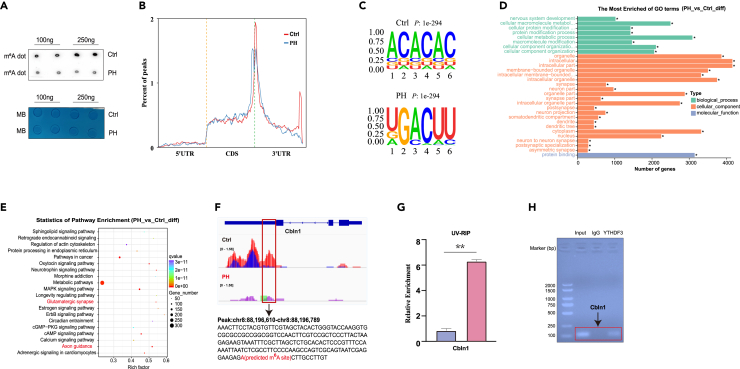
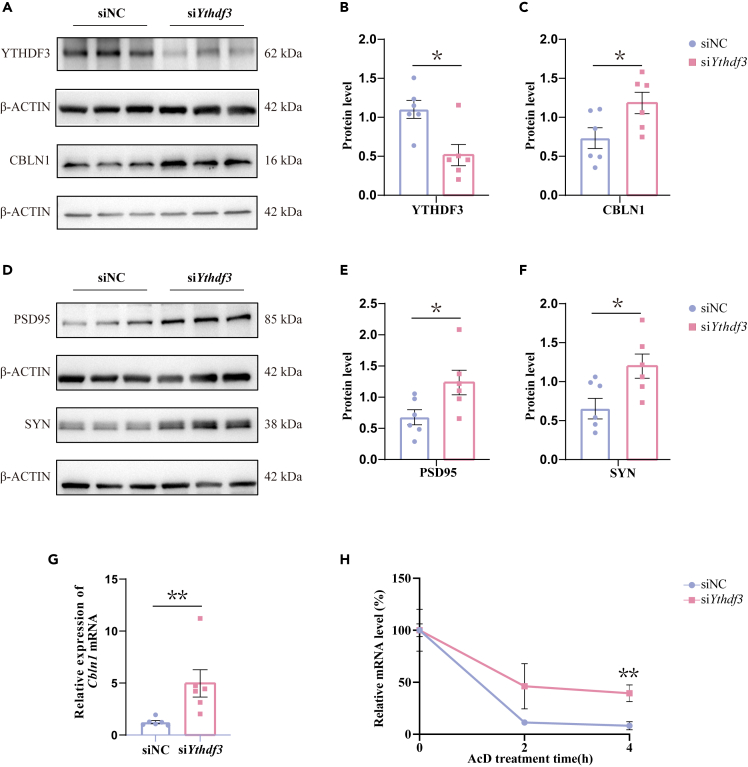
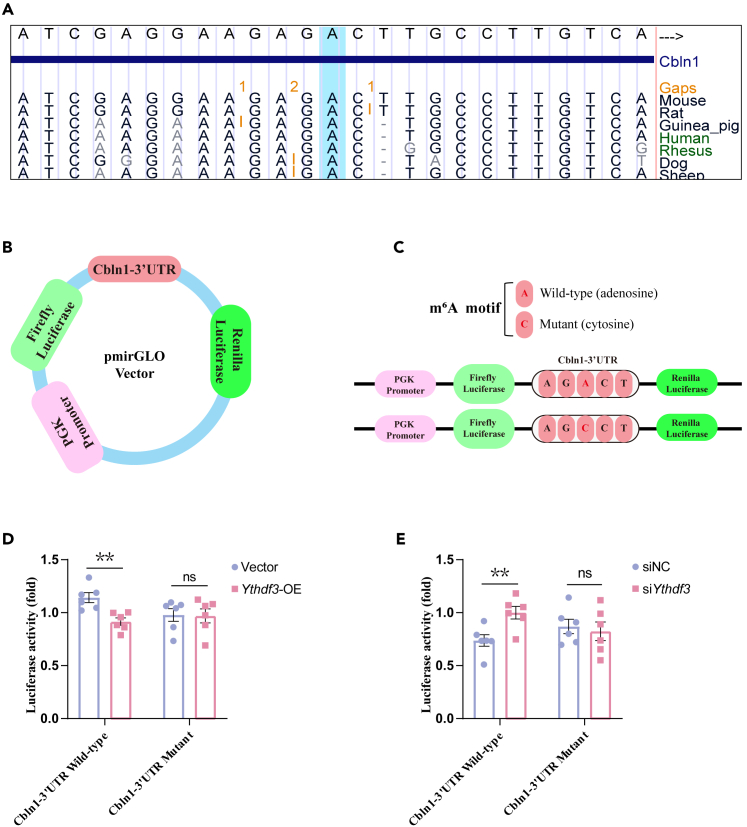
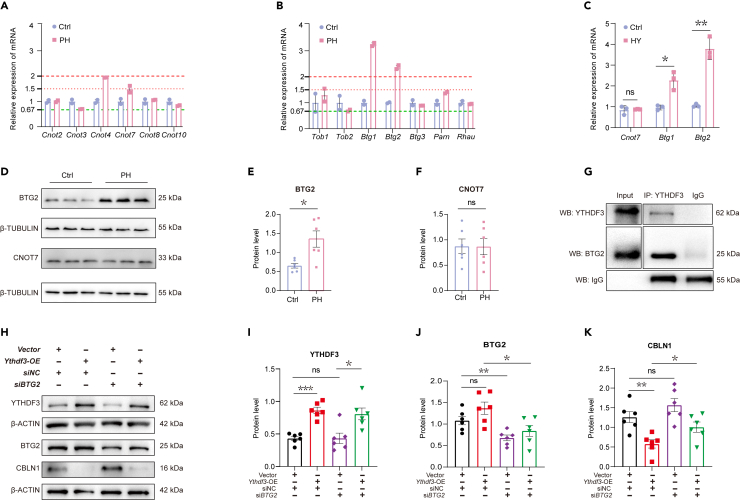
The "Fetal Origins of Adult Disease (FOAD)" hypothesis holds that adverse factors during pregnancy can increase the risk of chronic diseases in offspring. Here, we investigated the effects of prenatal hypoxia (PH) on brain structure and function in adult offspring and explored the role of the N6-methyladenosine (m6A) pathway. The results suggest that abnormal cognition in PH offspring may be related to the dysregulation of the m6A pathway, specifically increased levels of YTHDF3 in the hippocampus. YTHDF3 interacts with BTG2 and is involved in the decay of Cbln1 mRNA, leading to the down-regulation of Cbln1 expression. Deficiency of Cbln1 may contribute to abnormal synaptic function, which in turn causes cognitive impairment in PH offspring. This study provides a scientific clues for understanding the mechanisms of impaired cognition in PH offspring and provides a theoretical basis for the treatment of cognitive impairment in offspring exposed to PH.

Keywords: Neurology; molecular mechanism of gene regulation; pregnancy.


Conflict of interest statement

The authors declare no competing interests.

Figures

None
Graphical abstract
Figure 1
Figure 1
Impaired spatial learning and memory in PH offspring (A) Birth weight between the two groups (Ctrl, n = 20; PH, n = 20). (B) Learning curves of Ctrl (black, n = 12) and PH (red, n = 12) offspring in MWM tests with hidden platform. (C) Representative swimming paths of Ctrl and PH offspring in the positioning navigation trial of MWM test. (D) Platform crossing number of two groups (Ctrl, n = 12; PH, n = 12) in MWM probe test. (E) Target quadrant time of two groups (Ctrl, n = 12; PH, n = 12) in the MWM probe test. (F) Representative swimming paths of Ctrl and PH offspring in MWM probe test. (G) Error times during the retention trial in step-through tests (Ctrl, n = 10; PH, n = 10). (H) The time that mice in two groups (Ctrl, n = 10; PH, n = 10) took before initially entering the dark chamber (the step-through latency). (I) Time exploring novel object during the test session (percentage) in NOR tests (Ctrl, n = 9; PH, n = 9). Data are shown as mean ± SEM. ∗, p < 0.05; ∗∗, p < 0.01; ∗∗∗, p < 0.001; ns, no significance.
Figure 2
Figure 2
Impact of prenatal hypoxia on the gene expression landscape in the hippocampus (A) Heatmap shows differentially expressed genes (DEGs) between the Ctrl and PH groups. (B) Treemap of gene ontology (GO) Biological Process (BP) terms for DEGs, with the size of boxes corresponding to the number of DEGs associated with the GO category. (C) Treemap of GO Cellular Component (CC) terms for DEGs, with the size of boxes corresponding to the number of DEGs associated with the GO category. (D) Treemap of GO Molecular Function (MF) terms for DEGs, with the size of boxes corresponding to the number of DEGs associated with the GO category. (E) Treemap of Kyoto Encyclopedia of Genes and Genomes (KEGG) terms for DEGs, with the size of boxes corresponding to the number of DEGs associated with the KEGG category. (F) The mRNA level of Cbln1 in the hippocampus from two groups (Ctrl, n = 5; PH, n = 5). (G and H) The protein level of CBLN1 in the hippocampus from two groups (Ctrl, n = 6; PH, n = 6). Data are shown as mean ± SEM. ∗∗, p < 0.01; ∗∗∗, p < 0.001.
Figure 3
Figure 3
Hypoxia-induced reduced synaptic function in vivo (A, B, and C) The protein level of PSD95 and SYN in the hippocampus from two groups (Ctrl, n = 6; PH, n = 6). (D and E) The protein level of YTHDF3 in the hippocampus from two groups (Ctrl, n = 6; PH, n = 6). (F) Ythdf3 mRNA expression in the hippocampal tissues from two groups (Ctrl, n = 5; PH, n = 5). Data are shown as mean ± SEM. ∗, p < 0.05; ∗∗, p < 0.01; ∗∗∗, p < 0.001.
Figure 4
Figure 4
Co-regulation of YTHDF3 and CBLN1 induced by hypoxia in vitro (A, B, and C) Protein level of CBLN1 and YTHDF3 in N2a cells after being treated with 3% O2 for 12 h (Ctrl, n = 6; HY, n = 6). (D and E) Protein level of PSD95 and SYN in the N2a cells after treatment with 3% O2 for 12 h (Ctrl, n = 6; HY, n = 6). (F) PSD95, and Syn mRNA expression in the N2a cells after being treated with 3% O2 for 12 h (Ctrl, n = 3; HY, n = 3). (G, H, and I) Representative western blots result of PSD95 and SYN from Cbln1 knockdown N2a cells (siNC, n = 6; siCbln1, n = 6). Data are shown as mean ± SEM. ∗, p < 0.05; ∗∗, p < 0.01.
Figure 5
Figure 5
Cbln1 is an important target gene of YTHDF3 (A) Representative dot blot images showing m6A abundance in two groups. (B) Distribution of high-confidence m6A-containing peaks across the length of mRNA in two groups (Ctrl, red line; PH, blue line). (C) Binding motif identified by HOMER with m6A-containing peaks in two groups. (D) Representative Gene Ontology (GO) terms of the biological process, cellular component, and molecular function categories enriched in transcripts with different m6A-containing peaks. Gene ontology (GO) analysis was performed using the DAVID bioinformatics database. GO classification for cellular component, biological process, and molecular function were performed with default settings. (E) Bubble chart for representative Kyoto Encyclopedia of Genes and Genomes (KEGG) terms enriched in transcripts with different level m6A-containing peaks. (F) m6A abundance on Cbln1 mRNA in Ctrl or PH hippocampus was plotted by the IGV. Blue and purple colors show the m6A signals of input samples from two groups, while red and green stand for signals of IP samples from two groups. The range of signals in all groups was normalized to a 0–1.58 scale. At the same position, the m6A peaks of the IP group over the input group were recognized as the genuine m6A level. Blue blocks above indicated the sites where the m6A level differed between two groups (the nucleotide sequence of the m6A level differed regions were shown later in discussion), and the most remarkable location were highlighted with a scarlet pane. (G) Relative enrichment of Cbln1 mRNA associated with YTHDF3 protein was identified by UV-RIP assays using anti-IgG and anti-YTHDF3 antibodies. The IgG group was a negative control to preclude nonspecific binding. Data are shown as mean ± SEM, n = 2. (H) Agarose gel electrophoresis results by using RT-qPCR products from UV-RIP assays. The product (Cbln1) location was highlighted with a red dotted box. Data are shown as mean ± SEM. ∗∗, p < 0.01.
Figure 6
Figure 6
YTHDF3 determines Cbln1 fate by regulating transcript stability in vitro (A, B, and C) Western blot was performed to analyze the level of YTHDF3 and CBLN1 in the N2a cell line after treatment with siYthdf3. siNC, negative control, n = 6; siYthdf3, Ythdf3 knockdown, n = 6. (D, E, and F) Representative western blots result of PSD95 and SYN from Ythdf3 knockdown N2a cells. siNC, negative control, n = 6; siYthdf3, Ythdf3 knockdown, n = 6. (G) RT-qPCR results of Cbln1 expression from Ythdf3 knockdown N2a cells. siNC, negative control, n = 6; siYthdf3, Ythdf3 knockdown, n = 6. (H) Representative mRNA profile of Cbln1 at 0-, 2-, and 4-h time points after actinomycin D (5 μg/mL) treatment (h.p.t.) in NC (negative control, n = 6) and siYthdf3 (Ythdf3 knockdown, n = 6) group. Data are shown as mean ± SEM. ∗, p < 0.05; ∗∗, p < 0.01.
Figure 7
Figure 7
YTHDF3 regulates Cbln1 mRNA stability in an m6A-dependent manner (A) Conservation of a very high-confidence m6A site in the 3′UTR of Cbln1 transcript, and the m6A site location was highlighted with a sky blue background. (B and C) Graphical explanation for the construction of luciferase reporters. The wild-type or mutant (m6A motif mutated) sequence of Cbln1-3′UTR was inserted into a pmirGLO vector between Firefly and Renilla elements. Relative luciferase activity was computed by the ratio of Firefly and Renilla luciferase values. (D and E) Relative luciferase activity of N2a cells transfected with the Cbln1-wild type or -mutated construct was measured, with normal or altered the expression of Ythdf3. Data are shown as mean ± SEM. ∗∗, p < 0.01; ns, no significance.
Figure 8
Figure 8
YTHDF3 destabilizes Cbln1 mRNA by recruiting BTG2 (A and B) The expression levels of CCR4–NOT deadenylase complex (Cnot2, Cnot3, Cnot4, Cnot7, Cnot8, Cnot10), BTG/Tob family members (Tob1, Tob2, Btg1, Btg2, Btg3), Parn and Rhau in the hippocampus from two groups (Ctrl, n = 2; PH, n = 2). (C) The expression levels of Cnot7, Btg1, and Btg2 in N2a cells treated with 3% O2 for 24 h (Ctrl, n = 3; HY, n = 3). (D, E, and F) The protein level of BTG2 and CNOT7 in the hippocampus from two groups (Ctrl, n = 6; PH, n = 6). (G) YTHDF3 antibody, and control IgG antibody were used for immunoprecipitation of the mouse hippocampal tissue. YTHDF3-interacting proteins were examined by western blotting with anti-BTG2. The representative images were shown. (H, I, J, and K) The protein level of YTHDF3, BTG2, and CBLN1 in N2a cells after being treated with siBTG2 and Ythdf3-OE. Data are shown as mean ± SEM. ∗, p < 0.05; ∗∗, p < 0.01; ∗∗∗, p < 0.001; ns, no significance.

Similar articles

Cited by

References

    1. Barker D.J. The fetal and infant origins of adult disease. BMJ. 1990;301:1111. - PMC - PubMed
    1. Calkins K., Devaskar S.U. Fetal origins of adult disease. Curr. Probl. Pediatr. Adolesc. Health Care. 2011;41:158–176. - PMC - PubMed
    1. Barker D.J., Osmond C., Golding J., Kuh D., Wadsworth M.E. Growth in utero, blood pressure in childhood and adult life, and mortality from cardiovascular disease. BMJ. 1989;298:564–567. - PMC - PubMed
    1. Barker D.J.P., Osmond C., Kajantie E., Eriksson J.G. Growth and chronic disease: findings in the Helsinki Birth Cohort. Ann. Hum. Biol. 2009;36:445–458. - PubMed
    1. Barker D.J.P. The developmental origins of insulin resistance. Horm. Res. 2005;64:2–7. - PubMed