

Ellagic acid inhibits tumor growth and potentiates the therapeutic efficacy of sorafenib in hepatocellular carcinoma
- PMID: 38205284
- PMCID: PMC10777069
- DOI: 10.1016/j.heliyon.2023.e23931
Ellagic acid inhibits tumor growth and potentiates the therapeutic efficacy of sorafenib in hepatocellular carcinoma
Abstract
Background: Sorafenib is a classic molecular targeted drug approved for hepatocellular carcinoma (HCC) therapy. However, a poor response rate and increasing resistance to sorafenib make its therapeutic efficacy suboptimal. Combination treatment with an agent capable of potentiating sorafenib sensitivity may be a promising solution.
Aim: The aim of this study was to determine the synergistic effect of ellagic acid (EA), a natural polyphenol, and sorafenib on HCC.
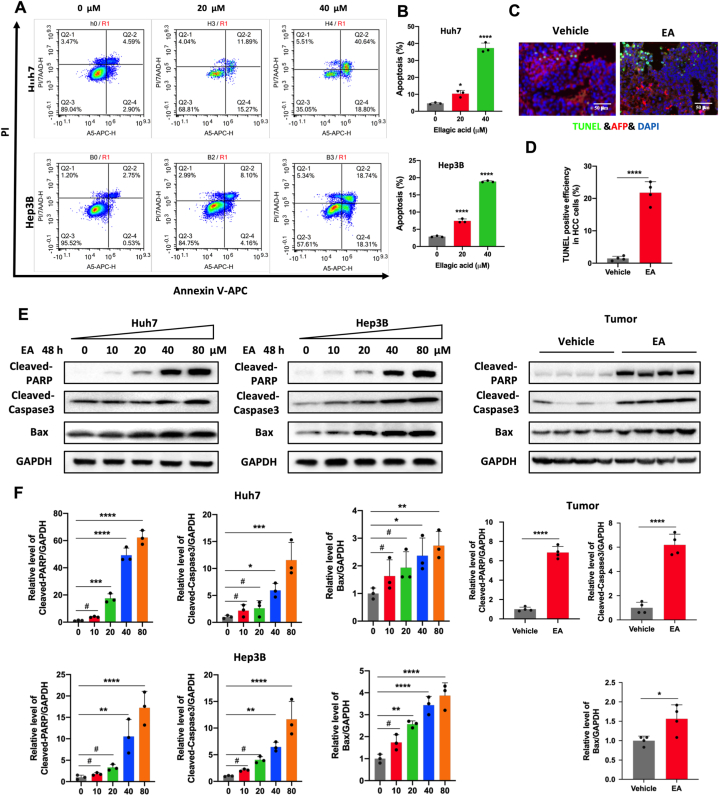
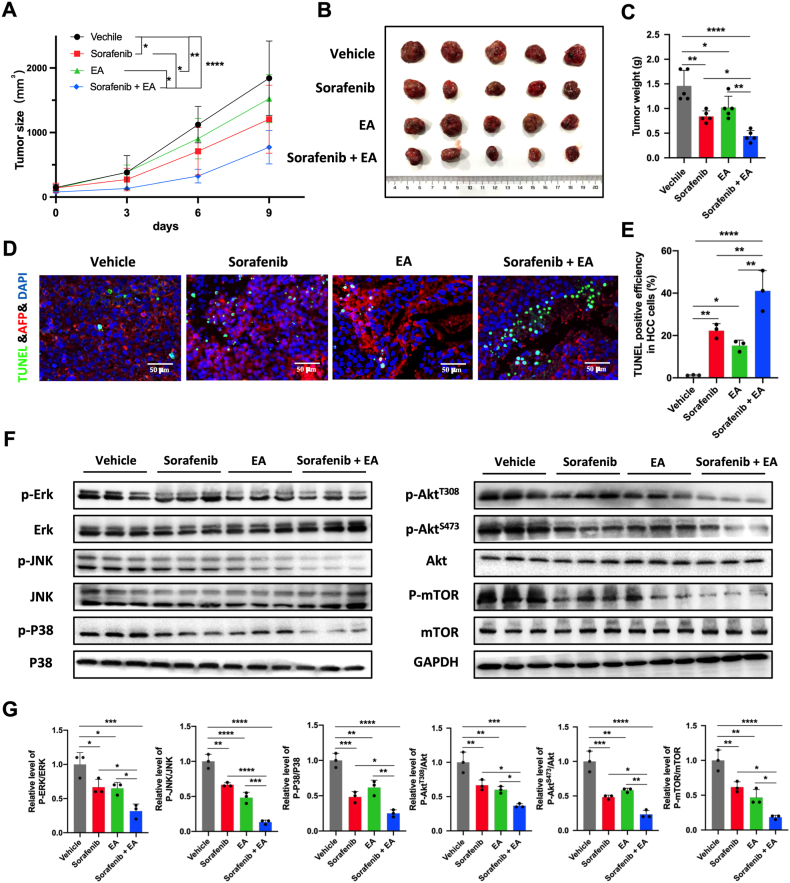
Methods: CCK-8, EdU incorporation and colony formation assays were used to study the effect of EA on HCC cell proliferation. Apoptosis was detected by flow cytometry in HCC cells and TUNEL assay in xenograft tumors. Transcriptome analysis was utilized to investigate alterations in signaling pathways with EA treatment. A xenograft mouse model was used to confirm the synergistic effect of sorafenib and EA on HCC tumors in vivo.
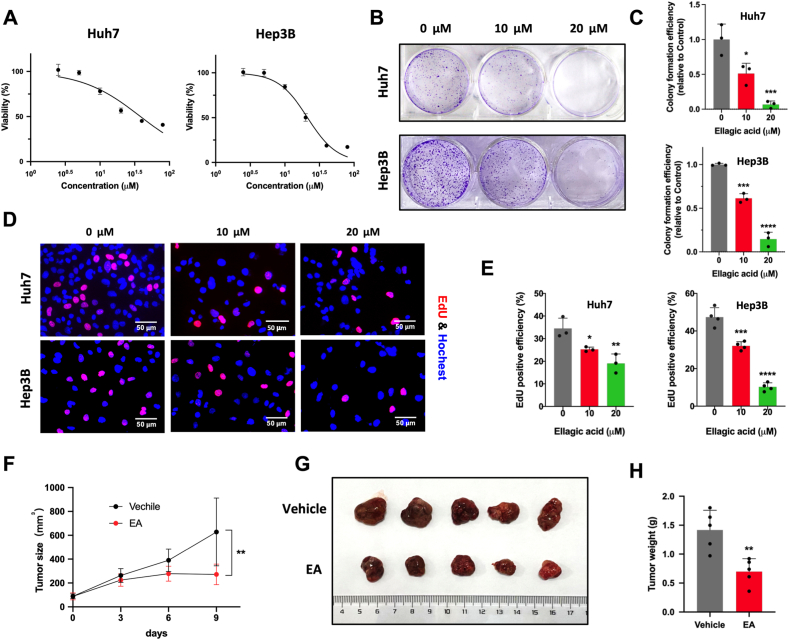
Results: We found that EA inhibited growth and induced apoptosis in both HCC cells and xenograft tumors. Mechanistically, EA treatment reduced the activation of the MAPK and Akt/mTOR signaling pathways in HCC cells. Furthermore, combined EA and sorafenib treatment further inhibited the MAPK and Akt/mTOR signaling pathways compared to EA or sorafenib alone. EA synergistically potentiated the anticancer activity of sorafenib against HCC both in vitro and in vivo.
Conclusion: EA inhibits HCC growth by inducing apoptosis through attenuation of the MAPK and Akt/mTOR signaling pathways. EA potentiates the response of HCC tumors to sorafenib both in vitro and in vivo, an effect that may be attributed to further inhibition of the MAPK and Akt/mTOR signaling pathways. These results suggest that EA is an effective adjuvant option for sorafenib therapy.
Keywords: Akt/mTOR; Ellagic acid; Hepatocellular carcinoma; MAPK; Sorafenib.
© 2023 The Authors.
Conflict of interest statement
The authors declare that they have no known competing financial interests or personal relationships that could have appeared to influence the work reported in this paper.
Figures


Similar articles
-
Exploring the Potential of Ellagic Acid in Gastrointestinal Cancer Prevention: Recent Advances and Future Directions.Oncol Ther. 2024 Dec;12(4):685-699. doi: 10.1007/s40487-024-00296-1. Epub 2024 Sep 2. Oncol Ther. 2024. PMID: 39222186 Free PMC article. Review.
-
Preclinical efficacy of a novel dual PI3K/mTOR inhibitor, CMG002, alone and in combination with sorafenib in hepatocellular carcinoma.Cancer Chemother Pharmacol. 2019 Oct;84(4):809-817. doi: 10.1007/s00280-019-03918-y. Epub 2019 Aug 5. Cancer Chemother Pharmacol. 2019. PMID: 31385002
-
A novel multitarget kinase inhibitor BZG with potent anticancer activity in vitro and vivo enhances efficacy of sorafenib through PI3K pathways in hepatocellular carcinoma cells.Biomed Pharmacother. 2020 May;125:110033. doi: 10.1016/j.biopha.2020.110033. Epub 2020 Feb 25. Biomed Pharmacother. 2020. PMID: 32187962
-
Co-delivery of sorafenib and metapristone encapsulated by CXCR4-targeted PLGA-PEG nanoparticles overcomes hepatocellular carcinoma resistance to sorafenib.J Exp Clin Cancer Res. 2019 May 31;38(1):232. doi: 10.1186/s13046-019-1216-x. J Exp Clin Cancer Res. 2019. PMID: 31151472 Free PMC article.
-
Ovatodiolide and antrocin synergistically inhibit the stemness and metastatic potential of hepatocellular carcinoma via impairing ribosome biogenesis and modulating ERK/Akt-mTOR signaling axis.Phytomedicine. 2023 Jan;108:154478. doi: 10.1016/j.phymed.2022.154478. Epub 2022 Sep 25. Phytomedicine. 2023. PMID: 36265255
Cited by
-
A review of Phyllanthus urinaria L. in the treatment of liver disease: viral hepatitis, liver fibrosis/cirrhosis and hepatocellular carcinoma.Front Pharmacol. 2024 Aug 9;15:1443667. doi: 10.3389/fphar.2024.1443667. eCollection 2024. Front Pharmacol. 2024. PMID: 39185304 Free PMC article. Review.
-
Targeting the mTOR Pathway in Hepatocellular Carcinoma: The Therapeutic Potential of Natural Products.J Inflamm Res. 2024 Dec 6;17:10421-10440. doi: 10.2147/JIR.S501270. eCollection 2024. J Inflamm Res. 2024. PMID: 39659752 Free PMC article. Review.
-
Research advances in natural sesquiterpene lactones: overcoming cancer drug resistance through modulation of key signaling pathways.Cancer Drug Resist. 2025 Mar 24;8:13. doi: 10.20517/cdr.2024.178. eCollection 2025. Cancer Drug Resist. 2025. PMID: 40201307 Free PMC article. Review.
-
Exploring the Potential of Ellagic Acid in Gastrointestinal Cancer Prevention: Recent Advances and Future Directions.Oncol Ther. 2024 Dec;12(4):685-699. doi: 10.1007/s40487-024-00296-1. Epub 2024 Sep 2. Oncol Ther. 2024. PMID: 39222186 Free PMC article. Review.
References
-
- Sung H., et al. Global cancer statistics 2020: GLOBOCAN estimates of incidence and mortality worldwide for 36 cancers in 185 countries. CA Cancer J Clin. 2021;71(3):209–249. - PubMed
-
- Llovet J.M., et al. Hepatocellular carcinoma. Nat Rev Dis Primers. 2021;7(1):6. - PubMed
-
- Ford R., et al. Lessons learned from independent central review. Eur. J. Cancer. 2009;45(2):268–274. - PubMed
LinkOut - more resources
Full Text Sources
Miscellaneous
