

An immune-related prognostic gene ULBP2 is correlated with immunosuppressive tumor microenvironment and immunotherapy in breast cancer
- PMID: 38205308
- PMCID: PMC10776944
- DOI: 10.1016/j.heliyon.2023.e23687
An immune-related prognostic gene ULBP2 is correlated with immunosuppressive tumor microenvironment and immunotherapy in breast cancer
Abstract
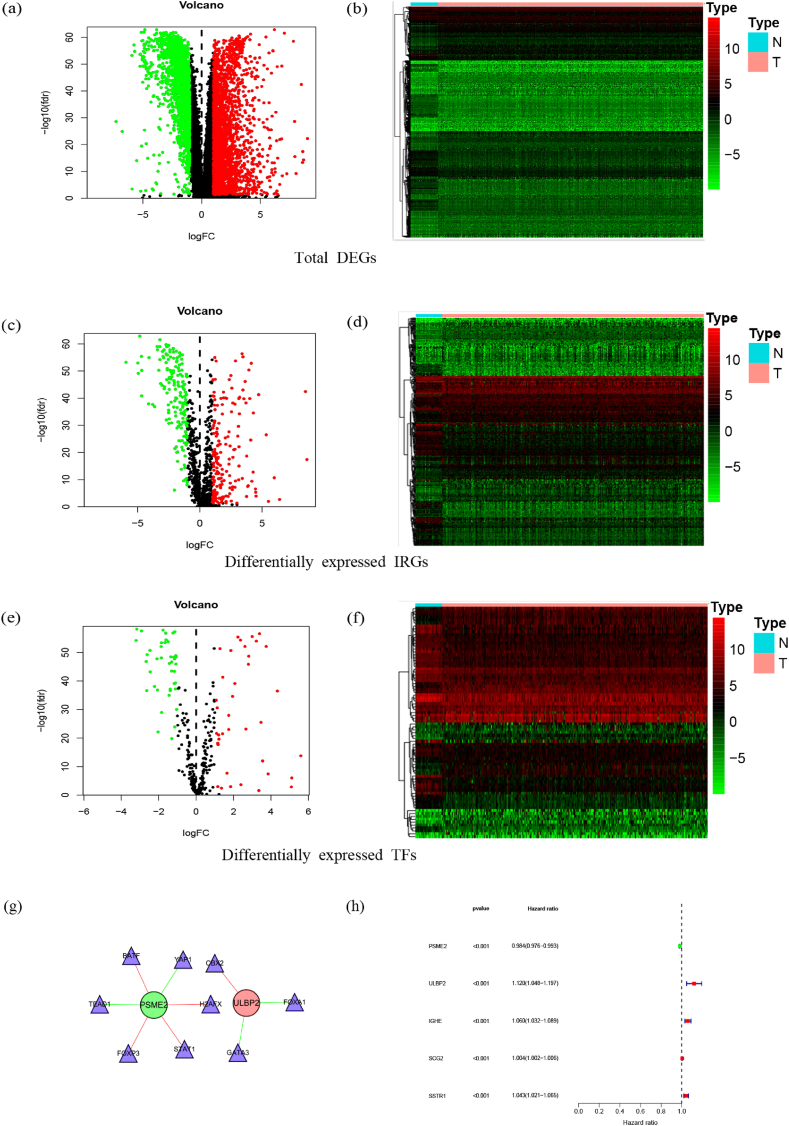
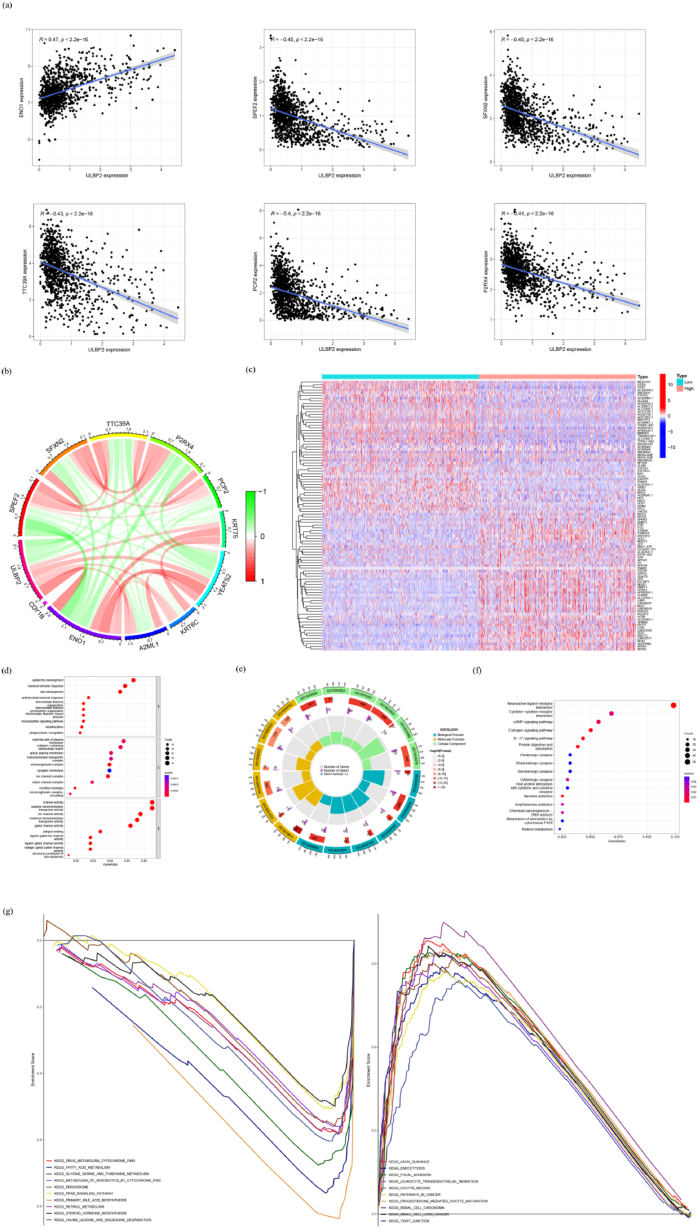
Breast cancer (BC) is one of the major dangerous tumors threatening women's lives. We here aimed to sort out prognostic immune-related genes by univariate Cox regression analysis and build a model of immune-related genes for forecasting the prognosis of BC patients. We identified UL16 binding protein 2 (ULBP2) as a valuable gene for study in the model using related databases and algorithms analysis. We found the stromal and immune cells scores were higher in ULBP2 high expression group and ULBP2 was related to kinds of immune cells, most importantly had negative correlation with CD8+ T cell. Notably, ULBP2 was positively correlated with tumor mutational burden (TMB) and had relationship with many immune checkpoints. Correlation analysis revealed that ULBP2 expression was closely linked to the clinicopathological characters and negatively related to BC patient survival. Gene Ontology (GO) and Kyoto Encyclopedia of Genes and Genomes (KEGG) pathway enrichment analysis showed the functional enrichment of differential genes related to ULBP2. Gene Set Enrichment Analysis (GSEA) indicated pathway enrichment in ULBP2 high and low expression groups. In short, this study comprehensively investigated the potential function of ULBP2 in BC, which might make ULBP2 to be an important therapeutic target for BC.
Keywords: Breast cancer; Immune genes; Immunotherapy effect prediction; Prognostic model; Tumor microenvironment status; ULBP2.
© 2023 The Authors.
Conflict of interest statement
The authors declare that they have no known competing financial interests or personal relationships that could have appeared to influence the work reported in this paper.
Figures


Similar articles
-
ULBP2 is a biomarker related to prognosis and immunity in colon cancer.Mol Cell Biochem. 2023 Oct;478(10):2207-2219. doi: 10.1007/s11010-022-04647-2. Epub 2023 Jan 12. Mol Cell Biochem. 2023. PMID: 36633827
-
Construction and validation of a bladder cancer risk model based on autophagy-related genes.Funct Integr Genomics. 2023 Jan 23;23(1):46. doi: 10.1007/s10142-022-00957-2. Funct Integr Genomics. 2023. PMID: 36689018
-
High FLT3 expression indicates favorable prognosis and correlates with clinicopathological parameters and immune infiltration in breast cancer.Front Genet. 2022 Sep 8;13:956869. doi: 10.3389/fgene.2022.956869. eCollection 2022. Front Genet. 2022. PMID: 36159964 Free PMC article.
-
Identification of SHCBP1 as a potential biomarker involving diagnosis, prognosis, and tumor immune microenvironment across multiple cancers.Comput Struct Biotechnol J. 2022 Jun 18;20:3106-3119. doi: 10.1016/j.csbj.2022.06.039. eCollection 2022. Comput Struct Biotechnol J. 2022. PMID: 35782736 Free PMC article.
-
Identify potential prognostic indicators and tumor-infiltrating immune cells in pancreatic adenocarcinoma.Biosci Rep. 2022 Feb 25;42(2):BSR20212523. doi: 10.1042/BSR20212523. Biosci Rep. 2022. PMID: 35083488 Free PMC article. Review.
Cited by
-
Identifying subtypes and developing prognostic models based on N6-methyladenosine and immune microenvironment related genes in breast cancer.Sci Rep. 2024 Jul 18;14(1):16586. doi: 10.1038/s41598-024-67477-w. Sci Rep. 2024. PMID: 39020010 Free PMC article.
-
Clinical significance of peripheral blood UL16 and DR-70 for the early diagnosis and prognostic evaluation of colorectal cancer.World J Gastrointest Oncol. 2024 Sep 15;16(9):3832-3838. doi: 10.4251/wjgo.v16.i9.3832. World J Gastrointest Oncol. 2024. PMID: 39350986 Free PMC article.
-
ULBP2 CAR-T cells enhance gastric cancer immunotherapy by inhibiting CAF activation.Cell Death Dis. 2025 Aug 8;16(1):597. doi: 10.1038/s41419-025-07905-5. Cell Death Dis. 2025. PMID: 40775202 Free PMC article.
-
Tumour mutation burden and infiltrating immune cell subtypes influenced the breast cancer prognosis.Transl Cancer Res. 2024 May 31;13(5):2208-2221. doi: 10.21037/tcr-23-2195. Epub 2024 May 29. Transl Cancer Res. 2024. PMID: 38881919 Free PMC article.
References
-
- Xu Y., Deng J., Wang L., et al. Identification of candidate genes associated with breast cancer prognosis. DNA Cell Biol. 2020;39:1205–1227. - PubMed
LinkOut - more resources
Full Text Sources
Research Materials
