. 2023 Dec 19;10(1):e23956.
doi: 10.1016/j.heliyon.2023.e23956. eCollection 2024 Jan 15.

The effect of a protective layer on the optical behavior of retro-reflective paintings for building envelopes

Affiliations

The effect of a protective layer on the optical behavior of retro-reflective paintings for building envelopes

Beatrice Castellani et al. Heliyon. .

Abstract

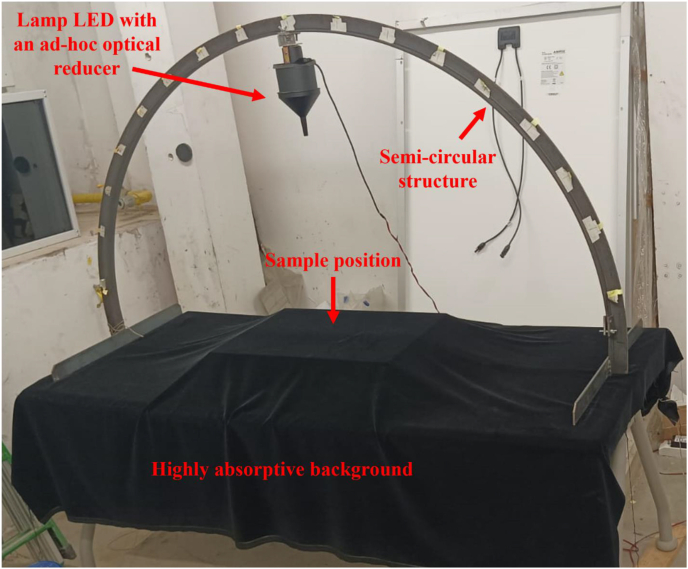
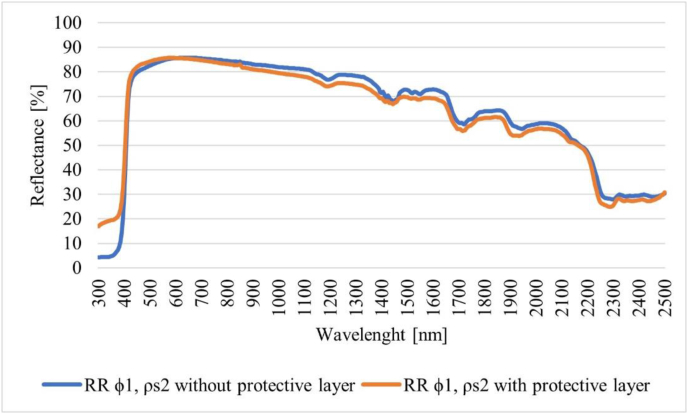
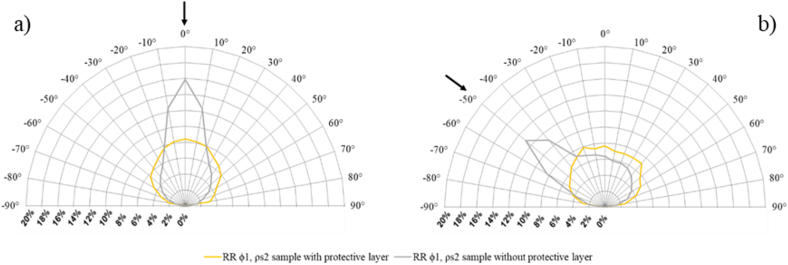
Retro-reflective (RR) materials, applied to building envelopes, constitute an option to tackle Urban Heat Island phenomenon, thanks to their capability to reflect the sunlight predominantly towards the solar incidence direction. RR coatings are obtained with the deposition of glass beads on traditional diffusive materials. During their lifetime, outdoor aging and soiling affect their optical behavior. In addition, without a proper protection, some glass beads could detach from the paint and disperse in the environment. Hence, a necessity arises for the application of a safeguarding stratum on RR materials to avert the separation of glass beads in RR coatings following the aging process. In this paper, five RR samples were produced, employing a highly reflective paint as foundation, RR glass beads and a protective layer. A diffusive sample, without glass beads, was made for comparison. Samples underwent spectrophotometric and angular distribution analyses. The effect of the protective layer on the optical behavior was assessed comparing the results with those obtained for the same RR materials without the protective layer. RR samples with a protective layer exhibit a higher reflectance with respect to the same RR sample without a protective layer. In the near-infrared (NIR) region, a lower reflectance occurs for all RR samples with a protective layer. A less concentrated angular distribution of the reflected light was observed for all RR samples with the addition of a protective layer.

Keywords: Cool materials; Directional materials; Retro-reflective materials; Smart optical coatings; Urban heat island.


Conflict of interest statement

The authors declare that they have no known competing financial interests or personal relationships that could have appeared to influence the work reported in this paper.

Figures

Fig. 1
Fig. 1
Picture of plaster samples characterized by the identical superficial density of glass beads and varying ranges in glass beads diameter. Samples are respectively: a) DIFF; b) RR φ1, ρs2; c) RR φ2, ρs2; d) RR φ3, ρs2; e) RR φ4, ρs2; f) RR φ5, ρs2.
Fig. 2
Fig. 2
An outside view of the PerkinElmer UV/Vis/NIR Spectrophotometer LAMBDA™ 1050+, with details of the integrating sphere compartment, the sample holder and the software interface.
Fig. 3
Fig. 3
Overview of the developed gonio-reflectometer.
Fig. 4
Fig. 4
Comparison between RR φ1, ρs2 sample without a protective layer (blue solid line) and RR φ1, ρs2 sample with a protective layer (orange solid line) in terms of average spectral reflectance over three measurements. (For interpretation of the references to color in this figure legend, the reader is referred to the Web version of this article.)
Fig. 5
Fig. 5
Comparison between RR φ2, ρs2 sample without a protective layer (blue solid line) and RR φ2, ρs2 sample with a protective layer (orange solid line) in terms of average spectral reflectance over three measurements. (For interpretation of the references to color in this figure legend, the reader is referred to the Web version of this article.)
Fig. 6
Fig. 6
Comparison between RR φ3, ρs2 sample without a protective layer (blue solid line) and RR φ3, ρs2 sample with a protective layer (orange solid line) in terms of average spectral reflectance over three measurements. (For interpretation of the references to color in this figure legend, the reader is referred to the Web version of this article.)
Fig. 7
Fig. 7
Comparison between RR φ4, ρs2 sample without a protective layer (blue solid line) and RR φ4, ρs2 sample with a protective layer (orange solid line) in terms of average spectral reflectance over three measurements. (For interpretation of the references to color in this figure legend, the reader is referred to the Web version of this article.)
Fig. 8
Fig. 8
Comparison between RR φ5, ρs2 sample without a protective layer (blue solid line) and RR φ5, ρs2 sample with a protective layer (orange solid line) in terms of average spectral reflectance over three measurements. (For interpretation of the references to color in this figure legend, the reader is referred to the Web version of this article.)
Fig. 9
Fig. 9
Comparison between DIFF sample without a protective layer (blue solid line) and DIFFsample with a protective layer (orange solid line) in terms of average spectral reflectance over three measurements. (For interpretation of the references to color in this figure legend, the reader is referred to the Web version of this article.)
Fig. 10
Fig. 10
Angulardistribution of RR φ1, ρs2 sample with (yellow line) and without a protective layer (grey line)- incident radiation angle equal to 0° (a) and −50° (b). (For interpretation of the references to color in this figure legend, the reader is referred to the Web version of this article.)
Fig. 11
Fig. 11
Angular distribution of RR φ2, ρs2 sample with (yellow line) and without a protective layer (grey line)- incident radiation angle equal to 0° (a) and −50° (b). (For interpretation of the references to color in this figure legend, the reader is referred to the Web version of this article.)
Fig. 12
Fig. 12
Angular distribution of RR φ3, ρs2 sample with (yellow line) and without a protective layer (grey line) - incident radiation angle equal to 0° (a) and −50° (b). (For interpretation of the references to color in this figure legend, the reader is referred to the Web version of this article.)
Fig. 13
Fig. 13
Angular distribution of RR φ4, ρs2 sample with (yellow line) and without a protective layer (grey line) - incident radiation angle equal to 0° (a) and −50° (b). (For interpretation of the references to color in this figure legend, the reader is referred to the Web version of this article.)
Fig. 14
Fig. 14
Angular distribution of RR φ5, ρs2 sample with (yellow line) and without a protective layer (grey line) - incident radiation angle equal to 0° (a) and −50° (b). (For interpretation of the references to color in this figure legend, the reader is referred to the Web version of this article.)
Fig. 15
Fig. 15
Angular distribution of DIFF sample with (yellow line) and without a protective layer (grey line) - incident radiation angle equal to 0° (a) and −50° (b). (For interpretation of the references to color in this figure legend, the reader is referred to the Web version of this article.)
Fig. 16
Fig. 16
Difference (Δ) values between the relative RR components with and without the protective layer for different angles of incidence.

References

    1. Santamouris M., editor. Energy and Climate in the Urban Built Environment. James and James Science Publishers; London: 2001. - DOI
    1. Rossi F., Anderini E., Castellani B., Nicolini A., Morini E. Integrated improvement of occupants' comfort in urban areas during outdoor events. Build. Environ. 2015;93:285–292.
    1. Li Y., Zhao X. An empirical study of the impact of human activity on long-term temperature change in China: a perspective from energy consumption. J. Geophys. Res. 2012;117(D17)
    1. Santamouris M., Cartalis C., Synnefa A., Kolokotsa D. On the impact of urban heat island and global warming on the power demand and electricity consumption of buildings −A review. Energy Build. 2015;98:119–124.
    1. Gao Z., Zaitchik B.F., Hou Y., Chen W. Toward park design optimization to mitigate the urban heat Island: assessment of the cooling effect in five U.S. cities. Sustain. Cities Soc. 2022;81

LinkOut - more resources