. 2024 Mar 12;24(6):1557-1572.
doi: 10.1039/d3lc00850a.

SliceChip: a benchtop fluidic platform for organotypic culture and serial assessment of human and rodent pancreatic slices

Affiliations

SliceChip: a benchtop fluidic platform for organotypic culture and serial assessment of human and rodent pancreatic slices

Charles G Alver et al. Lab Chip. .

Abstract

Enzymatically isolated pancreatic islets are the most commonly used ex vivo testbeds for diabetes research. Recently, precision-cut living slices of human pancreas are emerging as an exciting alternative because they maintain the complex architecture of the endocrine and exocrine tissues, and do not suffer from the mechanical and chemical stress of enzymatic isolation. We report a fluidic pancreatic SliceChip platform with dynamic environmental controls that generates a warm, oxygenated, and bubble-free fluidic pathway across singular immobilized slices with continuous deliver of fresh media and the ability to perform repeat serial perfusion assessments. A degasser ensures the system remains bubble-free while systemic pressurization with compressed oxygen ensures slice medium remains adequately oxygenated. Computational modeling of perfusion and oxygen dynamics within SliceChip guide the system's physiomimetic culture conditions. Maintenance of the physiological glucose dependent insulin secretion profile across repeat perfusion assessments of individual pancreatic slices kept under physiological oxygen levels demonstrated the culture capacity of our platform. Fluorescent images acquired every 4 hours of transgenic murine pancreatic slices were reliably stable and recoverable over a 5 day period due to the inclusion of a 3D-printed bioinert metallic anchor that maintained slice position within the SliceChip. Our slice on a chip platform has the potential to expand the useability of human pancreatic slices for diabetes pathogenesis and the development of new therapeutic approaches, while also enabling organotypic culture and assessment of other tissue slices such as brain and patient tumors.


Conflict of interest statement

The authors have no conflicts of interests to disclose.

Figures

Fig. 1
Fig. 1. Pancreatic SliceChip workflow. (A) Donor pancreas is acquired, and a section of tissue is removed from the pancreas. (B) The piece of pancreas is split into smaller pieces, cleaned, and suspended in an agarose solution. After the agarose solidifies, a biopsy punch is used to remove a 7 mm diameter cylinder. (C) A vibratome is used to section off a 120 μm thick, 7 mm diameter slice of the tissue cylinders. (D) Pancreatic slices are removed from the vibratome and moved into a culture dish prior to placement within SliceChip under, (E) a 3D printed stainless steel 316 L slice anchor. (F) Exploded and, (G) assembled view of pancreatic SliceChip show the system components, namely, [1] milled acrylic chip, [2] silicone gasket, [3] slice anchor within central culture well of 8 mm diameter, [4] fluidic inlet, [5] fluidic outlet. (H) A block diagram of the fluid pathway within the pancreatic SliceChip system shows the, [a] pressurized O2 and CO2 gas tanks that provide the pressure source for, [b] the Fluigent pressure pump, [c] heat bath that holds, [d] pressurized media reservoirs that contain basal media for long term culture as well as low glucose, high glucose and KCl solutions for GSIS assay, [e] in-line fluid switches for switching between solutions from [d]. Media exiting the reservoir is passed through, [f] a degasser and, [g] a debubbler to control oxygenation levels and eliminate large bubbles within the fluid lines. [h] Keyence fluorescent microscope fitted with a modified, [i] Tokai Hit incubation stage that maintains the temperature of the chip and limits environmental exposure holds, [j] the SliceChip that is clamped using a micronit clamp for long term culture, imaging, and functional assays. [k] Flow meters monitor the flow rate and act in a continuous feedback loop with the regulators to modulate pressure and ensure a consistent flow rate before, [l] effluent media is collected. (I) A picture of the actual SliceChip and fluidic control system with, (J) a closeup view of the incubation stage within the Keyence and, (K) a brightfield image of a human slice and anchor within the system as taken from the microscope.
Fig. 2
Fig. 2. Computational modeling of fluidic parameters. A computational model of SliceChip's fluidic parameters was developed in COMSOL. (A) Glucose washout time for various flowrates was empirically calculated in COMSOL to determine the time necessary for the chamber to match the input stimulant concentration. To ensure that fluid washed through the entire system, including external tubing, in under 3 minutes, a flow rate of 80 μl min−1 was selected. (B) The fluid velocity profile, flowrate = 80 μl min−1, is shown with a zoomed in region depicting the area around a modeled pancreatic slice, demarcated by a white dashed line. (C) The pressure profile of the system is shown. (D) The shear stress on the modeled slice is shown with views of the slice from the top looking down (pictured left), bottom looking up (pictured right), and side (pictured bottom).
Fig. 3
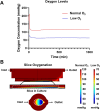
Fig. 3. Steady state SliceChip oxygenation. (A) Oxygen levels in media after passage through the degassing unit at 80 μl min−1 measured by a PreSense oxygen probe. To achieve Low O2 conditions, a standard degassing unit was used. To achieve normal O2 conditions of approximate standard culture levels at 120 mmHg, a degasser unit was modified to shorten the degassing pathway and increase the residual oxygen. (B) Oxygen levels within SliceChip, accounting for the oxygen consumption of a slice within the chip, are shown with a zoomed in region depicting the area around a modeled pancreatic slice, demarcated by a white dashed line. The inlet oxygen concentration does not impact the location or magnitude of the gradient. Oxygen levels decrease in the slice as you move from inlet to outlet, from top to bottom, and from outside to inside. The depicted gradient is computed as the equilibrium gradient of oxygen within the device throughout the course of the experiment.
Fig. 4
Fig. 4. Glucose stimulated insulin secretion testing (A) experimental timeline depicting the entire course of the experiment from procurement of slice to the terminal perfusion experiment with major events denoted on the day that they occur. Pancreas is procured on day −2; slices are generated on day −1; slices are rested in static culture on day 0; slices are moved into the SliceChip on day 1; GSIS perfusions occur on days 2 and 3; slices are rested on day 4; and a terminal GSIS perfusion with a KCl solution is conducted on day 5, at which point slices are removed from the SliceChip. (B) Experimental timeline for glucose stimulated insulin secretion experiments, occurring on days 2,3, and 5, with the addition of the terminal KCl perfusion that occurs only on experimental day 5. An initial stabilization period consists of a 60 minute interval of 3 mM G perfusion. Experimental perfusion consists of 30 minute intervals of perfusion with 3 mM G, 16.7 mM G, 3 mM G, carbachol, and 3 mM G, in that order. On day 5 an additional 30 minute interval is added to the end of experimentation, consisting of perfusion of a KCl solution. (C) Glucose stimulated insulin secretion time response curves on days 2, 3, and 5 of culture inside of SliceChip. Insulin secretions were normalized to the area of islets within the slice present on day 5, as assessed via insulin immunostaining. The green shading and lines represent the results of slices held under normal oxygen levels. The blue shading and lines represent those slices held under low oxygen levels. GSIS perfusion intervals are denoted as discussed in (B). For each oxygen condition, the solid line represents the average insulin secretion response, and the shaded area represents the total range of insulin secretion responses [day 2, 3, 5 n = 3 slices], (D) area under the curve (AUC) of GSIS curves on days 2, 3, and 5, where each data point is the sum of the insulin released during the corresponding perfusion interval, day, and flow condition, as shown in (C), demarcated by the perfusate during the interval. Each bar represents the average reported value for the flow condition with data points representing individual slices. The intervals shown for days 2 and 3 reflect the 0–60 minute interval of experimentation, stimulation by 3 mM and 16.7 mM glucose, as shown in (B). Day 5 AUC data includes the 0–60 minute interval of experimentation, stimulation by 3 mM and 16.7 mM glucose, with the addition of the terminal KCl interval of stimulation that occurs during the 150–180 minute interval, as shown in (B). Additionally, the AUC graphs shown in (D) include data from slices kept in a static culture with exposure to stimulants following the timeline laid out in (B) with samples taken at the end of each 30 minute static incubation interval [normal and low oxygen day 2, 3, 5 n = 3 slices, static n = 2 slices].
Fig. 5
Fig. 5. Live dead imaging. (A) In the left-most image, a whole slice from each experimental condition is depicted with a red arrow depicting the direction of flow across the slice and a white box highlighting a representative region for live/dead imaging. Scale bars represent 400 μm. The next four images from left to right are representative images of tissue viability after 5 days inside of the SliceChip, depicting brightfield (BF), live (green) regions, dead (red) regions, and a composite of live/dead on the brightfield image of the slice. The intra-slice white areas of the BF images depict pancreatic ducts within the slice and are consistent with traditional slice imaging. Scale bars represent 100 μm. Live/dead imaging of slices was completed with slices held in a 35 mm dish with a number-zero confocal grade crystal (MatTek Corporation, Ashland, MA, Cat# P35G-0-10-C) (B) quantitative data for live/dead analysis, in which viability is reported as the percentage of live cell area to the total cell area (live + dead). Each bar represents the average reported value for the flow condition with data points representing individual slices. Analysis of variance demonstrated no significance between the viability of each of the conditions (n = 3 slices for each condition). Each pancreatic slice analyzed underwent GSIS perfusions consisting of 30 minute intervals of perfusion with 3 mM G, 16.7 mM G, 3 mM G, carbachol, and 3 mM G, in that order.
Fig. 6
Fig. 6. Fluorescent imaging. (A) A representative slice held under normal oxygen conditions with fluorescent imaging of immunostains depicting DAPI (4′,6-diamidino-2-phenylindole Thermo Fisher/Life Technologies, Waltham, MA, Cat# D1306) (top left), glucagon (Monoclonal Mouse anti-glucagon, R&D Systems, Cat# MAB1249) (top right), amylase (Polyclonal Rabbit anti-amylase, Sigma Aldrich, Cat# A8273) (bottom left), and insulin (Ready to Use Polycolonal Guinea Pig anti-insulin, DAKO, Cat# IR002) (bottom right). Each image is the full-focus composite from a Z-stack taken of an individual slice. Scale bars represent 1 mm. A composite image of each stain is shown enlarged on the far right. Scale bar represents 500 μm. (B) Total islet area within individual slices, where each bar represents the average reported value for the flow condition with data points representing individual slices. More slices were used in static cultures because each static culture consisted of 2–3 slices whereas each SliceChip condition ran 1 slice at a time. Analysis of variance demonstrated no significant difference between the total islet areas between slices, although this does not inform any meaning to the insulin secretion function of individual islets within a slice or the viability of the entire pancreatic slice (normal and low oxygen flow n = 3 slices, static n = 5 slices) (C) composite Z-stack fluorescent imaging of murine slices within the SliceChip. Murine slices were isolated from the mouse, sectioned and sliced on day 0, and rested until placement within the SliceChip on day 1. All murine slices were continuously perfused with murine medium at 80 μl min−1, under the normal oxygen condition, and no experimental GSIS stimulations were done. The image is composed of brightfield (depicting the tissue structure and slice anchor), EGFP (depicting insulin-producing cells), and tdTomato (depicting all non-insulin-producing cells). Images were taken every 4 hours, and images from the culture on days 1,3, and 5 are shown in order from left to right. An isolated region depicting an islet is shown at an increased magnification below. The top row scale bars represent 2 mm and the bottom row scale bars represent 500 μm. The red arrows denote the direction of flow across the slice. (D) Graph depicting the decrease in fluorescent area of slices imaged within the SliceChip with a trendline fit via linear regression analysis constrained to an area of 1 at onset of imaging. Exposure parameters for each data set are shown as the amount of time that slices were exposed per imaging period. 19 minute exposure: exposed for 19 minutes, imaged every 4 hours; 46 minute exposure: exposed for 46 minutes, imaged every 12 hours; 76 minute exposure: exposed for 76 minutes, imaged every 12 hours. The discrepancy in imaging intervals and the number of imaging days was necessary due to limits on the maximum number of images able to be taken in a continuous timelapse session on the Keyence microscope. Exposure time within imaging intervals was altered by changing the step size of the Z-stack. Linear regression parameters: [19 minute exposure] Y = −0.02865 × X + 1.029, goodness of fit = 0.002045, slope P value = <0.0001; [46 minute exposure] Y = −0.05514 × X + 1.055, goodness of fit = 0.04177, slope P value = 0.0045; [76 minute exposure] Y = −0.1028 × X + 1.103, goodness of fit = 0.05500, slope P value = 0.0010. For each exposure condition, n = 1.

References

    1. Kaddis J. S. Olack B. J. Sowinski J. Cravens J. Contreras J. L. Niland J. C. JAMA. 2009;301:1580–1587. doi: 10.1001/jama.2009.482. - DOI - PMC - PubMed
    1. Hart N. J. Powers A. C. Diabetologia. 2019;62:212–222. doi: 10.1007/s00125-018-4772-2. - DOI - PMC - PubMed
    1. Foster T. P. Bruggeman B. Campbell-Thompson M. Atkinson M. A. Haller M. J. Schatz D. A. Endocr. Pract. 2020;26:1505–1513. doi: 10.4158/EP-2020-0295. - DOI - PMC - PubMed
    1. Prasanna Kumar H. R. Gowdappa H. B. Hosmani T. Urs T. Indian J. Endocrinol. Metab. 2018;22:121–125. doi: 10.4103/ijem.IJEM_139_17. - DOI - PMC - PubMed
    1. Marciniak A. Selck C. Friedrich B. Speier S. PLoS One. 2013;8:e78706. doi: 10.1371/journal.pone.0078706. - DOI - PMC - PubMed

Publication types