. 2024 Mar 4;23(3):257-271.
doi: 10.1158/1535-7163.MCT-23-0287.

Raludotatug Deruxtecan, a CDH6-Targeting Antibody-Drug Conjugate with a DNA Topoisomerase I Inhibitor DXd, Is Efficacious in Human Ovarian and Kidney Cancer Models

Affiliations

Raludotatug Deruxtecan, a CDH6-Targeting Antibody-Drug Conjugate with a DNA Topoisomerase I Inhibitor DXd, Is Efficacious in Human Ovarian and Kidney Cancer Models

Hirokazu Suzuki et al. Mol Cancer Ther. .

Abstract

Cadherin-6 (CDH6) is expressed in several cancer types, but no CDH6-targeted therapy is currently clinically available. Here, we generated raludotatug deruxtecan (R-DXd; DS-6000), a novel CDH6-targeting antibody-drug conjugate with a potent DNA topoisomerase I inhibitor, and evaluated its properties, pharmacologic activities, and safety profile. In vitro pharmacologic activities and the mechanisms of action of R-DXd were assessed in serous-type ovarian cancer and renal cell carcinoma cell lines. In vivo pharmacologic activities were evaluated with several human cancer cell lines and patient-derived xenograft mouse models. The safety profile in cynomolgus monkeys was also assessed. R-DXd exhibited CDH6 expression-dependent cell growth-inhibitory activity and induced tumor regression in xenograft models. In this process, R-DXd specifically bound to CDH6, was internalized into cancer cells, and then translocated to the lysosome. The DXd released from R-DXd induced the phosphorylation of Chk1, a DNA damage marker, and cleaved caspase-3, an apoptosis marker, in cancer cells. It was also confirmed that the DXd payload had a bystander effect, passing through the cell membrane and impacting surrounding cells. The safety profile of R-DXd was favorable and the highest non-severely toxic dose was 30 mg/kg in cynomolgus monkeys. R-DXd demonstrated potent antitumor activity against CDH6-expressing tumors in mice and an acceptable safety profile in monkeys. These findings indicate the potential of R-DXd as a new treatment option for patients with CDH6-expressing serous-type ovarian cancer and renal cell carcinoma in a clinical setting.


Figures

None
Graphical abstract
Figure 1. Structure and CDH6-specific activity of R-DXd. A, Schematic structure of R-DXd. B, Conjugated drug distribution by hydrophobic interaction chromatography. C, In vitro stability of R-DXd in plasma of each animal species and PBS + 1% BSA. D, Binding activity of R-DXd against human CDH family proteins. Recombinant proteins were incubated with R-DXd or control ADC, and bound antibodies were measured by ELISA. Each value represents the mean and SD of triplicate experiments. E and F, Cell growth-inhibitory activity of R-DXd. Cells were treated with R-DXd, naked CDH6 Ab, or control ADC at the indicated concentrations for 6 days. Each value represents the mean and SD of triplicate or quadruplicate experiments. G, NIH:OVCAR-3 cells (WT) and KO-OVCAR-3 cells (KO) treated with 10 ng/mL R-DXd for 6, 8, or 10 days under coculture conditions. After treatment, cell viability in the lower chamber was assessed. Each value represents the mean and SD of triplicate experiments. White bar: KO-OVCAR-3 in both chambers. Orange bar: NIH:OVCAR-3 in the upper chamber and KO-OVCAR-3 in the lower chamber. Black bar: medium only in the upper chamber and NIH:OVCAR-3 in the lower chamber. H, DNA damage and apoptosis induced by R-DXd. After treatment of PA-1 cells with R-DXd (3 μg/mL), DXd (10 nmol/L), naked CDH6 Ab (3 μg/mL), and control ADC (3 μg/mL) for 3 days, cleaved caspase-3, phosphorylated Chk1, total Chk1, and β-actin were detected by the simple western system.
Figure 1.
Structure and CDH6-specific activity of R-DXd. A, Schematic structure of R-DXd. B, Conjugated drug distribution by hydrophobic interaction chromatography. C,In vitro stability of R-DXd in plasma of each animal species and PBS + 1% BSA. D, Binding activity of R-DXd against human CDH family proteins. Recombinant proteins were incubated with R-DXd or control ADC, and bound antibodies were measured by ELISA. Each value represents the mean and SD of triplicate experiments. E and F, Cell growth-inhibitory activity of R-DXd. Cells were treated with R-DXd, naked CDH6 Ab, or control ADC at the indicated concentrations for 6 days. Each value represents the mean and SD of triplicate or quadruplicate experiments. G, NIH:OVCAR-3 cells (WT) and KO-OVCAR-3 cells (KO) treated with 10 ng/mL R-DXd for 6, 8, or 10 days under coculture conditions. After treatment, cell viability in the lower chamber was assessed. Each value represents the mean and SD of triplicate experiments. White bar: KO-OVCAR-3 in both chambers. Orange bar: NIH:OVCAR-3 in the upper chamber and KO-OVCAR-3 in the lower chamber. Black bar: medium only in the upper chamber and NIH:OVCAR-3 in the lower chamber. H, DNA damage and apoptosis induced by R-DXd. After treatment of PA-1 cells with R-DXd (3 μg/mL), DXd (10 nmol/L), naked CDH6 Ab (3 μg/mL), and control ADC (3 μg/mL) for 3 days, cleaved caspase-3, phosphorylated Chk1, total Chk1, and β-actin were detected by the simple western system.
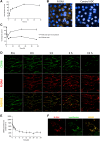
Figure 2. Intracellular trafficking of R-DXd and CDH6. A, Internalization rate of R-DXd in NIH:OVCAR-3 cells. Each value represents the mean and SD of quadruplicate experiments. B, Lysosomal trafficking of R-DXd. NIH:OVCAR-3 cells were treated with pHrodo-labeled R-DXd and Control ADC for 24 hours. pHrodo (orange) works as an acidic pH sensor, allowing discrimination of stages in the endocytosis pathway from early endosome to lysosome. Cells were counterstained with Hoechst 33342 (blue, nuclei). C, CDH6 expression on the cell membrane after R-DXd treatment with/without R-DXd washout. Each value represents the mean and SD of quadruplicate experiments. D, Live-cell imaging of CHO-K1 cells stably expressing human CDH6-eGFP (green) treated with Alexa Fluor 594-conjugated R-DXd (red). E, Quantitative analysis of the live-cell imaging (D). CDH6 area per cell was measured up to 24 hours. Each value represents the mean and SD of triplicate experiments. F, Colocalization of Alexa Fluor 594-conjugated R-DXd (red) and lysosome (stained with LysoTracker; green). The snapshot image was obtained during the live-cell imaging (D) at 15 hours.
Figure 2.
Intracellular trafficking of R-DXd and CDH6. A, Internalization rate of R-DXd in NIH:OVCAR-3 cells. Each value represents the mean and SD of quadruplicate experiments. B, Lysosomal trafficking of R-DXd. NIH:OVCAR-3 cells were treated with pHrodo-labeled R-DXd and Control ADC for 24 hours. pHrodo (orange) works as an acidic pH sensor, allowing discrimination of stages in the endocytosis pathway from early endosome to lysosome. Cells were counterstained with Hoechst 33342 (blue, nuclei). C, CDH6 expression on the cell membrane after R-DXd treatment with/without R-DXd washout. Each value represents the mean and SD of quadruplicate experiments. D, Live-cell imaging of CHO-K1 cells stably expressing human CDH6-eGFP (green) treated with Alexa Fluor 594-conjugated R-DXd (red). E, Quantitative analysis of the live-cell imaging (D). CDH6 area per cell was measured up to 24 hours. Each value represents the mean and SD of triplicate experiments. F, Colocalization of Alexa Fluor 594-conjugated R-DXd (red) and lysosome (stained with LysoTracker; green). The snapshot image was obtained during the live-cell imaging (D) at 15 hours.
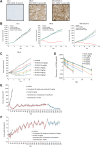
Figure 3. Antitumor activity of R-DXd in CDX models. A, CDH6 IHC in ES-2, 786-O, and NIH:OVCAR-3 xenografted tumors. Scale bar, 100 μm. B, Antitumor activity of R-DXd, Control ADC, and Naked CDH6 Ab in ES-2, 786-O, and NIH:OVCAR-3 xenograft models. The tumor-bearing mice were intravenously administered R-DXd, control ADC, or naked CDH6 Ab at 3 or 10 mg/kg on day 0. Each value represents the mean and SE (ES-2 and NIH:OVCAR-3: N = 6; 786-O: N = 10). C, Dose-dependent antitumor activity in the 786-O xenograft model. The tumor-bearing mice were intravenously administered R-DXd on day 0. Each value represents the mean and SE (N = 10). D, Pharmacokinetics of R-DXd in mice. R-DXd was intravenously administered to mice at doses of 0.25, 0.5, 1, 2, 4, and 8 mg/kg. Plasma concentrations of R-DXd were determined by ligand-binding assay and plotted. Each value represents the mean and SD (N = 3). LLOQ: 0.01 μg/mL. E and F, Antitumor activity (E) and body weight change (F) of R-DXd after long-term treatment of carboplatin and paclitaxel in NIH:OVCAR-3 xenograft model. After nine administrations of 50 mg/kg carboplatin and 30 mg/kg paclitaxel (red triangles), mice whose estimated tumor volumes were within the range of 150 mm3 to 500 mm3 were selected and administered 10 mg/kg R-DXd (blue triangles). Each value represents the mean and SE (vehicle group: N = 6; treatment group: N = 5).
Figure 3.
Antitumor activity of R-DXd in CDX models. A, CDH6 IHC in ES-2, 786-O, and NIH:OVCAR-3 xenografted tumors. Scale bar, 100 μm. B, Antitumor activity of R-DXd, Control ADC, and Naked CDH6 Ab in ES-2, 786-O, and NIH:OVCAR-3 xenograft models. The tumor-bearing mice were intravenously administered R-DXd, control ADC, or naked CDH6 Ab at 3 or 10 mg/kg on day 0. Each value represents the mean and SE (ES-2 and NIH:OVCAR-3: N = 6; 786-O: N = 10). C, Dose-dependent antitumor activity in the 786-O xenograft model. The tumor-bearing mice were intravenously administered R-DXd on day 0. Each value represents the mean and SE (N = 10). D, Pharmacokinetics of R-DXd in mice. R-DXd was intravenously administered to mice at doses of 0.25, 0.5, 1, 2, 4, and 8 mg/kg. Plasma concentrations of R-DXd were determined by ligand-binding assay and plotted. Each value represents the mean and SD (N = 3). LLOQ: 0.01 μg/mL. E and F, Antitumor activity (E) and body weight change (F) of R-DXd after long-term treatment of carboplatin and paclitaxel in NIH:OVCAR-3 xenograft model. After nine administrations of 50 mg/kg carboplatin and 30 mg/kg paclitaxel (red triangles), mice whose estimated tumor volumes were within the range of 150 mm3 to 500 mm3 were selected and administered 10 mg/kg R-DXd (blue triangles). Each value represents the mean and SE (vehicle group: N = 6; treatment group: N = 5).
Figure 4. Antitumor activity of R-DXd in PDX models. A, CDH6 IHC in PDX models. Scale bar, 100 μm. B, Antitumor activity of R-DXd against OVC PDX models (CTG-0258, 0703, and 0711) and RCC PDX models (CTG-1370 and 1366). Vehicle and R-DXd were intravenously administered on days 0 and 21. Each value represents the mean and SE (N = 8).
Figure 4.
Antitumor activity of R-DXd in PDX models. A, CDH6 IHC in PDX models. Scale bar, 100 μm. B, Antitumor activity of R-DXd against OVC PDX models (CTG-0258, 0703, and 0711) and RCC PDX models (CTG-1370 and 1366). Vehicle and R-DXd were intravenously administered on days 0 and 21. Each value represents the mean and SE (N = 8).
Figure 5. sCDH6 expression and impact on R-DXd efficacy. A, Concentration of sCDH6 in heparin-treated plasma from healthy subjects, OVC patients, and RCC patients (N = 5). B, Activity of R-DXd against tumors with/without sCDH6 expression. Antitumor effect was examined in mouse models with PA-1 and sCDH6-PA-1 (left), and JHOC-5 and sCDH6-JHOC-5 (right). Each value represents the mean and SE (N = 6). C, Concentration of sCDH6 in plasma at the time of grouping of sCDH6-PA-1 and sCDH6-JHOC-5 xenografted mice. Each value represents the mean and SD (N = 6).
Figure 5.
sCDH6 expression and impact on R-DXd efficacy. A, Concentration of sCDH6 in heparin-treated plasma from healthy subjects, OVC patients, and RCC patients (N = 5). B, Activity of R-DXd against tumors with/without sCDH6 expression. Antitumor effect was examined in mouse models with PA-1 and sCDH6-PA-1 (left), and JHOC-5 and sCDH6-JHOC-5 (right). Each value represents the mean and SE (N = 6). C, Concentration of sCDH6 in plasma at the time of grouping of sCDH6-PA-1 and sCDH6-JHOC-5 xenografted mice. Each value represents the mean and SD (N = 6).

References

    1. Shimoyama Y, Gotoh M, Terasaki T, Kitajima M, Hirohashi S. Isolation and sequence analysis of human cadherin-6 complementary DNA for the full coding sequence and its expression in human carcinoma cells. Cancer Res 1995;55:2206–11. - PubMed
    1. Inoue T, Chisaka O, Matsunami H, Takeichi M. Cadherin-6 expression transiently delineates specific rhombomeres, other neural tube subdivisions, and neural crest subpopulations in mouse embryos. Dev Biol 1997;183:183–94. - PubMed
    1. Osterhout JA, Josten N, Yamada J, Pan F, Wu SW, Nguyen PL, et al. . Cadherin-6 mediates axon-target matching in a non-image-forming visual circuit. Neuron 2011;71:632–9. - PMC - PubMed
    1. Cho EA, Patterson LT, Brookhiser WT, Mah S, Kintner C, Dressler GR. Differential expression and function of cadherin-6 during renal epithelium development. Development 1998;125:803–12. - PubMed
    1. Mah SP, Saueressig H, Goulding M, Kintner C, Dressler GR. Kidney development in cadherin-6 mutants: delayed mesenchyme-to-epithelial conversion and loss of nephrons. Dev Biol 2000;223:38–53. - PubMed