. 2024 Mar;23(3):e14076.
doi: 10.1111/acel.14076. Epub 2024 Jan 11.

Cell type-specific regulation of m6 A modified RNAs in the aging Drosophila brain

Affiliations

Cell type-specific regulation of m6 A modified RNAs in the aging Drosophila brain

Alexandra E Perlegos et al. Aging Cell. 2024 Mar.

Abstract

The aging brain is highly vulnerable to cellular stress, and neurons employ numerous mechanisms to combat neurotoxic proteins and promote healthy brain aging. The RNA modification m6 A is highly enriched in the Drosophila brain and is critical for the acute heat stress response of the brain. Here we examine m6 A in the fly brain with the chronic stresses of aging and degenerative disease. m6 A levels dynamically increased with both age and disease in the brain, marking integral neuronal identity and signaling pathway transcripts that decline in level with age and disease. Unexpectedly, there is opposing impact of m6 A transcripts in neurons versus glia, which conferred different outcomes on animal health span upon Mettl3 knockdown to reduce m6 A: whereas Mettl3 function is normally beneficial to neurons, it is deleterious to glia. Moreover, knockdown of Mettl3 in glial tauopathy reduced tau pathology and increased animal survival. These findings provide mechanistic insight into regulation of m6 A modified transcripts with age and disease, highlighting an overall beneficial function of Mettl3 in neurons in response to chronic stresses, versus a deleterious impact in glia.

Keywords: Drosophila; Alzheimer's disease; aging; epitranscriptomics; m6A; neurodegeneration.


Conflict of interest statement

Authors declare no competing interests.

Figures

FIGURE 1
FIGURE 1
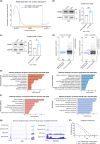
m6A increases in the 5' UTR in the brain with age. (a) Normalized read coverage plot of m6A‐IP/input on polyA+ transcripts across the 5' UTR, CDS, and 3' UTR of Mettl3‐dependent transcripts. m6A‐IP sequencing in 5d and 34d conditions from control RNAi and Mettl3 RNAi fly heads (daGal4 > mCherry RNAi; daGal4 > Mettl3 RNAi). Mettl3 RNAi samples show a loss of m6A primarily in the 5' UTR. (b) Transcript location of Mettl3‐dependent m6A at 5d and 34d. m6A transcripts at 5d and 34d show a 93% overlap. (c) Protein levels of Mettl3 with aged brains (5d vs. 34d), **p < 0.01, p = 0.0024, Student's t‐test. (d) Protein levels of Ythdc1 with aged brains (5d vs. 34d), ***p < 0.001, p = 0.0007, Student's t‐test. (e) Plot of significantly differentially expressed genes p adj < 0.05 of control (w 1118 ) brains with age (50d vs. 3d). Positive logFC indicates an increase in transcript level with age. Mettl3‐dependent m6A transcripts (red), all other non‐m6A transcripts (black), transcripts with increased 5' UTR m6A with age (purple). (f) GO and KEGG pathway enrichment of transcripts with increased 5' UTR m6A methylation with age (34d vs. 5d). (g) Heat map of m6A enrichment on signaling pathway (KEGG) transcripts with increased 5' UTR m6A with age. Shown are Control RNAi and Mettl3 RNAi m6A enrichment in 5d and 34d conditions. m6A enrichment presented as log (m6A‐IP divided by the input control). Heat map displays z‐score values scaled by row, with each gene relative to itself and relative across all six boxes. Segmented into 5' UTR, CDS, and 3' UTR. (h) Genome browser tracks of m6A locations for example genes dally and wg at 5d and 34d time points from control and Mettl3 RNAi.
FIGURE 2
FIGURE 2
Alzheimer's disease model shows increased 5' UTR m6A. (a) Normalized read coverage plot of m6A‐IP/input on polyA+ transcripts in the 5' UTR, CDS, and 3' UTR of m6A transcripts. m6A‐IP sequencing in control (6d) and Aβ42 (6d) conditions. (elav C155Gal4 > UAS‐mCD8‐GFP; elav C155Gal4 > UAS‐Aβ42). Aβ42 head samples show an increase of m6A primarily in the 5' UTR. (b) Protein levels of Mettl3 in Aβ42 brains, **p < 0.01, p = 0.0042, Student's t‐test. (c) Protein levels of Ythdc1 in Aβ42 brains, *p < 0.05, p = 0.0355, Student's t‐test. (d) RNA seq from 6d brains of elav C155Gal4 > UAS‐mCD8‐GFP and elav C155Gal4 > UAS‐Aβ42. Plot of significantly differentially expressed genes of control versus Aβ42 brains. Positive logFC indicates an increase in transcript level with Aβ42 expression. m6A transcripts (blue), m6A genes with 5' UTR increased peaks (purple), all other differentially expressed genes (black). (e) Left: Pathway analysis of all genes downregulated in UAS‐Aβ42 brains. Right: Pathway analysis of all genes upregulated in UAS‐Aβ42 brains. (f) Left: Pathway analysis of all genes downregulated in UAS‐Aβ42 brains with increased 5' UTR m6A. Right: Pathway analysis of all genes upregulated in UAS‐Aβ42 brains with increased 5' UTR m6A. (g) Example genome browser tracks of increased 5' UTR m6A locations for genes Hsp70Aa and Egfr from control and UAS‐Aβ42. (h) Lifespan of animals expressing control RNAi or Mettl3 RNAi in neurons (elav C155Gal4 > mCherry RNAi vs. elav C155Gal4 > Mettl3 RNAi). 29°C, n = 156, n = 156, ****p < 0.0001, Log‐rank test.
FIGURE 3
FIGURE 3
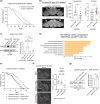
Reduction of m6A methyltransferase Mettl3 in neurons decreased lifespan. (a) Lifespan of animals expressing control RNAi or Mettl3 RNAi in neurons (elav3AGal4 > mCherry RNAi vs. elav3AGal4 > Mettl3 RNAi). 25°C, n = 100, n = 100, ****p < 0.0001, Log‐rank test. (b) Paraffin sectioning of brains at 30d. Brain vacuoles highlighted by red arrows. Quantification of total vacuole area per brain calculated across 10 sections per brain, n = 12 brains. *p < 0.05, t‐test, p = 0.0337. Negative geotaxis assay to measure climbing ability at 30d. n = 20 flies. **p < 0.01, t‐test, p = 0.0064. (c) γH2Av levels in brain tissue, with age and Mettl3 knockdown in neurons 5d versus 34d. (elav3AGal4 > mCherry RNAi; elav3AGal4 > Mettl3 RNAi). N = 10 brains per replicate, 3 biological replicates. *p < 0.05, **p < 0.01, ***p < 0.001, ns = not significant, One‐way ANOVA, p = 0.0392, p = 0.0004, p = 0.0174, p = 0.0065. (d) Lifespan of animals expressing control RNAi, Ythdc1 RNAi or Mettl3 RNAi in neurons (29°C). n = 120, n = 120, n = 120 ****p < 0.0001, Log‐rank test. (e) Levels of γH2Av in brain tissue with Ythdc1 knockdown in neurons 34d, *p < 0.05, t‐test, p = 0.0123. (f) Differentially expressed transcripts of elav3AGFP+ cells 34d versus 5d. Red are m6A transcripts, black all other transcripts. p adj < 0.05. (g) Differential expression of repoGFP+ (Glial) cells versus repoGFP‐ (neuronal) cells at 5d (left) and 34d (right). Blue are m6A transcripts, black all other transcripts. Transcripts more highly expressed in repoGFP+ cells are considered glial enriched. (h) Comparison of glial‐enriched m6A transcripts (top) and neural‐enriched m6A transcripts (bottom) to the whole brain aging transcriptome 3d versus 50d (see Figure 1).
FIGURE 4
FIGURE 4
Reduction of Mettl3 in glia increased lifespan. (a) Lifespan curve of animals expressing control RNAi or Mettl3 RNAi in glia. (repoGal4 > mCherry RNAi versus repoGal4 > Mettl3 RNAi). n = 100, n = 100, ****p < 0.0001, Log‐rank test. (b) Paraffin sectioning of brains at 30d. Brain vacuoles highlighted with red arrows. Quantification of total vacuole area per brain calculated across 10 sections per brain. n = 12 brains, *p < 0.05, t‐test, p = 0.0295. Negative geotaxis assay to measure climbing ability for each genotype at 30d. n = 20 flies, *p < 0.05, t‐test, p = 0.011. (c) Levels of γH2Av in brain tissue with age and Mettl3 knockdown in glial cells (5d vs. 34d). (repoGal4 > mCherry RNAi; repoGal4 > Mettl3 RNAi). n = 10 brains per replicate, 3 biological replicates. *p < 0.05, **p < 0.01, ns = not significant, One‐way ANOVA, p = 0.0085, p = 0.0073, p = 0.0436. (d) GO analysis of upregulated genes in Mettl3 RNAi repoGFP+ cells versus mCherry RNAi cells at 34d. Differentially expressed transcripts of repoGFP+ cells p adj < 0.05. (repoGFP+ > mCherry RNAi versus repoGFP+ > Mettl3 RNAi). (e) Lifespan of animals expressing human wild type tau (0N4R) in glial cells repoGS > UAS‐tau(0N4R) with control (BL5905), mCherry RNAi, or Mettl3 RNAi. Lifespan carried out at 29°C. n = 80, n = 83, n = 81, ****p < 0.0001, Log‐rank test. No significance (ns) between BL5905 and mCherry RNAi p = 0.0778. (f) Paraffin immunostaining of AT100 tau phosphorylation in brains, 25d. Quantification of puncta from the same 100 mm2 region of all brain sections, n = 11 brains per genotype, ****p < 0.0001, **p < 0.01, ns = not significant, One‐way ANOVA, p < 0.0001, p = 0.0013. (g) Levels of GSK‐3β (Ser9) phosphorylation with repoGS > UAS‐tau(0N4R) brains in control versus Mettl3 knockdown, n = 10 brains per replicate, 3 biological replicates, *p < 0.05, t‐test, p = 0.0166.
FIGURE 5
FIGURE 5
Translational profiling from neurons and glia with age and Mettl3 RNAi. Translational efficiency determined from TRAP assay with Mettl3 knockdown in (a, b) neurons. (elav3AGal4 > UAS‐RpL3‐FLAG × mCherry RNAi vs. Mettl3 RNAi) and (c, d) glia (repoGal4 > UAS‐RpL3‐FLAG × mCherry RNAi vs. Mettl3 RNAi) for in all expressed genes versus m6A modified transcripts.
FIGURE 6
FIGURE 6
m6A regulation in the brain with age and disease. Model of m6A regulation in the brain with aging. Top: m6A levels increase with age and in the brains of animals expressing human Aβ42 in neurons. m6A transcripts were mostly downregulated with age and with disease, and are enriched for neurogenesis and signaling pathways. Bottom: Knockdown of Mettl3 in neurons decreases lifespan and health span, increases translation efficiency of m6A transcripts, and increases DNA damage. These data suggest Mettl3 function is normally protective to neurons. Knockdown of Mettl3 in glia promotes lifespan and health span, and decreases translation efficiency of m6A modified transcripts. Mettl3 knockdown in glial cells also extends lifespan of animals expressing human tau, and mitigates tau phosphorylation pathology. These data indicate that Mettl3 activity is normally deleterious to glial function.

Similar articles

Cited by

References

    1. Anders, M. , Chelysheva, I. , Goebel, I. , Trenkner, T. , Zhou, J. , Mao, Y. , Verzini, S. , Qian, S. B. , & Ignatova, Z. (2018). Dynamic m6A methylation facilitates mRNA triaging to stress granules. Life Science Alliance, 1, e201800113. - PMC - PubMed
    1. Bellenguez, C. , Küçükali, F. , Jansen, I. E. , Kleineidam, L. , Moreno‐Grau, S. , Amin, N. , Naj, A. C. , Campos‐Martin, R. , Grenier‐Boley, B. , Andrade, V. , Holmans, P. A. , Boland, A. , Damotte, V. , van der Lee, S. J. , Costa, M. R. , Kuulasmaa, T. , Yang, Q. , de Rojas, I. , Bis, J. C. , … Lambert, J. C. (2022). New insights into the genetic etiology of Alzheimer's disease and related dementias. Nature Genetics, 54, 412–436. - PMC - PubMed
    1. Berry, R. W. , Quinn, B. , Johnson, N. , Cochran, E. J. , Ghoshal, N. , & Binder, L. I. (2001). Pathological glial tau accumulations in neurodegenerative disease: Review and case report. Neurochemistry International, 39, 469–479. - PubMed
    1. Bolukbasi, E. , Woodling, N. S. , Ivanov, D. K. , Adcott, J. , Foley, A. , Rajasingam, A. , Gittings, L. M. , Aleyakpo, B. , Niccoli, T. , Thornton, J. M. , & Partridge, L. (2021). Cell type‐specific modulation of healthspan by Forkhead family transcription factors in the nervous system. Proceedings of the National Academy of Sciences, 118, e2011491118. - PMC - PubMed
    1. Bonini, N. M. (2002). Chaperoning brain degeneration. Proceedings of the National Academy of Sciences of the United States of America, 99(Suppl 4), 16407–16411. - PMC - PubMed

Publication types