. 2024 Feb 1;151(3):dev200981.
doi: 10.1242/dev.200981. Epub 2024 Feb 5.

Control of successive unequal cell divisions by neural cell fate regulators determines embryonic neuroblast cell size

Affiliations

Control of successive unequal cell divisions by neural cell fate regulators determines embryonic neuroblast cell size

Thomas W Mullan et al. Development. .

Abstract

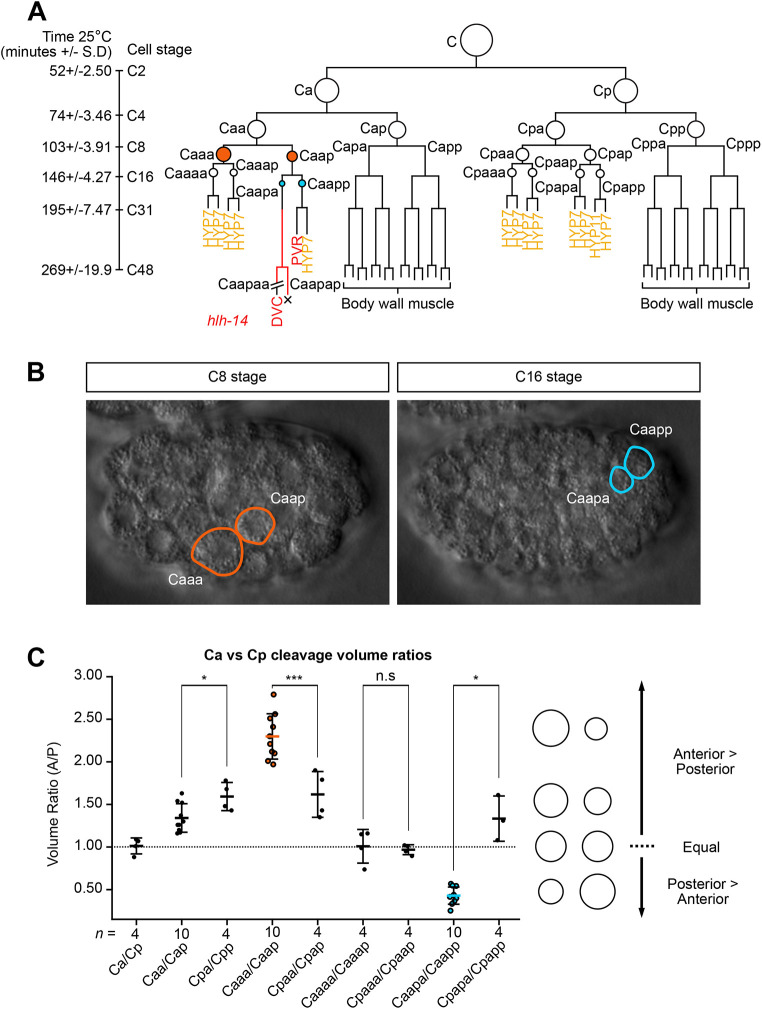
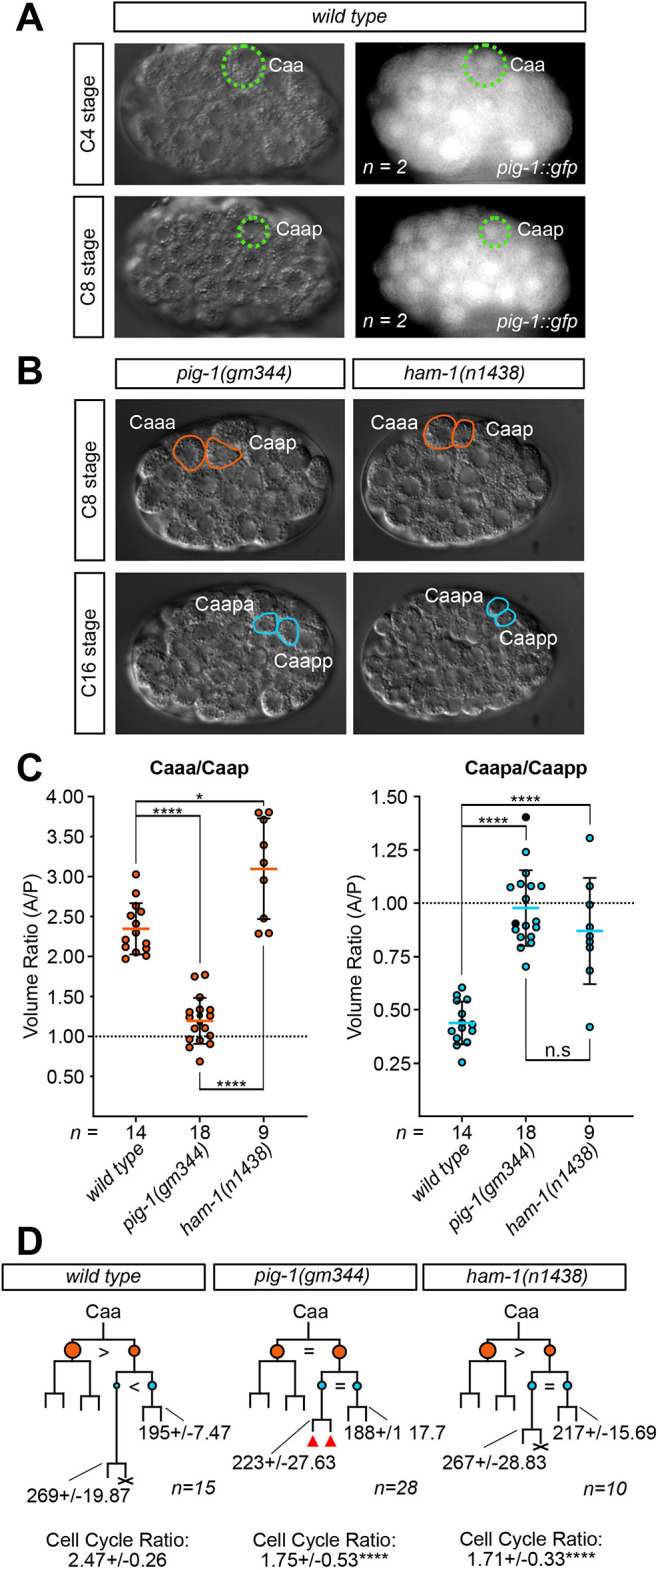
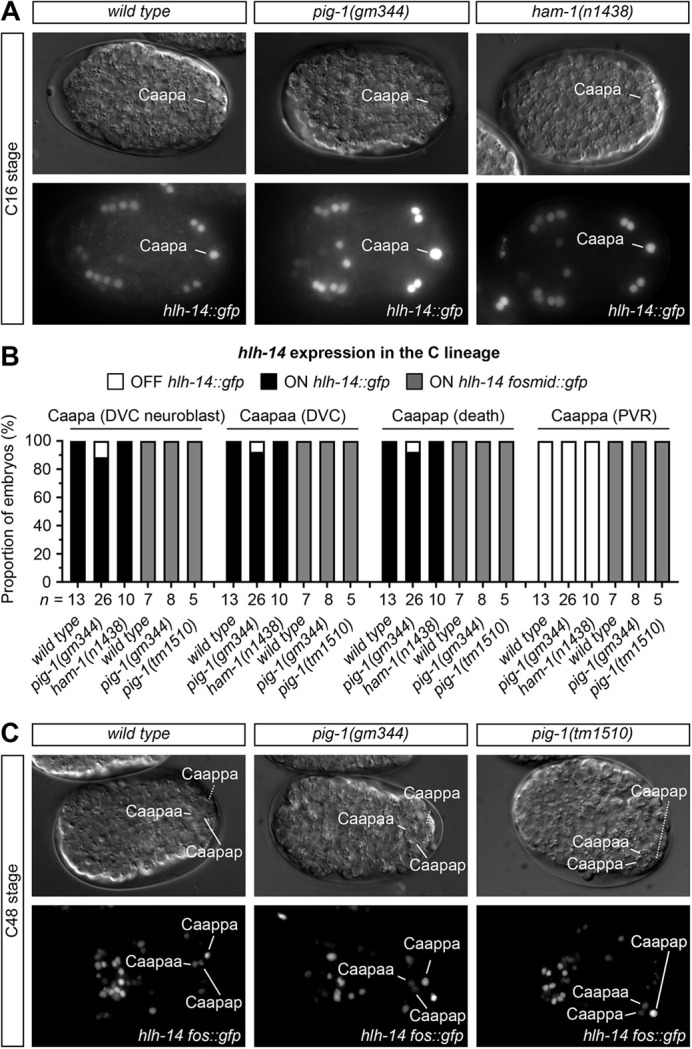
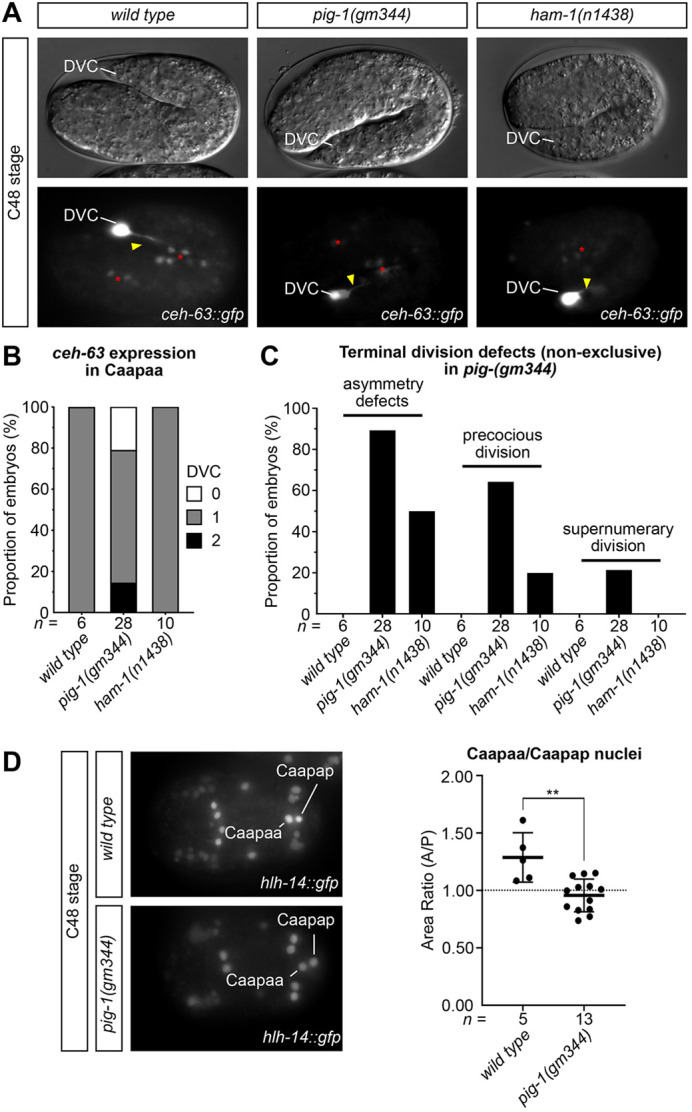
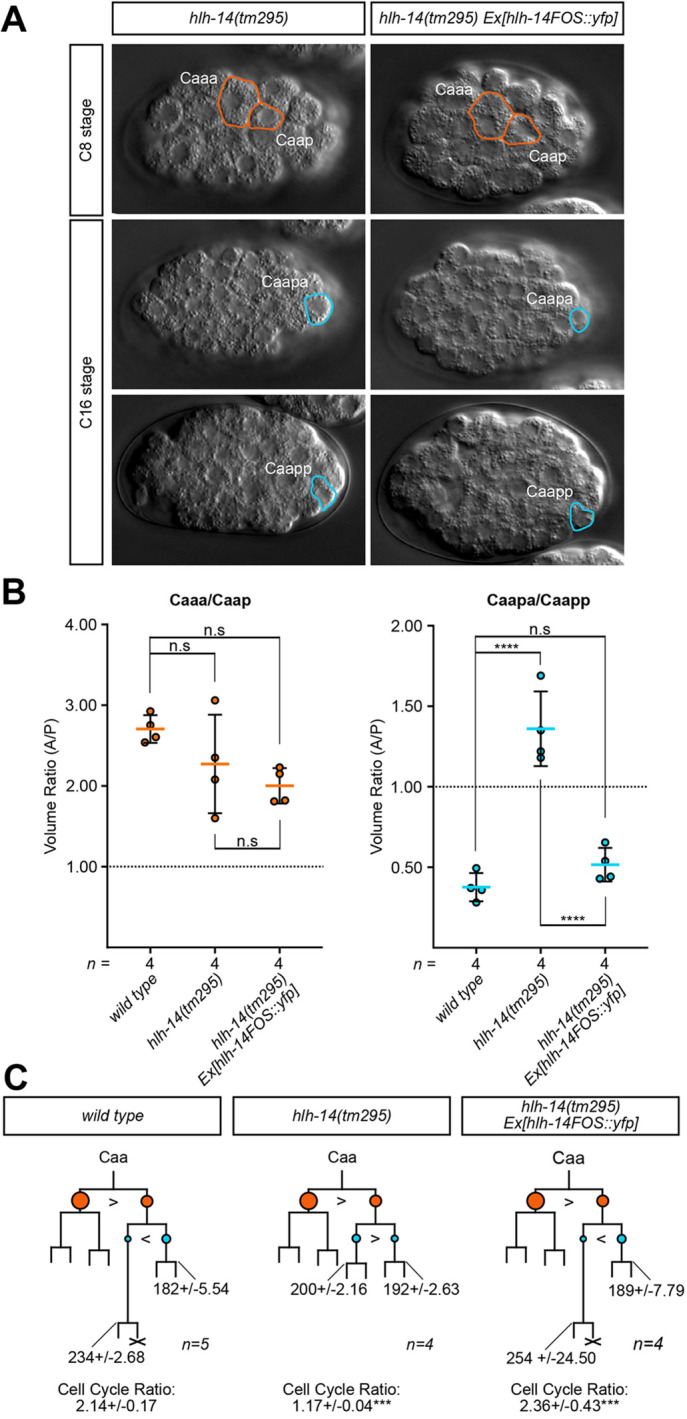
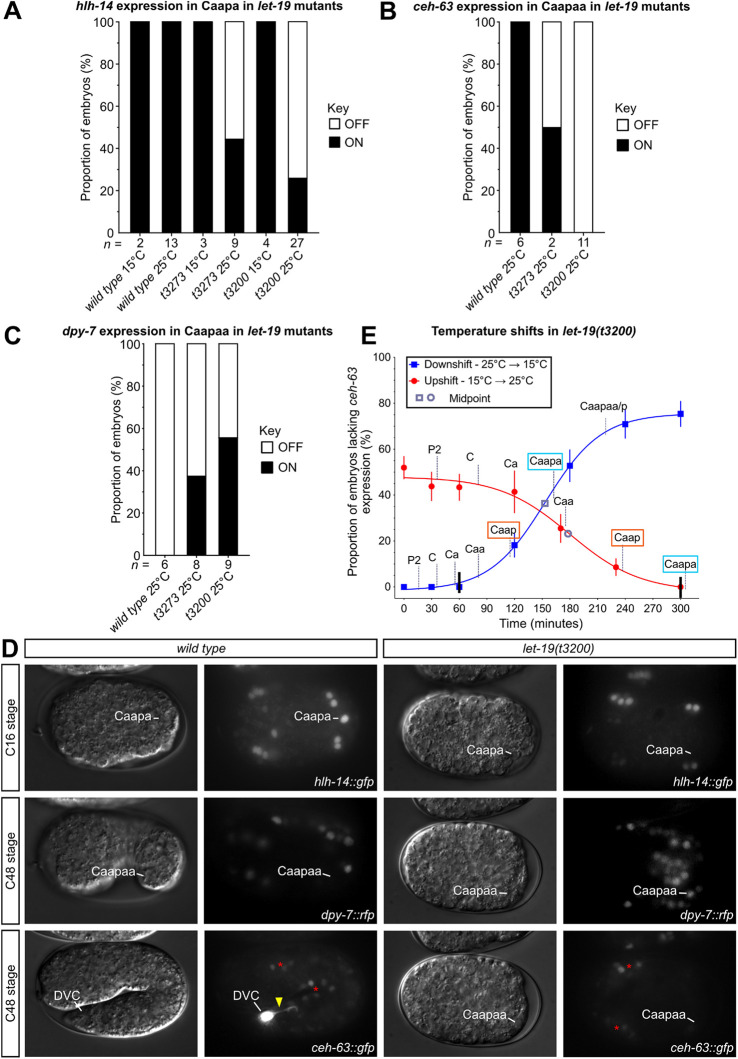
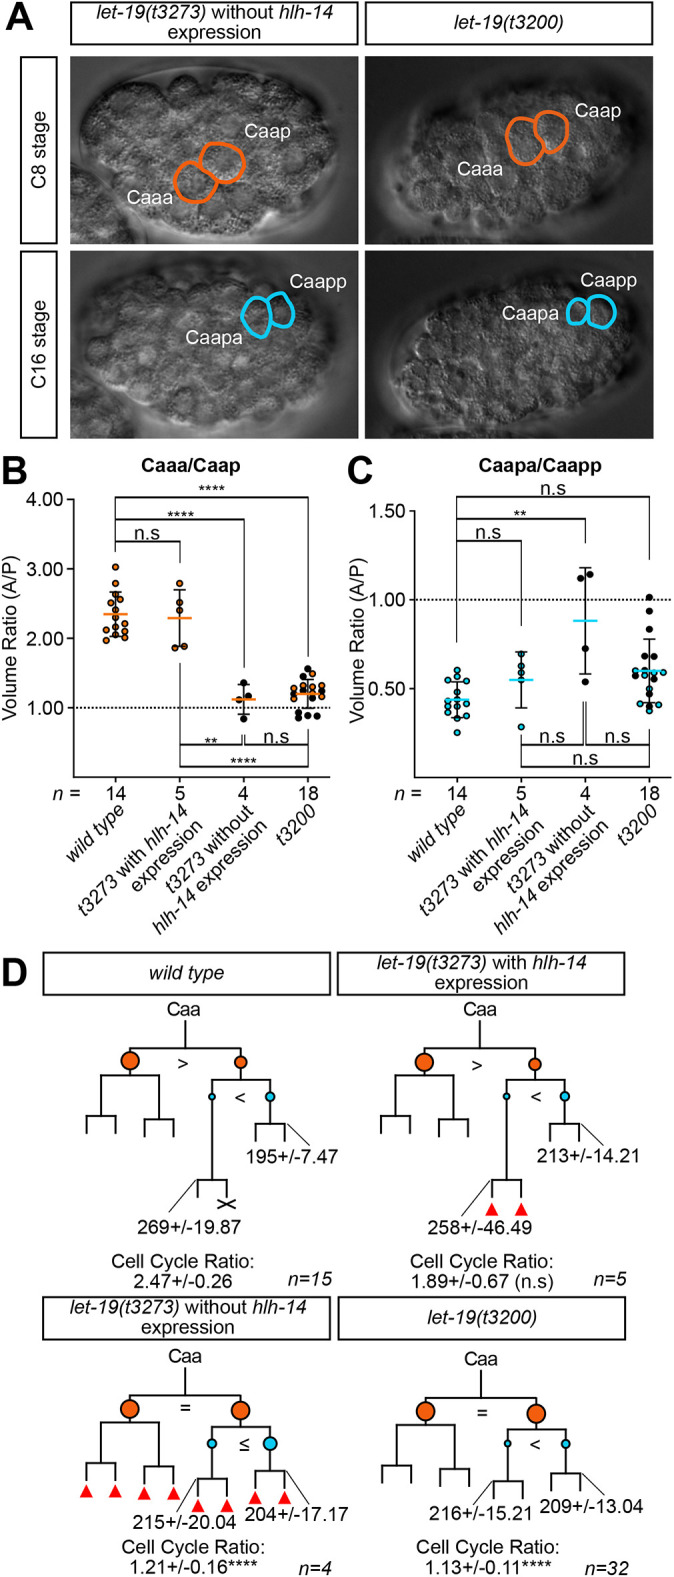
Asymmetric cell divisions often generate daughter cells of unequal size in addition to different fates. In some contexts, daughter cell size asymmetry is thought to be a key input to specific binary cell fate decisions. An alternative possibility is that unequal division is a mechanism by which a variety of cells of different sizes are generated during embryonic development. We show here that two unequal cell divisions precede neuroblast formation in the C lineage of Caenorhabditis elegans. The equalisation of these divisions in a pig-1/MELK mutant background has little effect on neuroblast specification. Instead, we demonstrate that let-19/MDT13 is a regulator of the proneural basic helix-loop-helix transcription factor hlh-14/ASCL1 and find that both are required to concomitantly regulate the acquisition of neuroblast identity and neuroblast cell size. Thus, embryonic neuroblast cell size in this lineage is progressively regulated in parallel with identity by key neural cell fate regulators. We propose that key cell fate determinants have a previously unappreciated function in regulating unequal cleavage, and therefore cell size, of the progenitor cells whose daughter cell fates they then go on to specify.

Keywords: C. elegans; Asymmetric division; Neuronal specification; Proneural.


Conflict of interest statement

Competing interests The authors declare no competing or financial interests.

Figures

Fig. 1.
Fig. 1.
Two dramatically unequal cleavages precede hlh-14 expression in the C lineage. (A) Diagram of the C lineage. Branch lengths indicate division timings, circles indicate relative cell size and X indicates cell death. Caa daughters are indicated in orange, Caap daughters in blue. Red lines indicate the timing of hlh-14 [gmIs20] expression. Red letters indicate neuronal fate; yellow letters indicate hypodermal fate. Fading of hlh-14 prior to terminal fate differentiation is indicated. Division timing at 25°C is indicated in min±s.d.; developmental stage of the C lineage expressed as total C lineage cell number. (B) DIC images of wild-type embryos representing the relative daughter cell sizes in the Caa and Caap cleavages. Length of a C. elegans embryo ∼50 µm. (C) Dot plot of the volumetric ratio of C lineage cleavages, expressed as the anterior/posterior (A/P) daughter volume; mean±s.d. The dashed line indicates an equal cleavage ratio of 1:1. The same colour code as in A indicates the same divisions in B and C: Caa in orange, Caap in blue. Circles on the right represent sister cell sizes at adjacent volume ratios. n.s, not significant; *P<0.5, ***P<0.001 (unpaired, two-tailed t-test).
Fig. 2.
Fig. 2.
C lineage unequal cleavages are equalised in pig-1(gm344) and ham-1(n1438) mutants. (A) DIC and GFP images, indicating the expression of pig-1 [bcSi43] in wild-type embryos in Caa and Caap. Length of a C. elegans embryo ∼50 µm. (B) DIC images presenting the unequal cleavages of Caa and Caap in pig-1(gm344) and ham-1(n1438) embryos. (C) Dot plots of the volumetric ratio of the Caa and Caap cleavages in wild-type, pig-1(gm344) and ham-1(n1438) embryos, expressed as the anterior/posterior daughter (A/P) volume; mean±s.d. Black dots in pig-1(gm344) indicate no hlh-14 expression. n.s, not significant; *P<0.05, ****P<0.0001 (one-way ANOVA with Tukey's HSD). (D) Lineage diagrams of the neurogenic branch of the C lineage in the same mutants, indicating division times and cleavage asymmetries. Data were obtained from manually 4D-lineaged embryos. Branch lengths are indicative of division times. Circles indicate the relative sizes of cells. Caa daughters indicated in orange, Caap daughters in blue. ‘=’ represents equal cleavages; ‘>’ or ‘<’ represent unequal cleavages. Red triangles indicate extra divisions sometimes seen in branch; full details in Fig. S5. X indicates cell death. Caapa and Caapp division times represented in min±s.d., with cell cycle ratio of Caapa/Caapp expression±s.d.: ****P<0.0001 (comparison with wild type, one-way ANOVA with Tukey's HSD). For details on wild-type and mutant genotypes, see Materials and Methods.
Fig. 3.
Fig. 3.
hlh-14 expression in pig-1(gm344), pig-1(tm1510) and ham-1(n1438) mutants. (A) DIC images and GFP maximum intensity projections for hlh-14 expression [gmIs20] in wild-type, pig-1(gm344) and ham-1(n1438) bean-stage (C16) embryos. Lines indicate expression in the DVC neuroblast Caapa. Length of a C. elegans embryo ∼50 µm. (B) Stacked bar chart of expression of hlh-14 [gmIs20] in the Caapa, Caapaa, Caapap and Caappa in wild-type, pig-1(gm344) and ham-1(n1438), and of hlh-14 [hlh-14 fosmid::gfp] expression in wild-type, pig-1(gm344) and pig-1(tm1510) lineaged embryos. Wild-type fates of cells indicated in brackets. (C) DIC and GFP images of hlh-14 expression [hlh-14 fosmid::gfp] in pig-1(gm344) and pig-1(tm1510) late bean-stage (C48) embryos following terminal C lineage divisions. Representative of majority phenotypes. For details on wild-type and mutant genotypes, see Materials and Methods.
Fig. 4.
Fig. 4.
Terminal division defects in pig-1(gm344) and ham-1(n1438). (A) DIC and GFP images for ceh-63 [otIs458] expression in wild-type, pig-1(gm344) and ham-1(n1438) 2-fold stage (C48) embryos. DVC neuron is indicated. Yellow arrowheads indicate neuronal projections, red asterisks indicate residual hlh-14 expression. Length of a C. elegans embryo ∼50 µm. (B) Stacked bar chart representing the number of ceh-63 [otIs458]-expressing cells at elongation stage in lineaged pig-1(gm344) and ham-1(n1438) embryos. (C) Bar chart representing terminal division phenotypes in lineaged pig-1(gm344) and ham-1(n1438) embryos. Categories are non-exclusive. Asymmetry defects, all non-wild-type phenotypes; precocious division, precocious division of Caapa; supernumerary division, extra rounds of division of any Caapa daughter cells. (D) Left: GFP maximum intensity projection images for hlh-14 [gmIs20] expression in lineaged wild-type and pig-1(gm344) embryos following Caapa division, indicating a loss of size asymmetry in pig-1(gm344) mutants. Right: Dot plot of nuclear area ratio of the Caapa daughters in wild-type and pig-1(gm344) embryos, expressed as the anterior/posterior (A/P) daughter area; mean±s.d. **P<0.01 (unpaired, two-tailed t-test). For details on wild-type and mutant genotypes, see Materials and Methods.
Fig. 5.
Fig. 5.
The Caap blastomere cleavage is affected in hlh-14(tm295) mutants. (A) DIC images of hlh-14(tm295) and hlh-14 fosmid-rescued embryos representing the relative daughter cell sizes at the Caa and Caap cleavages. Length of a C. elegans embryo ∼50 µm. (B) Dot plots of the volumetric ratio of the Caa and Caap cleavages in wild-type and hlh-14(tm295) embryos, expressed as the anterior/posterior (A/P) daughter volume; mean±s.d. n.s, not significant; ****P<0.0001 (one-way ANOVA with Tukey's HSD). Dashed line indicates absolute equal cleavage ratio of 1:1. (C) Lineage diagrams of the neurogenic branch of the C lineage for wild-type, hlh-14(tm295) and hlh-14(tm295) fosmid-rescued embryos, constructed from manually 4D-lineaged embryos. Branch lengths are indicative of division timings. Circles represent relative sizes of cells; with ‘>’ or ‘<’ representing the larger cell. Orange indicates Caa daughters, blue Caap daughters. X indicates cell death. Caapa and Caapp division times represented in min±s.d., with cell cycle ratio of Caapa/Caapp expression±s.d. ***P<0.001 (comparison with wild type, one-way ANOVA with Tukey's HSD). For details on wild-type and mutant genotypes, see Materials and Methods.
Fig. 6.
Fig. 6.
Loss of hlh-14 expression and adoption of hypodermal fate in let-19 mutants. (A) Stacked bar chart for hlh-14 [gmIs20] expression in Caapa (DVC neuroblast) in lineaged wild-type, let-19(t3273) and let-19(t3200) embryos at the permissive temperature 15°C and non-permissive temperature 25°C. Wild-type and let-19(t3200) embryos include embryos carrying only the hlh-14 [gmIs20] transgene or hlh-14 [gmIs20], dpy-7 [stIs10166] and ceh-63 [otIs458] transgenes. let-19(t3273) embryos carried only hlh-14 [gmIs20]. (B) Stacked bar chart for ceh-63 [otIs458] expression in Caapaa in lineaged wild-type and let-19 mutant embryos, at non-permissive temperature 25°C. Wild-type and let-19(t3200) embryos include embryos carrying hlh-14 [gmIs20], dpy-7 [stIs10166] and ceh-63 [otIs458] transgenes. let-19(t3273) embryos carried only ceh-63 [otIs458]. (C) Stacked bar chart for dpy-7 [stIs10166] expression in Caapaa in lineaged wild-type and let-19 mutant embryos, at non-permissive temperature 25°C. Wild-type and let-19(t3200) embryos include embryos carrying hlh-14 [gmIs20], dpy-7 [stIs10166] and ceh-63 [otIs458] transgenes. let-19(t3273) embryos carried only dpy-7 [stIs10166]. (D) DIC and GFP maximum intensity projection images of hlh-14 expression [gmIs20] in bean-stage (C16), RFP maximum intensity images of dpy-7 expression [stIs10166] in comma-stage (C48) and GFP maximum intensity projection images of ceh-63 expression [otIs458] in twofold (C48)-stage wild-type and let-19(t3200) embryos carrying all three reporters. Mutant phenotypes are represented. Positions of the Caapa (DVC neuroblast) or Caapaa (DVC in wild type) are indicated. Red asterisks indicate residual hlh-14 expression in ceh-63 images and yellow arrowhead indicates neuronal projection. Length of a C. elegans embryo ∼50 µm. (E) Percentage loss of ceh-63 expression (DVC) curves in let-19(t3200) for upshifts from permissive to non-permissive temperature (15°C→25°C) are plotted in red with downshifts in blue (25°C→15°C). Black lines indicate the window of critical time point for LET-19 action. A grey circle or square indicates the mid-point of up- and downshift curves, respectively. Cell names are represented at birth times at each temperature condition on the relevant curve. x-axis represents time points for the temperature shift. The birth of Caap is indicated by an orange box, Caapa in blue. n=40-60 for each time point in the downshift experiments (except n=9 at 0 min). n=50-70 per time point for upshifts (except n=102 at 0 min, n=29 at 120 min).
Fig. 7.
Fig. 7.
let-19 regulates the unequal cleavage of the Caa and possibly Caap blastomeres. (A) Representative DIC images of let-19(t3200) and let-19(t3273) mutants lacking hlh-14 expression, representing relative daughter cell sizes at the Caa and Caap cleavages. (B) Dot plot of the volumetric ratio of the Caa cleavage in wild type and let-19 mutants, expressed as the anterior/posterior (A/P) daughter volume; mean±s.d. For let-19(t3273), the proportion of embryos that express hlh-14 are plotted separately from those that do not. let-19(t3200) embryos lacking hlh-14 [gmIs20] expression are depicted as black. Dashed line indicates an absolute equal cleavage ratio of 1:1. n.s, not significant; **P<0.01, ****P<0.0001 (one-way ANOVA with Tukey's HSD). (C) The same as for B but for the Caap cleavage. let-19(t3200) embryos lacking hlh-14 [gmIs20] expression are depicted in black. **P<0.01 (one-way ANOVA with Tukeys's HSD). (D) Lineage diagrams of the neurogenic branch of the C lineage in let-19 mutants indicating division times and cleavage asymmetries. Data were obtained from manually 4D-lineaged embryos. Branch lengths indicative of division timings. Circles represent relative cell sizes; ‘=’ represents an equal cleavage; ‘>’ or ‘<’ indicate the larger cell. Orange indicates Caa daughters, blue Caap daughters. Red triangles indicate extra divisions and X indicates cell death. Caapa and Caapp division times represented in min±s.d., with cell-cycle ratio of Caapa/Caapp expression±s.d.; n.s, not significant; ****P<0.0001 (comparison with wild type, one-way ANOVA with Tukey's HSD). For details on wild-type and mutant genotypes, see Materials and Methods.

Similar articles

Cited by

  • Neurogenesis in Caenorhabditis elegans.
    Poole RJ, Flames N, Cochella L. Poole RJ, et al. Genetics. 2024 Oct 7;228(2):iyae116. doi: 10.1093/genetics/iyae116. Genetics. 2024. PMID: 39167071 Free PMC article. Review.

References

    1. Afgan, E., Baker, D., Batut, B., van den Beek, M., Bouvier, D., Cech, M., Chilton, J., Clements, D., Coraor, N., Grüning, B. A.et al. (2018). The Galaxy platform for accessible, reproducible and collaborative biomedical analyses: 2018 update. Nucleic Acids Res. 46, W537-W544. 10.1093/nar/gky379 - DOI - PMC - PubMed
    1. Arata, Y., Takagi, H., Sako, Y. and Sawa, H. (2014). Power law relationship between cell cycle duration and cell volume in the early embryonic development of Caenorhabditis elegans. Front. Physiol. 5, 529. 10.3389/fphys.2014.00529 - DOI - PMC - PubMed
    1. Balleza, E., Kim, J. M. and Cluzel, P. (2018). Systematic characterization of maturation time of fluorescent proteins in living cells. Nat. Methods 15, 47-51. 10.1038/nmeth.4509 - DOI - PMC - PubMed
    1. Bonaccorsi, S., Giansanti, M. G. and Gatti, M. (2000). Spindle assembly in Drosophila neuroblasts and ganglion mother cells. Nat. Cell Biol. 2, 54-56. 10.1038/71378 - DOI - PubMed
    1. Boveri, T. (1899). Die Entwickelung von Ascaris megalocephala mit besonderer Rücksicht auf die Kernverhältnisse. In Festschrift f. C. v. Kupffer, pp. 383-430. G. Fischer, Jena. 10.5962/bhl.title.9070 - DOI

Substances