

Consensus clustering with missing labels (ccml): a consensus clustering tool for multi-omics integrative prediction in cohorts with unequal sample coverage
- PMID: 38205966
- PMCID: PMC10782800
- DOI: 10.1093/bib/bbad501
Consensus clustering with missing labels (ccml): a consensus clustering tool for multi-omics integrative prediction in cohorts with unequal sample coverage
Abstract
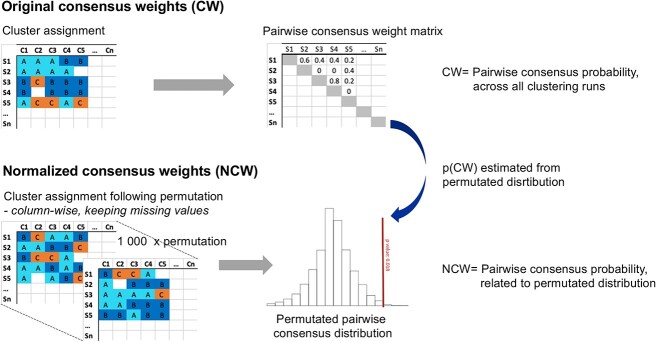
Multi-omics data integration is a complex and challenging task in biomedical research. Consensus clustering, also known as meta-clustering or cluster ensembles, has become an increasingly popular downstream tool for phenotyping and endotyping using multiple omics and clinical data. However, current consensus clustering methods typically rely on ensembling clustering outputs with similar sample coverages (mathematical replicates), which may not reflect real-world data with varying sample coverages (biological replicates). To address this issue, we propose a new consensus clustering with missing labels (ccml) strategy termed ccml, an R protocol for two-step consensus clustering that can handle unequal missing labels (i.e. multiple predictive labels with different sample coverages). Initially, the regular consensus weights are adjusted (normalized) by sample coverage, then a regular consensus clustering is performed to predict the optimal final cluster. We applied the ccml method to predict molecularly distinct groups based on 9-omics integration in the Karolinska COSMIC cohort, which investigates chronic obstructive pulmonary disease, and 24-omics handprint integrative subgrouping of adult asthma patients of the U-BIOPRED cohort. We propose ccml as a downstream toolkit for multi-omics integration analysis algorithms such as Similarity Network Fusion and robust clustering of clinical data to overcome the limitations posed by missing data, which is inevitable in human cohorts consisting of multiple data modalities. The ccml tool is available in the R language (https://CRAN.R-project.org/package=ccml, https://github.com/pulmonomics-lab/ccml, or https://github.com/ZhoulabCPH/ccml).
Keywords: consensus clustering; missing labels; multi-omics integration; predictive labels; unequal sample coverage.
© The Author(s) 2024. Published by Oxford University Press.
Figures
Similar articles
-
Endotypes of severe neutrophilic and eosinophilic asthma from multi-omics integration of U-BIOPRED sputum samples.Clin Transl Med. 2024 Jul;14(7):e1771. doi: 10.1002/ctm2.1771. Clin Transl Med. 2024. PMID: 39073027 Free PMC article.
-
Multi-omics clustering for cancer subtyping based on latent subspace learning.Comput Biol Med. 2023 Sep;164:107223. doi: 10.1016/j.compbiomed.2023.107223. Epub 2023 Jul 3. Comput Biol Med. 2023. PMID: 37490833
-
Clustering single-cell multi-omics data via graph regularized multi-view ensemble learning.Bioinformatics. 2024 Mar 29;40(4):btae169. doi: 10.1093/bioinformatics/btae169. Bioinformatics. 2024. PMID: 38547401 Free PMC article.
-
Consensus clustering applied to multi-omics disease subtyping.BMC Bioinformatics. 2021 Jul 6;22(1):361. doi: 10.1186/s12859-021-04279-1. BMC Bioinformatics. 2021. PMID: 34229612 Free PMC article.
-
Cancer subtype identification by multi-omics clustering based on interpretable feature and latent subspace learning.Methods. 2024 Nov;231:144-153. doi: 10.1016/j.ymeth.2024.09.014. Epub 2024 Sep 24. Methods. 2024. PMID: 39326482
Cited by
-
An effective heuristic for developing hybrid feature selection in high dimensional and low sample size datasets.BMC Bioinformatics. 2024 Dec 26;25(1):390. doi: 10.1186/s12859-024-06017-9. BMC Bioinformatics. 2024. PMID: 39722052 Free PMC article.
-
Attention mechanism models for precision medicine.Brief Bioinform. 2024 May 23;25(4):bbae156. doi: 10.1093/bib/bbae156. Brief Bioinform. 2024. PMID: 38811359 Free PMC article.
References
-
- Li CX, Wheelock CE, Skold CM, et al. Integration of multi-omics datasets enables molecular classification of COPD. Eur Respir J 2018;51:1701930. - PubMed
Publication types
MeSH terms
Grants and funding
LinkOut - more resources
Full Text Sources
Medical
Miscellaneous
