. 2024 Feb 20;9(2):e0058623.
doi: 10.1128/msystems.00586-23. Epub 2024 Jan 11.

Predicting the final metabolic profile based on the succession-related microbiota during spontaneous fermentation of the starter for Chinese liquor making

Affiliations

Predicting the final metabolic profile based on the succession-related microbiota during spontaneous fermentation of the starter for Chinese liquor making

Shibo Ban et al. mSystems. .

Abstract

Microbial inoculation is an effective way to improve the quality of fermented foods via affecting the microbiota structure. However, it is unclear how the inoculation regulates the microbiota structure, and it is still difficult to directionally control the microbiota function via the inoculation. In this work, using the spontaneous fermentation of the starter (Daqu) for Chinese liquor fermentation as a case, we inoculated different microbiota groups at different time points in Daqu fermentation, and analyzed the effect of the inoculation on the final metabolic profile of Daqu. The inoculated microbiota and inoculated time points both significantly affected the final metabolites via regulating the microbial succession (P < 0.001), and multiple inoculations can promote deterministic assembly. Twenty-seven genera were identified to be related to microbial succession, and drove the variation of 121 metabolites. We then constructed an elastic network model to predict the profile of these 121 metabolites based on the abundances of 27 succession-related genera in Daqu fermentation. Procrustes analysis showed that the model could accurately predict the metabolic abundances (average Spearman correlation coefficients >0.3). This work revealed the effect of inoculation on the microbiota succession and the metabolic profile. The established predicted model of metabolic profile would be beneficial for directionally improving the food quality.IMPORTANCEThis work revealed the importance of microbial succession to microbiota structure and metabolites. Multi-inoculations would promote deterministic assembly. It would facilitate the regulation of microbiota structure and metabolic profile. In addition, we established a model to predict final metabolites based on microbial genera related to microbial succession. This model was beneficial for optimizing the inoculation of the microbiota. This work would be helpful for controlling the spontaneous food fermentation and directionally improving the food quality.

Keywords: liquor fermentation; metabolites; microbial succession; microbiota; modeling.


Conflict of interest statement

The authors declare no conflict of interest.

Figures
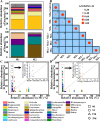
Fig 1
Fig 1
The microbiota characteristics in Daqu fermentation after microbial inoculation. (A) Relative abundances of bacteria and fungi in microbiota groups M1 and M2. Genera with average abundances greater than 1% are indicated. (B) Differences analysis for microbiota in different inoculated groups. The R- and P-values are calculated by using ANOSIM, ***P < 0.001; **P < 0.01; *P < 0.05. Control, without inoculation. M10, inoculation of M1 on day 0; M21, inoculation of M2 on day 1; M29, inoculation of M2 on day 9; M21 + M29, inoculations of M2 on days 1 and 9; M10 + M21, inoculations of M1 on day 0 and M2 on day 1; M10 + M29, inoculations of M1 on day 0 and M2 on day 9. The colonization of microbial genera from M1 (C) and from M2 (D) in Daqu fermentation. The abundances of genera in microbiota group (M1 or M2) and Daqu fermentation are showed on the abscissa and ordinate, respectively. The genera above the diagonal line represent their relative abundances are higher than that in Daqu fermentation. The genera with relative abundances lower than or equal to 1% in M1 or M2, are highlighted in the red dotted box.
Fig 2
Fig 2
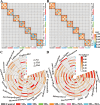
Analysis of final metabolites in Daqu fermentation with and without inoculation. (A) Heatmap of 12 categories of final metabolites in Daqu fermentations. The relative abundances of metabolites are normalized by minimum–maximum normalization. The edge color of each sector indicates the category of metabolites. (B) Differential analysis showing varied metabolites across different fermentations. P values are calculated with Wilcoxon rank-sum test, solid circles indicate the metabolites with significant differences (P < 0.05), and hollow circles indicate the metabolites with insignificant differences (P ≥ 0.5). Each circle indicates one metabolite at the end of Daqu fermentation. The color of circle indicates the category of metabolites. Solid circles with log2 (Inoculated/Control) higher or less than 0 indicate increased and decreased metabolites, respectively. Control, without inoculation; Control, without inoculation; M10, inoculation of M1 on day 0; M21, inoculation of M2 on day 1; M29, inoculation of M2 on day 9; M21 + M29, inoculations of M2 on days 1 and 9; M10 + M21, inoculations of M1 on day 0 and M2 on day 1; M10 + M29, inoculations of M1 on day 0 and M2 on day 9. *P < 0.05.
Fig 3
Fig 3
Effect of microbial inoculation on microbial succession in Daqu fermentation. The modified stochasticity ratio (MST) value of the bacteria (A) and fungi (B) in whole fermentation. MST value, with less than 0.5 and greater than 0, indicates deterministic succession of the microbiota; MST value, with less than 1 and greater than or equal to 0.5, indicates stochastic succession of the microbiotas. MST is calculated by comparing a current fermentation time point with that in its previous time point. The abundances of dominant bacterial genera (C) and fungal genera (D) related to microbial succession. All relative abundances of microbial genera are normalized from 0 to 1 (minimum–maximum normalization), which show the differences in abundances of microbiota on the same day. Control, without inoculation; M10, inoculation of M1 on day 0; M21, inoculation of M2 on day 1; M29, inoculation of M2 on day 9; M21 + M29, inoculations of M2 on days 1 and 9; M10 + M21, inoculations of M1 on day 0 and M2 on day 1; M10 + M29, inoculations of M1 on day 0 and M2 on day 9.
Fig 4
Fig 4
The correlation between microbial succession and final metabolites in Daqu fermentation. The effects of deterministic assembly (A) and stochastic assembly (B) on final metabolic characteristics. The width and color of lines indicate the mantel’s R-value and mantel’s P-value, respectively. Lines with Mantel’s P < 0.05 indicate significant correlations. The size and color of stars indicate the Pearson’s R-value and Pearson’s P-value, respectively. Bold stars with Pearson’s P-value < 0.05 indicate significant correlations.
Fig 5
Fig 5
Prediction of final metabolites based on the microbial inoculation in Daqu fermentation. (A) Structural equation model (SEM) revealing the relationship among microbial inoculation, succession, and metabolites. The width of arrows indicates the strength of path coefficient. The arrows represent path coefficients of standardized regression, and the data along with arrows represent the path coefficient value. P-values, determined by Tukey’s test, indicate the significance of the path. ***P < 0.001; **P < 0.01; *P < 0.05. Each metabolite circle indicates a category of metabolites, and the numbers in circle represent the number of metabolites that can be predicted. (B) The Spearman correlation coefficient of predicted metabolic abundances and measured metabolic abundances using linear regression analysis. (C) The comparison of the metabolic profiles between predicted value and measured value using Procrustes analysis. Each pie represents one metabolic profile classified by metabolic categories. Circles represent measured metabolic values, and triangles represent predicted metabolic values. Lines connecting the circles and triangles indicate the distances between the measured and predicted profiles. Control, without inoculation; M10, inoculation of M1 on day 0; M21, inoculation of M2 on day 1; M29, inoculation of M2 on day 9; M21 + M29, inoculations of M2 on days 1 and 9; M10 + M21, inoculations of M1 on day 0 and M2 on day 1; M10 + M29, inoculations of M1 on day 0 and M2 on day 9.

Similar articles

Cited by

References

    1. Blandino A, Al-Aseeri ME, Pandiella SS, Cantero D, Webb C. 2003. Cereal-based fermented foods and beverages. Food Res Internat 36:527–543. doi:10.1016/S0963-9969(03)00009-7 - DOI
    1. Febrianto NA, Zhu F. 2020. Changes in the composition of methylxanthines, polyphenols, and volatiles and sensory profiles of cocoa beans from the sul 1 genotype affected by fermentation. J Agric Food Chem 68:8658–8675. doi:10.1021/acs.jafc.0c02909 - DOI - PubMed
    1. Cheng H. 2010. Volatile flavor compounds in yogurt: a review. Crit Rev Food Sci Nutr 50:938–950. doi:10.1080/10408390903044081 - DOI - PubMed
    1. Liu S, Yang L, Zhou Y, He S, Li J, Sun H, Yao S, Xu S. 2019. Effect of mixed moulds starters on volatile flavor compounds in rice wine. LWT 112:108215. doi:10.1016/j.lwt.2019.05.113 - DOI
    1. Isaac Newton Institute Fellows, Widder S, Allen RJ, Pfeiffer T, Curtis TP, Wiuf C, Sloan WT, Cordero OX, Brown SP, Momeni B, et al. . 2016. Challenges in microbial ecology: building predictive understanding of community function and dynamics. ISME J 10:2557–2568. doi:10.1038/ismej.2016.45 - DOI - PMC - PubMed

LinkOut - more resources