

Development of a value-based scoring system for the MobQoL-7D: a novel tool for measuring quality-adjusted life years in the context of mobility impairment
- PMID: 38206178
- PMCID: PMC11552702
- DOI: 10.1080/09638288.2023.2297929
Development of a value-based scoring system for the MobQoL-7D: a novel tool for measuring quality-adjusted life years in the context of mobility impairment
Abstract
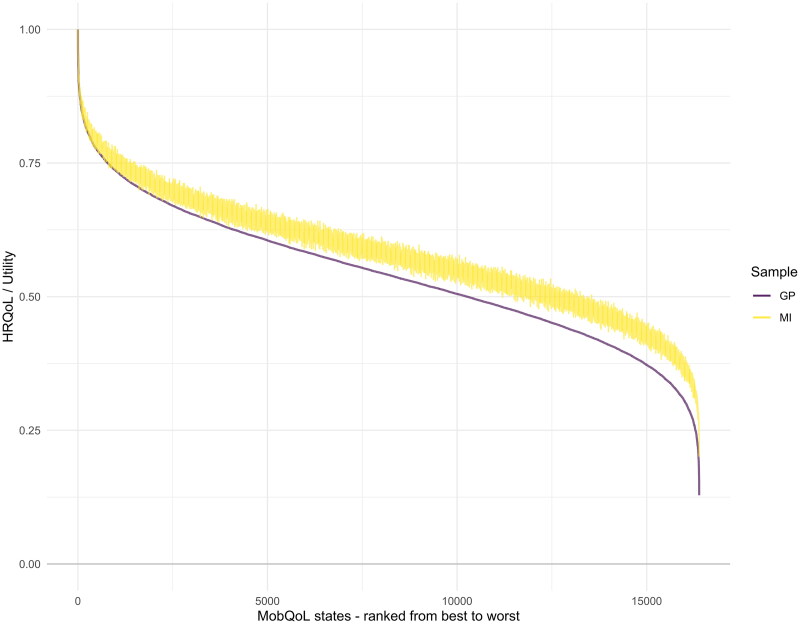
Purpose: To create a preference-based value set scoring system for the MobQoL-7D outcome measure, and to examine differences in the health state preferences of the general population and individuals with impaired mobility.
Methods and materials: A preference elicitation study was undertaken to ascribe utility weights to all health states (i.e., all unique combination of answers) described by the MobQoL-7D. The elicitation exercise was developed using the Online Elicitation of Personal Utility Functions (OPUF) tool. Two UK sample groups were recruited; firstly a representative general population sample (N = 504), secondly a balanced sample of individuals with impaired mobility (N = 368). Distinct preference-based value sets were developed for each sample. Differences in dimension ranking, weighting, and overall utility values were assessed.
Results: The general population sample considered most health states, especially the more severe states, to be worse than the mobility impaired sample comparatively. Statistically significant differences between the samples were observed in four of the seven MobQoL-7D dimensions.
Conclusions: This study is the first to provide preference-based value sets for the MobQoL-7D, ready for use in economic evaluations, QALY calculation, and other clinical or research applications. The study demonstrates how the general public and individuals with impaired mobility value health states differently.
Keywords: Disability; QALY; health-related quality of life; mobility impairment; patient reported outcomes; quality of life; utility.
Plain language summary
The MobQoL-7D offers a concise and valid tool for rehabilitation professionals to measure and monitor quality of life and quality-adjusted life years (QALYs) in the context of mobility impairment.The MobQoL-7D value set calculator allows summary utility scores and QALYs to be calculated using MobQoL-7D outcome data; the first of its kind.The general public and individuals with impaired mobility value health states differently, which could impact cost-per QALY calculations and subsequent service commissioning and funding decisions.
Conflict of interest statement
No potential conflict of interest was reported by the author(s).
Figures


Similar articles
-
Preference-based measurement of mobility-related quality of life: developing the MobQoL-7D health state classification system.Disabil Rehabil. 2022 Jun;44(12):2915-2929. doi: 10.1080/09638288.2020.1844319. Epub 2020 Nov 12. Disabil Rehabil. 2022. PMID: 33180652
-
Development of the MobQoL patient reported outcome measure for mobility-related quality of life.Disabil Rehabil. 2021 Nov;43(23):3395-3404. doi: 10.1080/09638288.2020.1741701. Epub 2020 Mar 24. Disabil Rehabil. 2021. PMID: 32208059
-
What Difference Does It Make? A Comparison of Health State Preferences Elicited From the General Population and From People With Multiple Sclerosis.Value Health. 2020 Feb;23(2):242-250. doi: 10.1016/j.jval.2019.08.009. Epub 2019 Oct 7. Value Health. 2020. PMID: 32113630
-
Quality-adjusted life-years lack quality in pediatric care: a critical review of published cost-utility studies in child health.Pediatrics. 2005 May;115(5):e600-14. doi: 10.1542/peds.2004-2127. Pediatrics. 2005. PMID: 15867026 Review.
-
Multi-gene Pharmacogenomic Testing That Includes Decision-Support Tools to Guide Medication Selection for Major Depression: A Health Technology Assessment.Ont Health Technol Assess Ser. 2021 Aug 12;21(13):1-214. eCollection 2021. Ont Health Technol Assess Ser. 2021. PMID: 34484487 Free PMC article.
Cited by
-
A systematic review of condition-specific preference-based measures used in young people and their valuation methods.J Patient Rep Outcomes. 2024 Dec 19;8(1):151. doi: 10.1186/s41687-024-00826-5. J Patient Rep Outcomes. 2024. PMID: 39699838 Free PMC article.
-
A scoping review to create a framework for the steps in developing condition-specific preference-based instruments de novo or from an existing non-preference-based instrument: use of item response theory or Rasch analysis.Health Qual Life Outcomes. 2024 May 14;22(1):38. doi: 10.1186/s12955-024-02253-y. Health Qual Life Outcomes. 2024. PMID: 38745165 Free PMC article.
References
-
- Department for Work and Pensions . Family resources survey: financial year 2021 to 2022. London: department for Work and Pensions; 2023.
-
- NHS Digital . Wheelchair services: operational data collection; 2022. https://www.england.nhs.uk/statistics/statistical-work-areas/national-wh....
-
- NHS Improving Quality . Right chair, right time, right now. London: NHS Improving Quality; 2014.
-
- Department of Health . Long term conditions compendium of Information. 3rd ed. Leeds: department of Health; 2012.
-
- Howard J, Fisher Z, Kemp AH, et al. . Exploring the barriers to using assistive technology for individuals with chronic conditions: a meta-synthesis review. Disabil Rehabil Assist Technol. 2022;17(4):390–408. - PubMed
MeSH terms
Grants and funding
LinkOut - more resources
Full Text Sources
Other Literature Sources