. 2024 Jan 11;8(1):e0359.
doi: 10.1097/HC9.0000000000000359. eCollection 2024 Jan 1.

Immunologic landscape of human hepatic hemangiomas and epithelioid hemangioendotheliomas

Affiliations

Immunologic landscape of human hepatic hemangiomas and epithelioid hemangioendotheliomas

Stefan Thomann et al. Hepatol Commun. .

Abstract

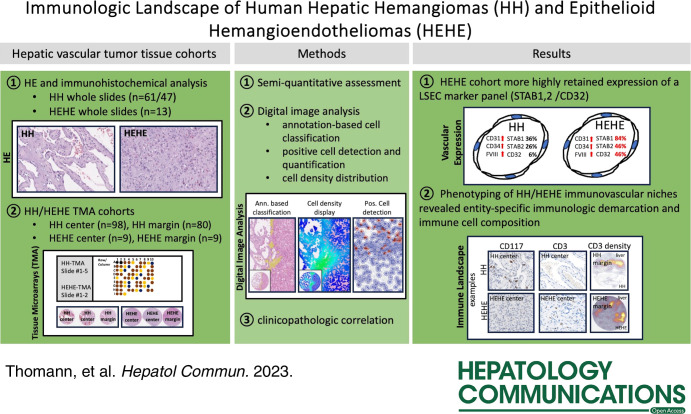
Background: The missing requirement for resection for the majority of hepatic hemangiomas (HH) and tissue scarcity for rare diseases such as hepatic epithelioid hemangioendotheliomas (HEHE) complicate the characterization of the spatial immunovascular niche of these benign and malignant vascular neoplastic diseases.

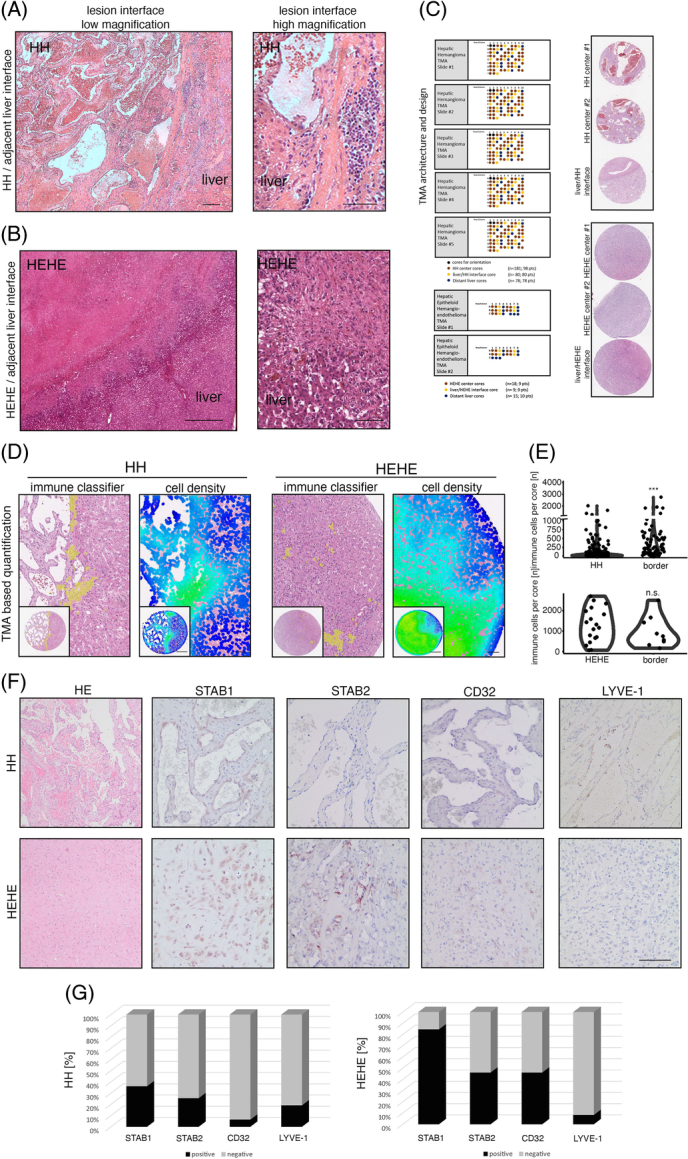
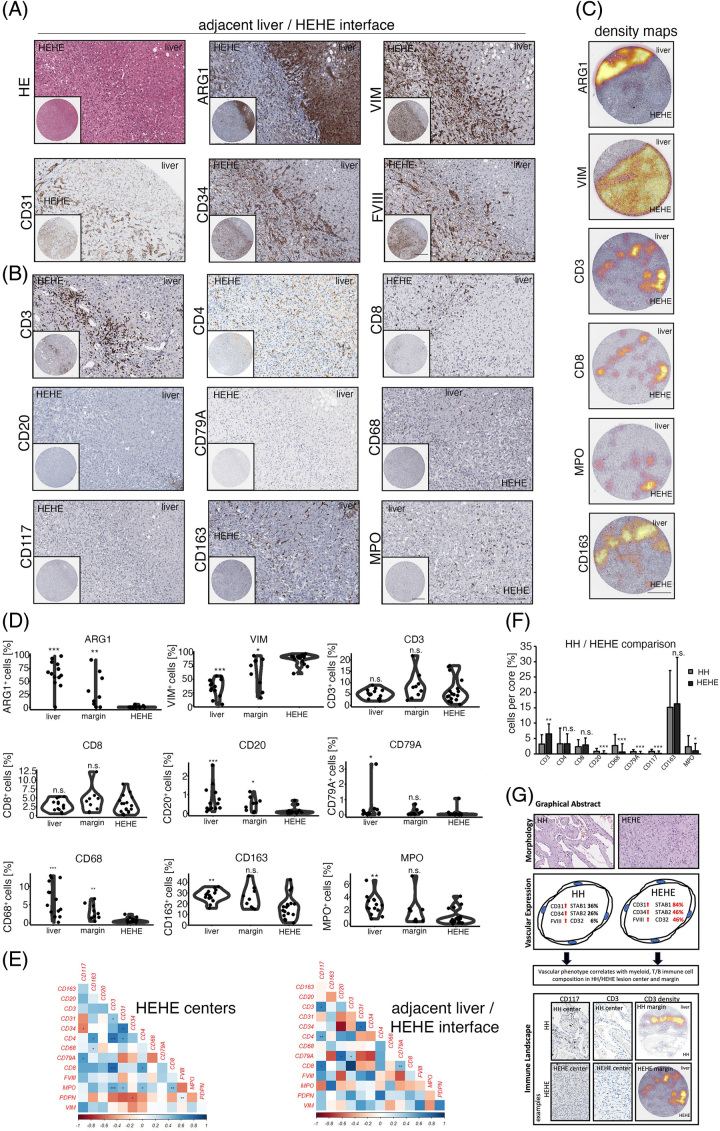
Methods: Two tissue cohorts containing 98 HHs and 13 HEHEs were used to study entity-specific and disease stage-specific endothelial cell (EC) phenotype and immune cell abundance. Using semiquantitative assessment, annotation-based cell classifiers, digital cell detection on whole slides, and tissue microarrays, we quantified 23 immunologic and vascular niche-associated markers and correlated this with clinicopathologic data.

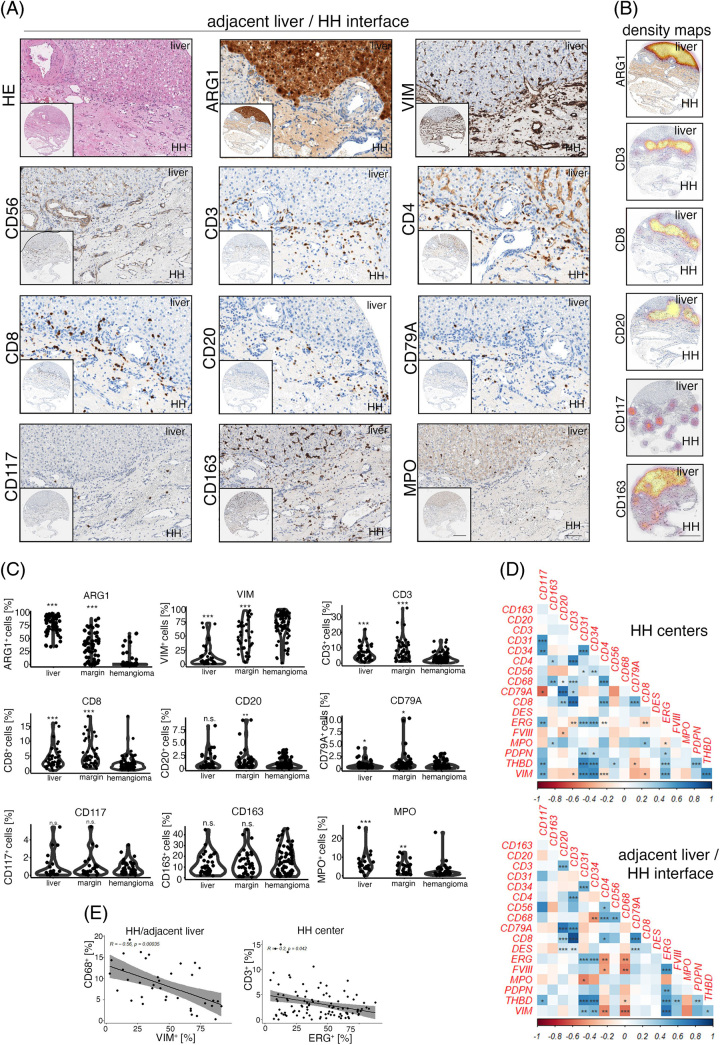
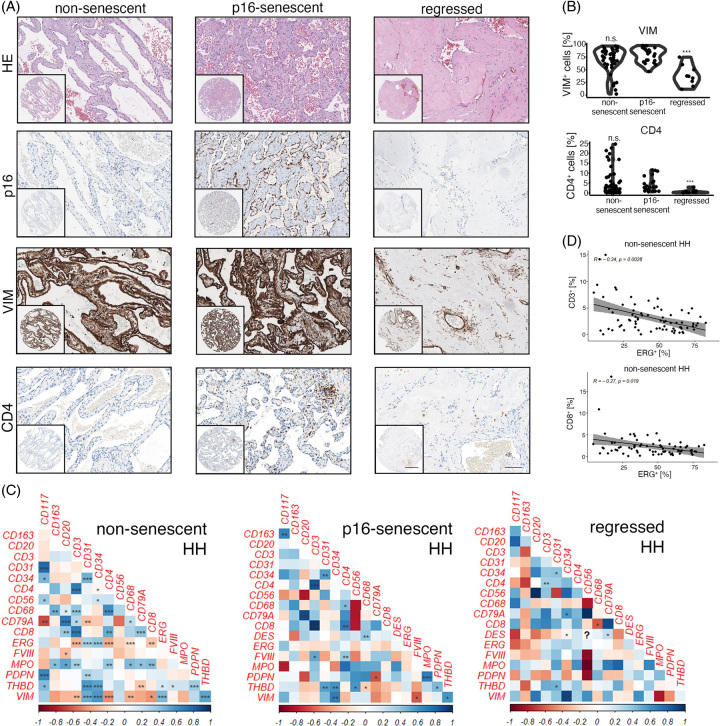
Results: Both HH and HEHE ECs were characterized by a CD31high, CD34high, FVIII-related antigenhigh expression phenotype with entity-specific expression differences of sinusoidal EC markers Stabilin1, Stabilin2, CD32, and Lymphatic Vessel Endothelial Hyaluronan Receptor 1 (LYVE-1). Cell detection identified an HH margin-prevailing immunologic response dominated by Myeloperoxidase+ (MPO+) macrophages, CD3+ and CD8+ T cell subsets, and B cells (CD20+, CD79A+). In HEHE, increased CD68+ and CD20+ cell demarcation of lesion margins was observed, while CD3+ and CD8+ T cells were equally detectable both marginally and intralesionally. Stage-specific pairwise correlation analysis of HH and HEHE revealed disease entity-specific immunologic infiltration patterns as seen by high CD117+ cell numbers in HH, while HEHE samples showed increased CD3+ T cell infiltration.

Conclusions: ECs in HH and HEHE share a continuous EC expression phenotype, while the expression of sinusoidal EC markers is more highly retained in HEHE. These phenotypic differences are associated with a unique and disease-specific immunovascular landscape.


Conflict of interest statement

The authors have no conflicts to report.

Figures

None
Graphical abstract
FIGURE 1
FIGURE 1
Immunological demarcation and intralesional immune cell infiltration of human hepatic hemangiomas and hepatic epithelioid hemangioendotheliomas. (A) HE stain of HH/adjacent liver interface and magnified region of interest with characteristic immunological demarcation. Scale bar: 200 µm (low) and 100 µm (high). (B) HE stain of HEHE/adjacent liver interface and magnified region of interest with indistinct lesion border. Scale bar: 800 µm (low) and 200 µm (high). (C) HH-TMA cohort as previously published. TMA contained patient material from 98 HH and 80 HH margins. HEHE cohort contained 9 HEHEs and 9 margins. (D) Immune cell detection within HH/HEHE cores by a trained cell classifier. Magnified regions of interest and full cores of HE, overlaid cell detections, and cell densities are displayed. Scale bar: 400 µm (low) and 100 µm (high). (E) Violin plots of quantified immune cell detections reveal significantly enriched immune cell density in HH margins but not HH centers, while HEHE margins remain statistically not significant. Wilcoxon rank-sum test (***p <0.001, n.s.). (F) Immunohistochemistry of HH/HEHE whole slides against sinusoidal EC markers STAB1, STAB2, CD32, and LYVE-1. The majority of HH ECs are negative for sinusoidal EC markers, while a higher proportion of HEHE ECs retain partial sinusoidal marker expression. Scale bar: 100 µm. (G) Barplots showing the percentual distribution of marker-positive ECs in HH/HEHE whole slides. The majority of HH ECs are negative for STAB1, STAB2, CD32, and LYVE-1, while a majority of HEHE ECs retain STAB1 (HH n = 47, HEHE n = 13). Abbreviations: EC, endothelial cell; HEHE, hepatic epithelioid hemangioendothelioma; HH, hepatic hemangioma; LYVE-1, Lymphatic Vessel Endothelial Hyaluronan Receptor 1; STAB1, Stabilin1; STAB2, Stabilin2; TMA, tissue microarray.
FIGURE 2
FIGURE 2
mmunologic characterization of the human hepatic hemangioma/adjacent liver parenchyma interface. (A) Low and high magnification of HE, Arginase 1 (ARG1), Vimentin (VIM), CD56, CD3, CD4, CD8, CD20, CD79A, CD117, CD163 and Myeloperoxidase (MPO) in HH margins. Immune cell accumulation at the lesion/liver interface can be detected. Scale bar: 400 µm (low) and 100 µm (high). (B) Depiction of ARG1+, CD3+, CD8+, CD20+, CD117+ and CD163+ cell density overlay at the HH/adjacent liver parenchyma interface. ARG1 highlights hepatocytes, and CD3, CD8 and CD20 show the highest cell densities at the liver/lesion interface. Spatial cell distribution of CD117 and CD163 reveals high-density foci of marker-positive cells also within HH. Scale bar: 400 µm. (C) Percentual distribution of ARG1, VIM, CD3, CD8, CD20, CD79A, CD117, CD163 and MPO in distant liver tissues, HH/adjacent liver margins (margin), and HH centers (hemangioma). Wilcoxon rank-sum test of HH centers versus tissue area of interest (*p < 0.05, **p < 0.01, ***p < 0.001, n.s. = not significant). (D) Heatmaps displaying pairwise correlation metrics of marker-positive cells (%) in HH center and HH/adjacent liver parenchyma tissues. Spearman correlation coefficient displayed as a color code from 1 (blue) to −1 (red; *p < 0.05, **p < 0.01, ***p < 0.001). (E) Correlation analysis between CD68+/VIM+ and CD3+/ETS Transcription Factor ERG+ (ERG+) percentual numbers in adjacent liver/HH interface and HH center cores (Spearman correlation analysis). Abbreviations: HE, hematoxylin eosin; HH, hepatic hemangioma.
FIGURE 3
FIGURE 3
HH disease stage–specific immunologic infiltration patterns. (A) Low and high magnification of HE, p16, Vimentin (VIM) and CD4 in non-senescent, p16-senescent and regressed HH. Scale bar: 400 µm (low) and 100 µm (high). (B) Percentual distribution of VIM and CD4 in non-senescent, p16-senescent and regressed HH. Wilcoxon rank-sum test of p16-senescent HH versus HH of interest (***p < 0.001, n.s. = not significant). (C) Heatmaps displaying pairwise correlation metrics of marker-positive cells (%) in non-senescent, p16-senescent and regressed HH center tissues. Spearman correlation coefficient displayed as a color code from 1 (blue) to −1 (red; *p < 0.05, **p < 0.01, ***p < 0.001). (D) Correlation analysis between CD3+/ETS Transcription Factor ERG+ (ERG+) and CD8+/ERG+ percentual numbers in non-senescent HH center cores (Spearman correlation analysis). Abbreviations: HE, hematoxylin eosin; HH, hepatic hemangioma.
FIGURE 4
FIGURE 4
Immunologic characterization of the human HEHE/adjacent liver parenchyma interface. (A) Low and high magnification of HE, ARG1, VIM, CD31, CD34 and FVIII at the HEHE/adjacent liver interface. Scale bar: 400 µm (low) and 100 µm (high). (B) Low and high magnification of CD3, CD4, CD8, CD20, CD79A, CD68, CD117, CD163 and MPO at the HEHE/adjacent liver parenchyma interface. Scale bar: 400 µm (low) and 100 µm (high). (C) Depiction of ARG1+, VIM+, CD3+, CD8+, MPO+ and CD163+ cell density overlay at the HEHE/adjacent liver interface. ARG1 highlights hepatocytes, and CD3, CD8 and CD163 show clear immunologic demarcation at the liver lesion interface. Spatial cell distribution of CD3, CD8 and MPO reveals high-density foci of marker-positive cells also within HEHE. Scale bar: 400 µm. (D) Percentual distribution of ARG1, VIM, CD3, CD8, CD20, CD79A, CD68, CD163 and MPO in the distant liver, HEHE/adjacent liver parenchyma interface (margin), and HEHE centers. Wilcoxon rank-sum test of HEHE centers versus tissue area of interest (*p < 0.05, **p < 0.01, ***p < 0.001, n.s. = not significant). (E) Heat maps displaying pairwise correlation metrics of marker-positive cells (%) in HEHE centers and at the HEHE/adjacent liver interface. Spearman correlation coefficient displayed as a color code from 1 (blue) to −1 (red; *p < 0.05, **p < 0.01, ***p < 0.001). (F) Barplot depicting percentual infiltration of marker-positive immune cells in HH/HEHE in an entity-specific comparison. Comparison of HH (overall) versus HEHE (overall) by Wilcoxon rank-sum test (*p < 0.05, **p < 0.01, ***p < 0.001, n.s. = not significant). (G) Graphical abstract summarizing the main results of this study. Abbreviations: ARG1, Arginase 1; FVIII, FVIII-related antigen; HE, hematoxylin eosin; HEHE, hepatic epithelioid hemangioendothelioma; HH, hepatic hemangioma. MPO, Myeloperoxidase; VIM, Vimentin.

Similar articles

References

    1. Mocchegiani F, Vincenzi P, Coletta M, Agostini A, Marzioni M, Baroni GS, et al. Prevalence and clinical outcome of hepatic haemangioma with specific reference to the risk of rupture: A large retrospective cross-sectional study. Dig Liver Dis. 2016;48:309–314. - PubMed
    1. Trotter JF, Everson GT. Benign focal lesions of the liver. Clin Liver Dis. 2001;5:17–42; v. - PubMed
    1. Belli L, De Carlis L, Beati C, Rondinara G, Sansalone V, Brambilla G. Surgical treatment of symptomatic giant hemangiomas of the liver. Surg Gynecol Obstet. 1992;174:474–478. - PubMed
    1. Toro A, Mahfouz AE, Ardiri A, Malaguarnera M, Malaguarnera G, Loria F, et al. What is changing in indications and treatment of hepatic hemangiomas. A review. Ann Hepatol. 2014;13:327–339. - PubMed
    1. Hasan HY, Hinshaw JL, Borman EJ, Gegios A, Leverson G, Winslow ER. Assessing normal growth of hepatic hemangiomas during long-term follow-up. JAMA Surg. 2014;149:1266–1271. - PubMed

Publication types