Review
. 2024 Mar;124(3):681-751.
doi: 10.1007/s00421-023-05335-9. Epub 2024 Jan 11.

A century of exercise physiology: effects of muscle contraction and exercise on skeletal muscle Na+,K+-ATPase, Na+ and K+ ions, and on plasma K+ concentration-historical developments

Affiliations
Review

A century of exercise physiology: effects of muscle contraction and exercise on skeletal muscle Na+,K+-ATPase, Na+ and K+ ions, and on plasma K+ concentration-historical developments

Michael J McKenna et al. Eur J Appl Physiol. 2024 Mar.

Abstract

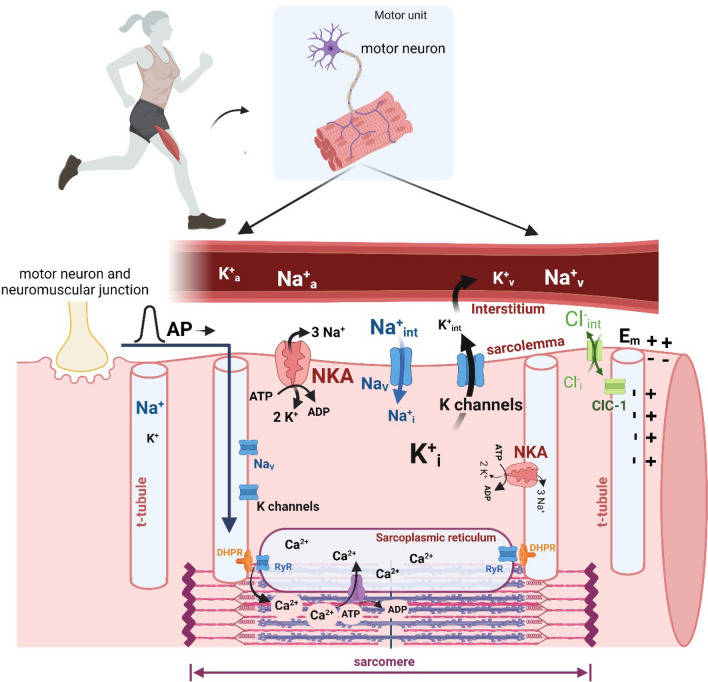
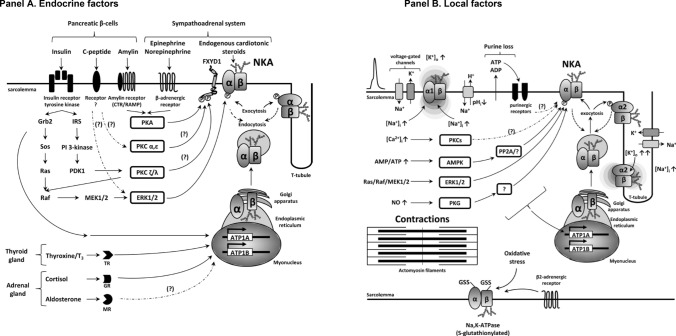
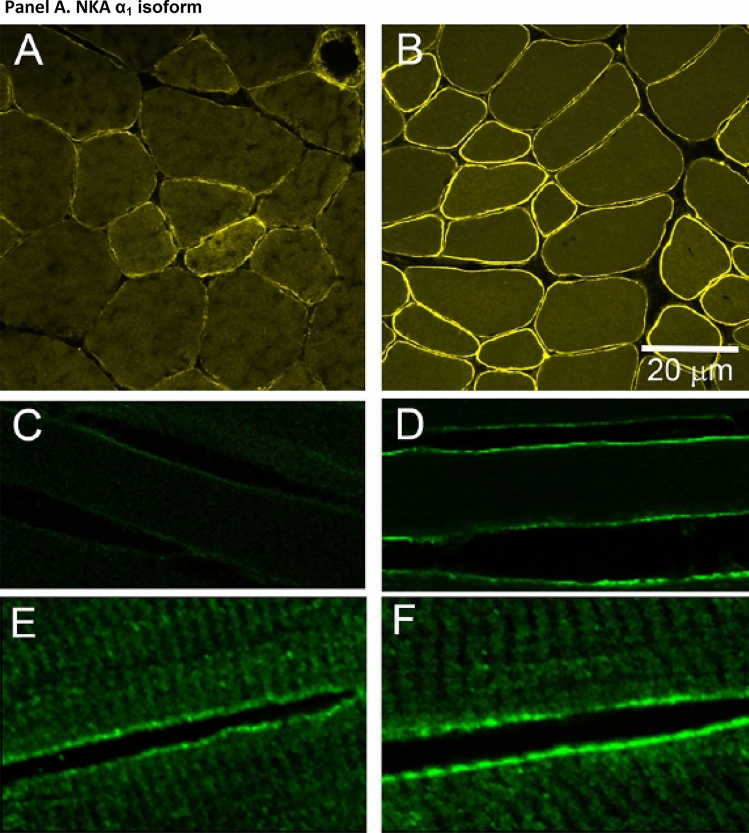
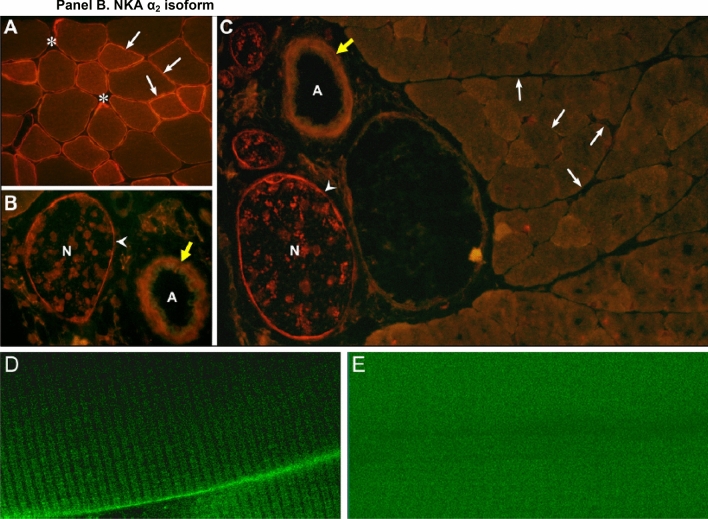
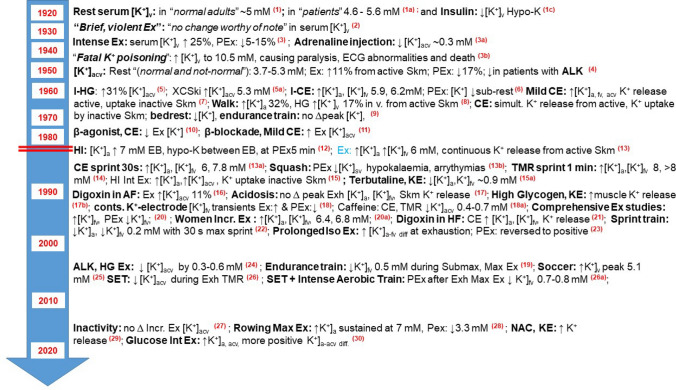
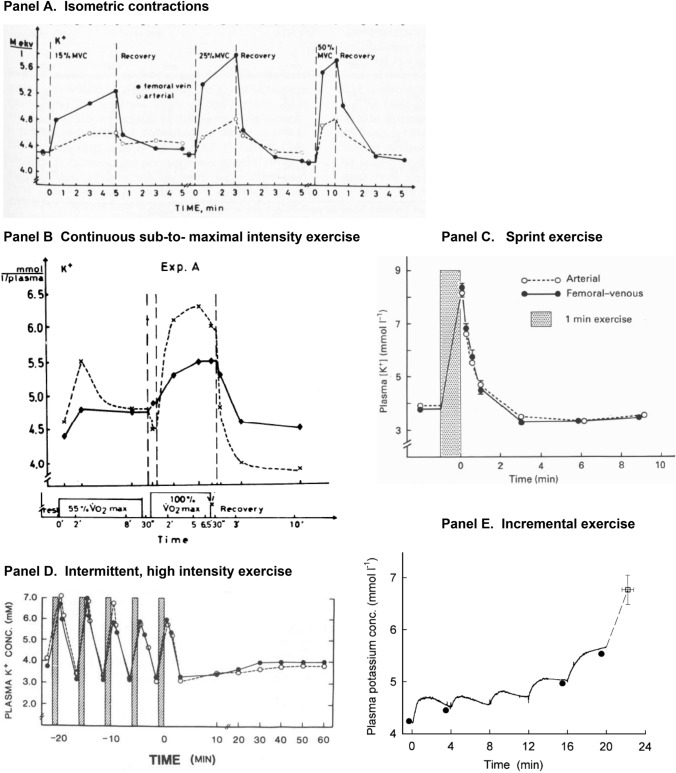
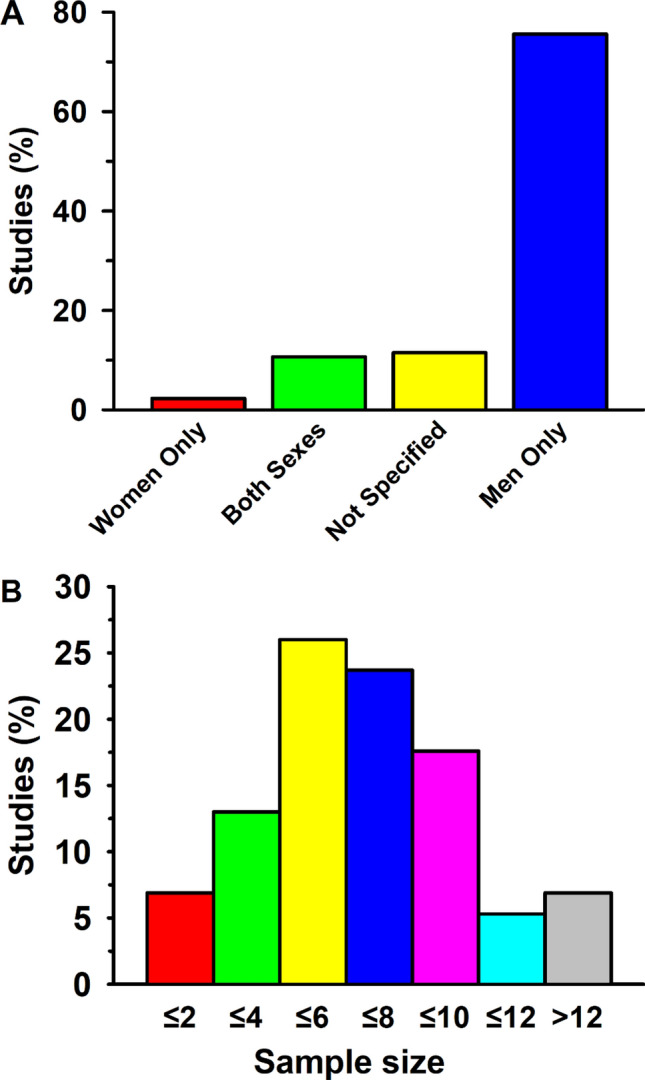
This historical review traces key discoveries regarding K+ and Na+ ions in skeletal muscle at rest and with exercise, including contents and concentrations, Na+,K+-ATPase (NKA) and exercise effects on plasma [K+] in humans. Following initial measures in 1896 of muscle contents in various species, including humans, electrical stimulation of animal muscle showed K+ loss and gains in Na+, Cl- and H20, then subsequently bidirectional muscle K+ and Na+ fluxes. After NKA discovery in 1957, methods were developed to quantify muscle NKA activity via rates of ATP hydrolysis, Na+/K+ radioisotope fluxes, [3H]-ouabain binding and phosphatase activity. Since then, it became clear that NKA plays a central role in Na+/K+ homeostasis and that NKA content and activity are regulated by muscle contractions and numerous hormones. During intense exercise in humans, muscle intracellular [K+] falls by 21 mM (range - 13 to - 39 mM), interstitial [K+] increases to 12-13 mM, and plasma [K+] rises to 6-8 mM, whilst post-exercise plasma [K+] falls rapidly, reflecting increased muscle NKA activity. Contractions were shown to increase NKA activity in proportion to activation frequency in animal intact muscle preparations. In human muscle, [3H]-ouabain-binding content fully quantifies NKA content, whilst the method mainly detects α2 isoforms in rats. Acute or chronic exercise affects human muscle K+, NKA content, activity, isoforms and phospholemman (FXYD1). Numerous hormones, pharmacological and dietary interventions, altered acid-base or redox states, exercise training and physical inactivity modulate plasma [K+] during exercise. Finally, historical research approaches largely excluded female participants and typically used very small sample sizes.

Keywords: Exercise; FXYD; Fatigue; Na+, K+-pump; Plasma; Potassium; Skeletal muscle; Sodium.


Figures

Fig. 1
Fig. 1
Schematic overview of ion movements in skeletal muscle during excitation contraction coupling. Overview of the sequence of events in excitation-contraction coupling leading to muscle contraction, Na+ and K+ movements and their regulation. The muscle action potential (AP) is initiated at the neuromuscular junction and transmitted along the sarcolemmal membrane of the muscle and through the transverse tubules (t-tubules) into the interior of the muscle fibre. The t-tubular membrane expresses voltage-gated dihydropyridine receptors (DHPR) which are in close contact with the sarcoplasmic reticulum (SR) Ca2+ release channels (RyR). The depolarisation of the DHPRs results in opening of the RyR receptor with an ensuing SR Ca2+ release, causing a transient increase in intracellular free [Ca2+] permitting the cycling of cross-bridges which eventually results in force development, whilst relaxation is caused by an active pumping of Ca2+ back to SR. Ion distribution at rest shows high intracellular [K+] and low [Na+], with low [K+] and high [Na+] in the extracellular space (interstitium). These steep trans-membrane concentration gradients for Na+ and K+ allow for propagation of the AP and contribute to maintenance of membrane potential. The AP is generated by Na+ influx via opening of voltage-gated Na+ channels followed by K+ efflux via voltage sensitive K+ channels. During an AP, there is a net K+ efflux into the interstitium and Na+ enters the cell, with K+ returned intracellularly and Na+ extruded by the NKA. During contractions, there is a net cellular gain of Na+ and loss of K+ from the fibre, with K+ then diffusing from the interstitium into capillaries and is removed by the venous circulation. Ca2+, calcium; Na+, sodium; K+, potassium; K+a, K+v, K+i and K+int denote arterial plasma, venous plasma, muscle intracellular and interstitial K+, respectively, whilst Na+a, Na+v, Na+i, and Na+int denote arterial, venous, muscle intracellular and interstitial Na+, respectively. Cli and Clint denote intracellular and interstitial Cl, respectively. NKA Na+,K+-ATPase, Nav voltage-gated Na+ channel, t-tubule transverse tubular system, K channels channels permeable to K+, e.g. voltage gated K+ and KATP channels, Em membrane potential, DHPR dihydropyridine receptors, SR sarcoplasmic reticulum, RyR Ca2+ release channels
Fig. 2
Fig. 2
Schematic illustration of evolution of research into the effects of muscle contraction and exercise on skeletal muscle Na+ and K+ ions, Na+,K+-ATPase and on plasma K+ concentration. Schematic illustration of flow and connectivity of research from initial critical measurements (in light yellow boxes) of contents of K+ (K+c) and Na+ (Na+c) ions in skeletal muscle (m), serum K+ concentration ([K+]) in humans, and discovery of NKA; following research paths further investigating skeletal muscle ions and exercise (light blue boxes), plasma [K+] ([K+]p) in humans and muscle NKA activity, content and isoforms (light green boxes), all culminating in current understanding of the effects of muscle contraction and exercise on muscle Na+ and K+ ions, NKA and on plasma [K+]. The resulting impacts are shown (in light grey boxes) in the fields of medicine, physiology and sport and exercise science. Hm human muscle
Fig. 3
Fig. 3
Receptors and pathways involved in regulation of NKA in skeletal muscle involving A endocrine factors, including insulin and catecholamines and B local factors. From Pirkmajer and Chibalin (2016) with permission. Detailed descriptions of regulatory factors, their receptors, pathways and actions are given in Pirkmajer and Chibalin (2016). AMP adenosine monophosphate, ATP adenosine triphosphate, AMPK AMP kinase, cAMP cyclic AMP, Ras Raf, MEK1/2 kinase upstream of ERK1/2, PKC protein kinase C, PKG PP2a, NO nitric oxide, GSS glutathione, FXYD1 phospholemman, IRS insulin receptor substrate, PI3-kinase, phosphoinositide 3-kinase, PDK1 phosphoinositide-dependent protein kinase 1, TR thyroid hormone receptor, GR glucocorticoid receptor, MR mineralocorticoid receptor, ATP1A gene for NKA α1-subunit, ATP1B gene for NKA β1-subunit
Fig. 4
Fig. 4
Timeline of selected key findings on Na+ and K+ ions, and of NKA in skeletal muscle at rest and with exercise, with focus on findings in human muscle. All findings are from measures in muscle obtained from humans (Hm), rats (Ratm), frogs (Frogm) or mice (Mousem), except for discovery of NKA in crab nerves. Measures refer to resting muscle unless specified as following stimulation (Stim.) or Exercise. Interventions or use of mouse genetic modification models are indicated by bold, italicised text. Red horizontal lines indicate different time-scale after the split. All NKA disease-related discoveries are omitted from this figure. Na+ sodium ion, K+ potassium ion, Na+c sodium ion content, K+c potassium ion content, [ion] ion concentration, i intracellular, int interstitial, ECW extracellular water determined by (method), NKA Na+, K+-ATPase; NKA α(+/−) or (−/−), modified mouse isoform lacking one or both copies of the gene encoding for that α isoform; 3-O-MFPase, 3-O-methyl fluorescein phosphatase; FYXD1, phospholemman; MRI, magnetic resonance imaging. References: (1) (Katz 1896); (2) (Overton 1902); (3) (Mitchell and Wilson 1921); (4) (Norn 1929); (5) (Cullen et al. 1933); (6) Fenn and Cobb 1936); (7) (Fenn et al. 1938); (8) (Dean 1941); (9) (Mudge and Vislocky 1949); (10) (Johnson 1956); (11) (Skou 1957); (12) (Bonting et al. 1961); (13) (Bergstrom and Hultman 1966); (14) (Clausen and Hansen 1974); (14a) (Sahlin et al. 1977); (15) (Sjogaard and Saltin 1983); (16) (Norgaard et al. 1984); (17) (Lytton et al. 1985); (18) (Everts et al. 1988); (19) (Hundal et al. 1992); (20) (Benders et al. 1992); (21) (Green et al. 1993); (22) (McKenna et al. 1993); (23) (Hundal et al. 1994); (24) (Shamraj and Lingrel 1994); (25) (Tsakiridis et al. 1996); (26) (Clausen and Pearson 1998); (26a) (Garvey et al. 1998); (27) (Green et al. 2000), (28) (Juel et al. 2000); (29) (He et al. 2001); (29a) Nordsborg et al. 2003a); (30) (Murphy et al. 2004); (31) (Nielsen et al. 2004); (32) (Radzykevich et al. 2013); (33) (Thomassen et al. 2013); (34) (Hammon et al. 2015); (35) (Gast et al. 2022b)
Fig. 5
Fig. 5
Fluorescence and confocal images of NKA α1 (Panel I) and α2 (Panel II) isoform expression and localization in m. tibialis anterior and m. EDL, in wild-type mice and in gene-targeted mice with deletion of NKA α2 isoform expression in Skeletal muscle (skα2(−/−)). From Figs. 4 and 3, respectively, in Radzyukevich et al. (2013) (with permission). Panel I: Transverse sections of murine mtibialis anterior (A, B) and longitudinal scans of m. EDL (C-F) labelled for NKA α1 isoform, in wild-type (A, C, E) and in gene-targeted skeletal muscle α2 deletion (skα2(−/−)) mice (B, D, F). Images show sarcolemmal and t-tubular location of α1 in wild-type mice, with enhanced α1 abundances in skα2(−/−) mice. Panel II: Transverse sections of murine mtibialis anterior (A, B, C) and longitudinal scans of m. EDL (D, E) labelled for NKA α2 isoform, in wild-type (A, B, D) and in gene-targeted skeletal muscle α2 deletion (skα2(−/−)) mice (C, E). Images show sarcolemmal (image A, designated by arrows) and t-tubular locations (A, D) of α2 in wild-type mice, with absence of α2 in muscle fibres in skα2(−/−) mice (C, E), although with α2 presence retained in motor nerves and arteriolar smooth muscle (images B and C, labelled as (small font) “N” and “A” with accompanying arrow head and arrow)
Fig. 5
Fig. 5
Fluorescence and confocal images of NKA α1 (Panel I) and α2 (Panel II) isoform expression and localization in m. tibialis anterior and m. EDL, in wild-type mice and in gene-targeted mice with deletion of NKA α2 isoform expression in Skeletal muscle (skα2(−/−)). From Figs. 4 and 3, respectively, in Radzyukevich et al. (2013) (with permission). Panel I: Transverse sections of murine mtibialis anterior (A, B) and longitudinal scans of m. EDL (C-F) labelled for NKA α1 isoform, in wild-type (A, C, E) and in gene-targeted skeletal muscle α2 deletion (skα2(−/−)) mice (B, D, F). Images show sarcolemmal and t-tubular location of α1 in wild-type mice, with enhanced α1 abundances in skα2(−/−) mice. Panel II: Transverse sections of murine mtibialis anterior (A, B, C) and longitudinal scans of m. EDL (D, E) labelled for NKA α2 isoform, in wild-type (A, B, D) and in gene-targeted skeletal muscle α2 deletion (skα2(−/−)) mice (C, E). Images show sarcolemmal (image A, designated by arrows) and t-tubular locations (A, D) of α2 in wild-type mice, with absence of α2 in muscle fibres in skα2(−/−) mice (C, E), although with α2 presence retained in motor nerves and arteriolar smooth muscle (images B and C, labelled as (small font) “N” and “A” with accompanying arrow head and arrow)
Fig. 6
Fig. 6
Timeline of key developments for plasma [K+] with exercise in humans
Fig. 7
Fig. 7
Arterial and femoral venous plasma [K+] during and after different types of exercise. A Isometric exercise. Arterial (o- - o) and femoral venous (•−•) plasma [K+] before, during and after knee extensor muscle contractions at 15%, 25% and 50% maximal voluntary contractions (MVC), for 5, 3 and 0.5 min, respectively, each followed by 5 min rest (n = 4–8, males). From (Saltin et al. 1981). B Continuous submaximal-to-maximal intensity exercise. Arterial (◆−◆) and femoral venous (X- - X) plasma [K+] before, during and after knee extension exercise for 10 min at 55% followed by 0.5 min rest and then to exhaustion at 100% VO2max lasting ~ 7 min and 10 min recovery (n = 3, males). From (Sjøgaard et al. 1985). C Sprint exercise-continuous, short duration, high intensity. Arterial (o- - o) and femoral venous (•−•) plasma [K+] before, during and after 1 min exhaustive treadmill running, followed by 9 min recovery (n = 12, males, mean ± standard error of the mean). From (Medbø and Sejersted 1990). The “exercise” sample was taken about 10 s after completion of exercise bout and at 0.3, 1, 3, 6 and 9–10 min recovery. D Intermittent exercise. Arterial plasma [K+] before, during four, 1 min cycling bouts at 100% VO2max, separated by 1 min rest, then 60 min recovery in endurance (o- - o) and sprint trained (•−•) (n = 4 each group, sex not specified). Blood was sampled immediately after exercise bouts as well as in the rest period 30 s before the next bout and in recovery at 1, 2, 5, 10, 20, 30, 40, 50 and 60 min recovery. From (Hermansen et al. 1984). E Incremental exercise. Peak arterial [K+] (•) and femoral venous (--- - -) plasma [K+] before, during incremental cycling, with work rate every 4 min until exhaustion. Data from (Hallén et al. 1994) redrawn in (Hallén 1996). Continuous femoral venous [K+] data collected from a K+-electrode inserted into the vein
Fig. 8
Fig. 8
Histograms of participant characteristics from human exercise and plasma [K+] studies for A) sex and B) number of participants

Similar articles

Cited by

References

    1. Aagaard NK, Andersen H, Vilstrup H, Clausen T, Jakobsen J, Dorup I. Decreased muscle strength and contents of Mg and Na, K-pumps in chronic alcoholics occur independently of liver cirrhosis. J Intern Med. 2003;253(3):359–366. doi: 10.1046/j.1365-2796.2003.01100.x. - DOI - PubMed
    1. Ahlborg B, Bergström J, Ekelund L, Hultman E. Muscle glycogen and muscle electrolytes during prolonged physical exercise. Acta Physiol Scand. 1967;70:129–142. doi: 10.1111/j.1748-1716.1967.tb03608.x. - DOI
    1. Ahmed K, Judah JD. Preparation of lipoproteins containing cation-dependent ATPase. Biochim Biophys Acta. 1964;93:603–613. doi: 10.1016/0304-4165(64)90343-5. - DOI - PubMed
    1. Albers RW, Koval GJ. Sodium-potassium-activated adenosine triphosphatase of electrophorus electric organ. 3. An associated potassium-activated neutral phosphatase. J Biol Chem. 1966;241(8):1896–1898. doi: 10.1016/S0021-9258(18)96720-7. - DOI - PubMed
    1. Al-Khalili L, Yu M, Chibalin AV. Na+, K+-ATPase trafficking in skeletal muscle: insulin stimulates translocation of both a1- and a2-subunit isoforms. FEBS Lett. 2003;536(1–3):198–202. doi: 10.1016/S0014-5793(03)00047-4. - DOI - PubMed

LinkOut - more resources