

Proteomics Analysis of Knee Subchondral Bone Identifies Differentially Expressed Proteins Associated with Osteoarthritis
- PMID: 38206579
- PMCID: PMC10846524
- DOI: 10.1021/acs.jproteome.3c00584
Proteomics Analysis of Knee Subchondral Bone Identifies Differentially Expressed Proteins Associated with Osteoarthritis
Abstract
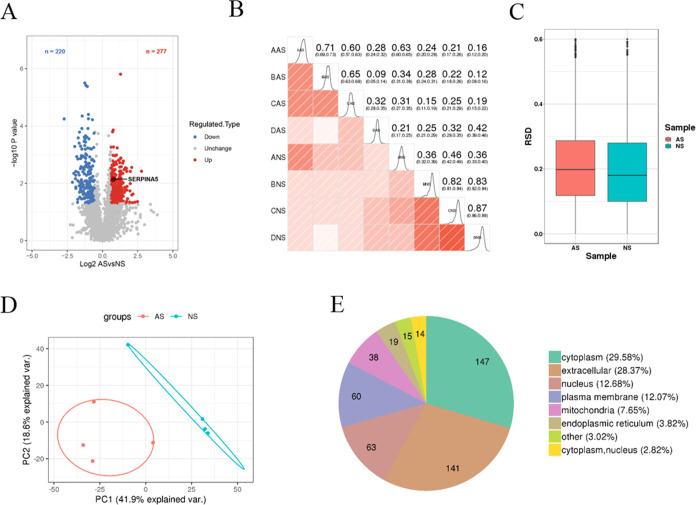
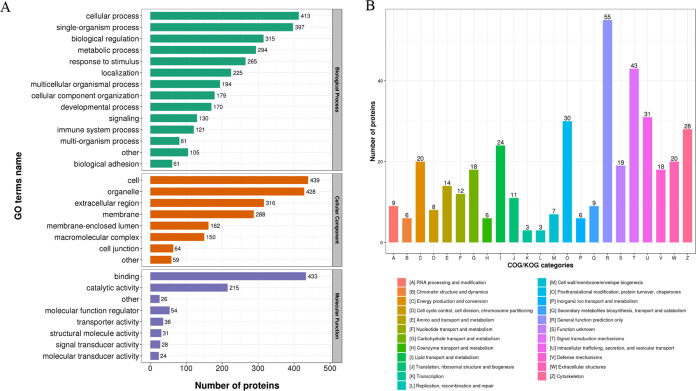
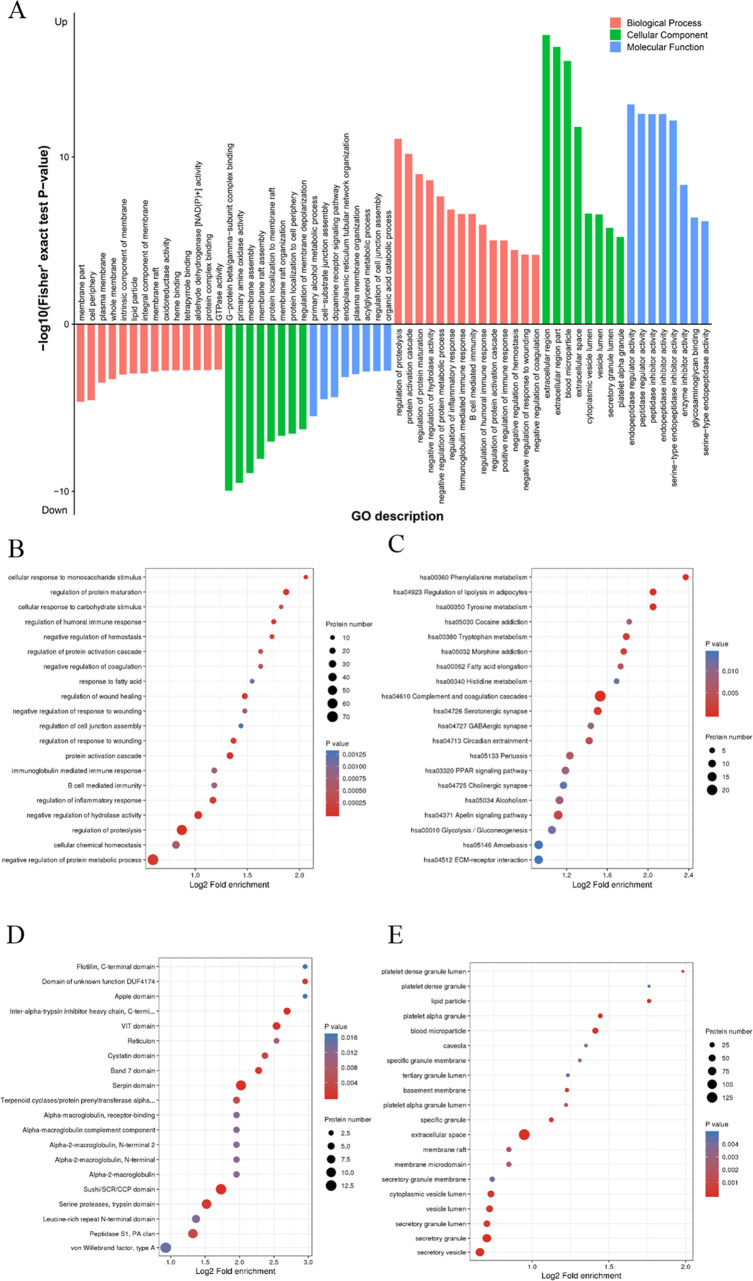
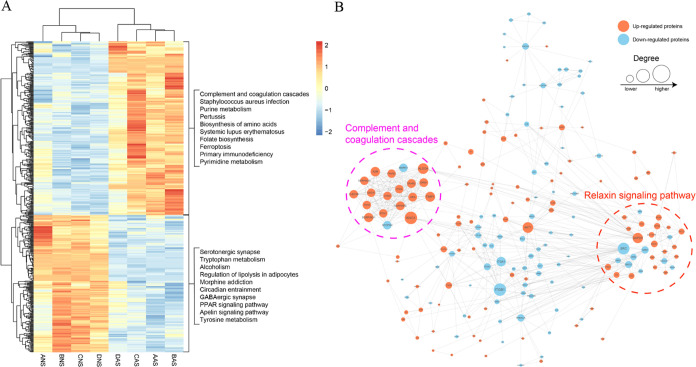
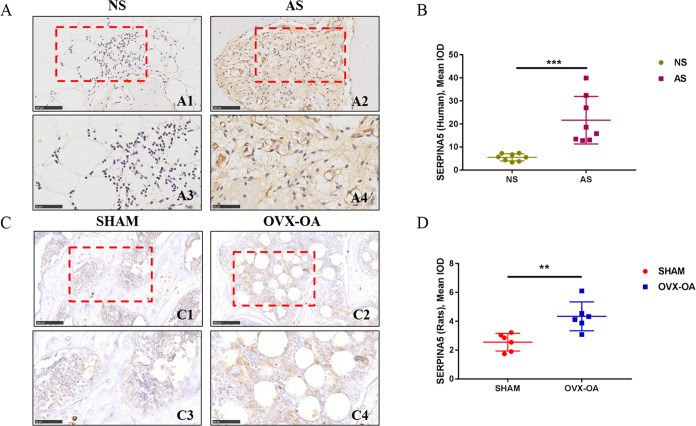
Osteoarthritis (OA) is a prevalent debilitating whole-joint disorder. Currently, a growing number of proteomic studies have been performed to evaluate molecular biomarkers in several tissues from OA patients; however, little is known about the protein profiles in subchondral bone of OA. In this study, proteomic analysis was performed on subchondral bone from patients with OA to identify differentially expressed proteins (DEPs). Bioinformatics tools were used to further investigate these DEPs. Thereafter, DEPs were validated in the samples from patients with OA, as well as in bilateral ovariectomy-induced OA (OVX-OA) rats using immunohistochemistry. A comprehensive subchondral bone proteome profile of patients with OA was constructed. Additionally, biological information analysis showed that a majority of DEPs participated in the dysregulation of the complement and coagulation cascades. The validation experiments suggested that SerpinA5, the protein involved in the complement and coagulation cascades, was significantly increased in severely damaged subchondral bone of patients with OA compared to the control group. Furthermore, the increase of SerpinA5 in OVX-OA rats compared to control rats was also confirmed. Our results indicated that the dysregulation of coagulation and complement pathways plays a role in the progression of OA, and it provides a promising therapeutic target of OA.
Keywords: osteoarthritis; pro-coagulation; proteomic analysis; subchondral bone.
Conflict of interest statement
The authors declare no competing financial interest.
Figures
Similar articles
-
Proteomic analysis of human articular cartilage unravels the dyscoagulation in osteoarthritis and the potential value of serpinA5 as a biomarker for osteoarthritis.Proteomics Clin Appl. 2022 May;16(3):e2100117. doi: 10.1002/prca.202100117. Epub 2022 Jan 5. Proteomics Clin Appl. 2022. PMID: 34964303
-
RNA Sequencing Reveals Interacting Key Determinants of Osteoarthritis Acting in Subchondral Bone and Articular Cartilage: Identification of IL11 and CHADL as Attractive Treatment Targets.Arthritis Rheumatol. 2021 May;73(5):789-799. doi: 10.1002/art.41600. Epub 2021 Mar 21. Arthritis Rheumatol. 2021. PMID: 33258547 Free PMC article.
-
Long non-coding RNA expression profiling of subchondral bone reveals AC005165.1 modifying FRZB expression during osteoarthritis.Rheumatology (Oxford). 2022 Jul 6;61(7):3023-3032. doi: 10.1093/rheumatology/keab826. Rheumatology (Oxford). 2022. PMID: 34730803 Free PMC article.
-
Microenvironment in subchondral bone: predominant regulator for the treatment of osteoarthritis.Ann Rheum Dis. 2021 Apr;80(4):413-422. doi: 10.1136/annrheumdis-2020-218089. Epub 2020 Nov 6. Ann Rheum Dis. 2021. PMID: 33158879 Free PMC article. Review.
-
Targeting TGFβ signaling in subchondral bone and articular cartilage homeostasis.Trends Pharmacol Sci. 2014 May;35(5):227-36. doi: 10.1016/j.tips.2014.03.005. Epub 2014 Apr 15. Trends Pharmacol Sci. 2014. PMID: 24745631 Free PMC article. Review.
Cited by
-
Exploring the Proteomic Landscape of Cochlear Implant Trauma: An iTRAQ-Based Quantitative Analysis Utilizing an Ex Vivo Model.J Clin Med. 2025 Jul 18;14(14):5115. doi: 10.3390/jcm14145115. J Clin Med. 2025. PMID: 40725809 Free PMC article.
-
MMP13 mRNA Expression Level as a Potential Marker for Knee OA Progression-An Observational Study.J Clin Med. 2025 Feb 14;14(4):1263. doi: 10.3390/jcm14041263. J Clin Med. 2025. PMID: 40004793 Free PMC article.
-
Osteoarthritis Year in Review 2024: Molecular biomarkers of osteoarthritis.Osteoarthritis Cartilage. 2025 Jan;33(1):67-87. doi: 10.1016/j.joca.2024.10.003. Epub 2024 Oct 18. Osteoarthritis Cartilage. 2025. PMID: 39427749 Review.
-
Progress in multi-omics studies of osteoarthritis.Biomark Res. 2025 Feb 11;13(1):26. doi: 10.1186/s40364-025-00732-y. Biomark Res. 2025. PMID: 39934890 Free PMC article. Review.
References
-
- Baillet A.; Trocme C.; Berthier S.; Arlotto M.; Grange L.; Chenau J.; Quetant S.; Seve M.; Berger F.; Juvin R.; Morel F.; Gaudin P. Synovial fluid proteomic fingerprint: S100A8, S100A9 and S100A12 proteins discriminate rheumatoid arthritis from other inflammatory joint diseases. Rheumatology 2010, 49 (4), 671–682. 10.1093/rheumatology/kep452. - DOI - PubMed
Publication types
MeSH terms
Substances
LinkOut - more resources
Full Text Sources
Medical
Miscellaneous
