. 2024 Jan 2:13:giad113.
doi: 10.1093/gigascience/giad113.

Computational reproducibility of Jupyter notebooks from biomedical publications

Affiliations

Computational reproducibility of Jupyter notebooks from biomedical publications

Sheeba Samuel et al. Gigascience. .

Abstract

Background: Jupyter notebooks facilitate the bundling of executable code with its documentation and output in one interactive environment, and they represent a popular mechanism to document and share computational workflows, including for research publications. The reproducibility of computational aspects of research is a key component of scientific reproducibility but has not yet been assessed at scale for Jupyter notebooks associated with biomedical publications.

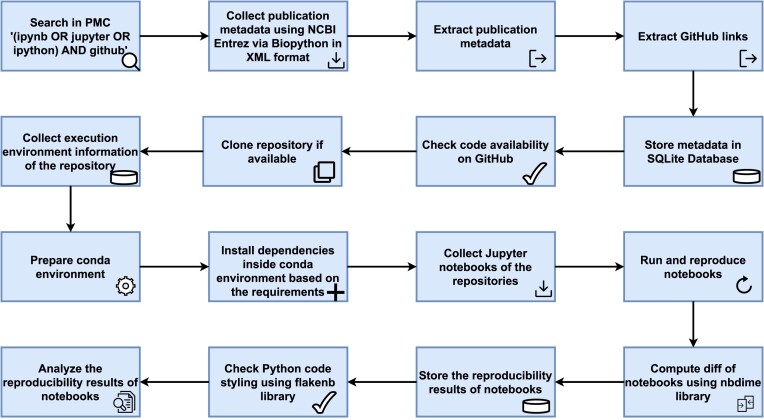
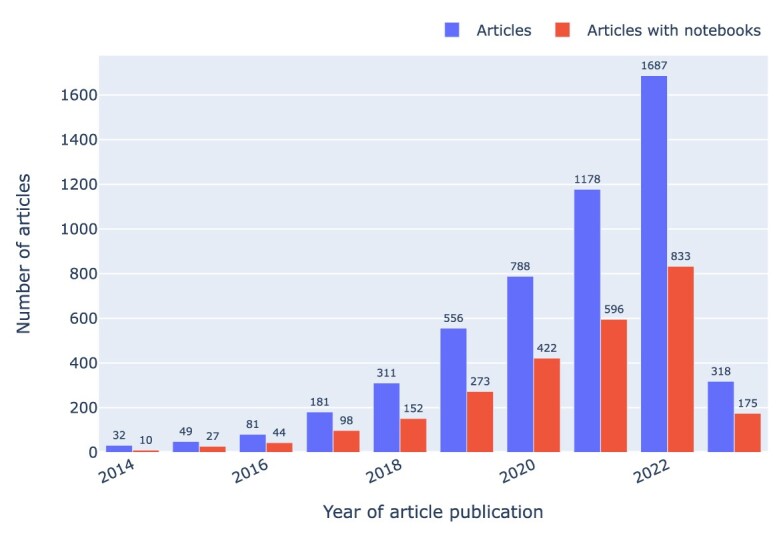
Approach: We address computational reproducibility at 2 levels: (i) using fully automated workflows, we analyzed the computational reproducibility of Jupyter notebooks associated with publications indexed in the biomedical literature repository PubMed Central. We identified such notebooks by mining the article's full text, trying to locate them on GitHub, and attempting to rerun them in an environment as close to the original as possible. We documented reproduction success and exceptions and explored relationships between notebook reproducibility and variables related to the notebooks or publications. (ii) This study represents a reproducibility attempt in and of itself, using essentially the same methodology twice on PubMed Central over the course of 2 years, during which the corpus of Jupyter notebooks from articles indexed in PubMed Central has grown in a highly dynamic fashion.

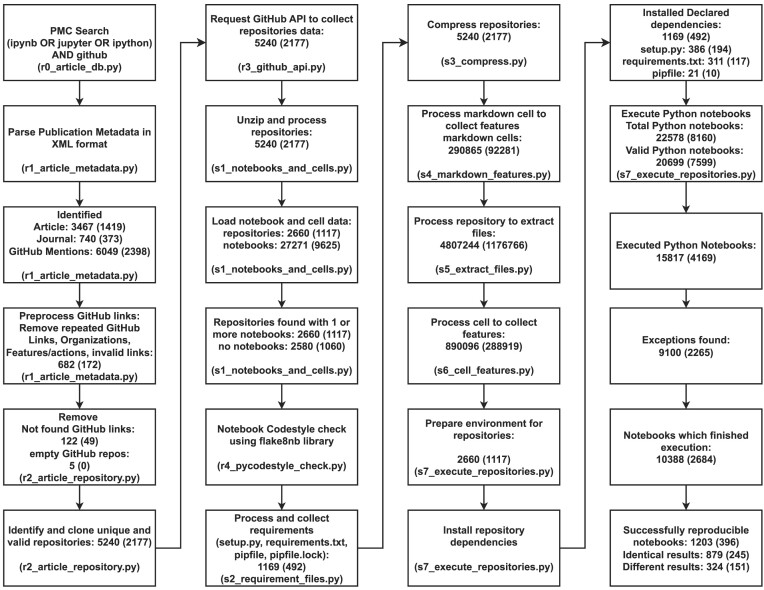
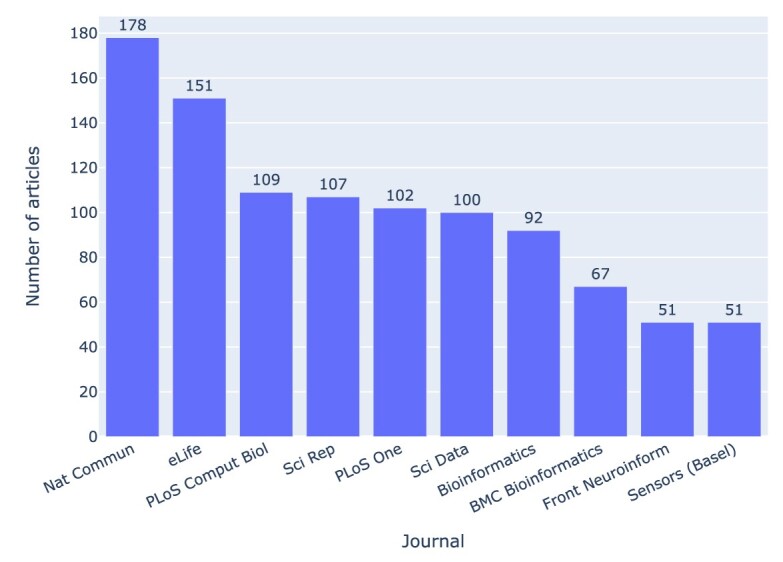
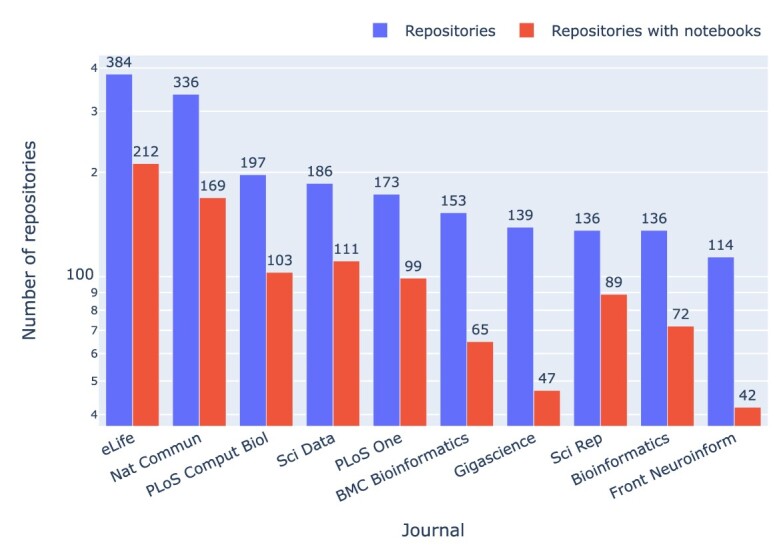
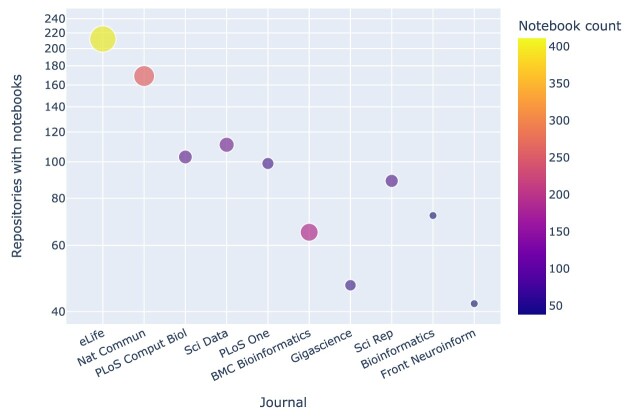
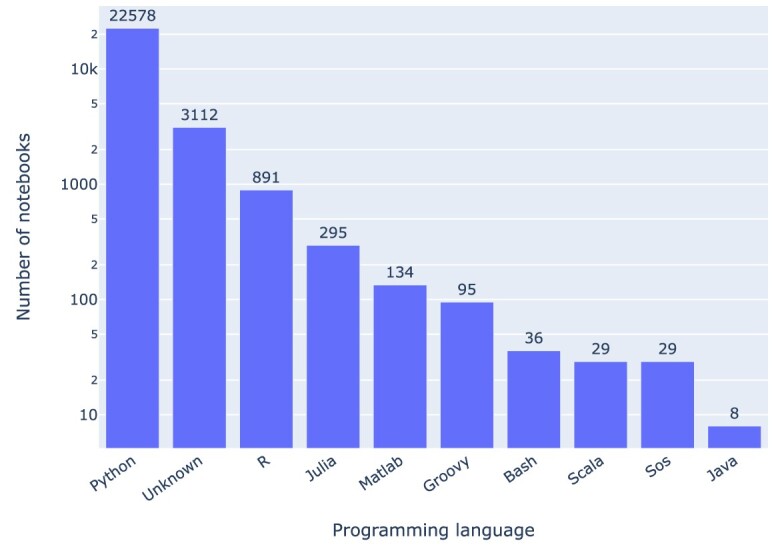
Results: Out of 27,271 Jupyter notebooks from 2,660 GitHub repositories associated with 3,467 publications, 22,578 notebooks were written in Python, including 15,817 that had their dependencies declared in standard requirement files and that we attempted to rerun automatically. For 10,388 of these, all declared dependencies could be installed successfully, and we reran them to assess reproducibility. Of these, 1,203 notebooks ran through without any errors, including 879 that produced results identical to those reported in the original notebook and 324 for which our results differed from the originally reported ones. Running the other notebooks resulted in exceptions.

Conclusions: We zoom in on common problems and practices, highlight trends, and discuss potential improvements to Jupyter-related workflows associated with biomedical publications.

Keywords: GitHub; Jupyter notebooks; PubMed Central; Python; computational reproducibility; dependency decay; workflow documentation.


Conflict of interest statement

The authors declare there are no competing interests.

Figures

Figure 1:
Figure 1:
Fully automated workflow used for assessing the reproducibility of Jupyter notebooks from publications indexed in PubMed Central: the PMC search query resulted in a list of article identifiers that were then used to retrieve the full-text XML, from which publication metadata and GitHub links were extracted and entered into an SQLite database. If the links pointed to valid GitHub (RRID:SCR_002630) repositories containing valid Jupyter notebooks, then metadata about these were gathered, and Python-based notebooks were run with all identifiable dependencies and their results analyzed with respect to the originally reported ones.
Figure 2:
Figure 2:
Key steps of the computational workflow used for the study, illustrated in a way that is partly inspired by the PRISMA flow diagram [101]. Each box contains a brief description of the corresponding step and the numbers of entities tracked at that step. The numbers given in parentheses indicate the results of the initial run of the pipeline in 2021 [86]. The name of the file containing the code for the respective step is indicated at the bottom of its box.
Figure 3:
Figure 3:
Full-text articles from PMC that mention GitHub repositories, grouped by top-level MeSH terms as a proxy for their research field.
Figure 4:
Figure 4:
MeSH terms by the number of GitHub repositories mentioned in our corpus, highlighting (in red) those that contain at least 1 Jupyter notebook.
Figure 5:
Figure 5:
Journals with the highest number of articles that had a valid GitHub repository and at least 1 Jupyter notebook. In the figures, journal names are styled as in the XML files we parsed (e.g., “PLoS Comput Biol”). In the text, we use the full name in its current styling (e.g., “PLoS Computational Biology)”.
Figure 6:
Figure 6:
Journals by the number of GitHub repositories and by the number of GitHub repositories with at least 1 Jupyter notebook.
Figure 7:
Figure 7:
Journals by number of GitHub repositories with Jupyter notebooks. For each journal, the notebook count gives the maximum number of notebooks within a repository associated with an article published in the journal.
Figure 8:
Figure 8:
Articles by number of GitHub repositories, highlighting (in red) those with at least 1 Jupyter notebook, grouped by year of article publication. Note that the articles were mined in early 2023, so data for that year are incomplete. However, since we have included the 2023 data in all the nontimeline plots, we decided to keep them in timelines too.
Figure 9:
Figure 9:
Programming languages of the notebooks. “Unknown” means the language kernel used was not indicated in a standard fashion.
Figure 10:
Figure 10:
Relative proportion of the most frequent programming languages used in the notebooks per year. This analysis includes only programming languages with more than 7 notebooks. In 2023, we observed only 21 Python notebooks, and no other programming languages had more than 7 notebooks.
Figure 11:
Figure 11:
Python notebooks by minor Python version by year of last commit to the GitHub repository containing the notebook. In the legend, the sunset dates for each version are given.
Figure 12:
Figure 12:
Python notebooks by major Python version by year of first commit to the notebook’s GitHub repository.
Figure 13:
Figure 13:
Analysis of the notebook structure across notebooks in our corpus. The x-axis scale in the diagram depicts the distribution of a particular attribute. The box plot showcases the interquartile range (IQR) along with any outliers beyond the whiskers. Annotations highlight values falling below Q1−1.5 IQR and above Q3+1.5 IQR, serving to identify potential outliers.
Figure 14:
Figure 14:
Most frequent notebook titles identified in the rerun results, excluding 1 repository with hundreds of notebooks whose names would otherwise dominate the list.
Figure 15:
Figure 15:
Distribution of notebook title lengths.
Figure 16:
Figure 16:
Top Python modules declared in Jupyter notebooks.
Figure 17:
Figure 17:
Load extension modules in Jupyter notebooks.
Figure 18:
Figure 18:
Dependencies of Juypter notebooks and GitHub repositories. (A, B) GitHub repositories and Jupyter notebooks are shown as to whether they declared their dependencies via any combination of setup.py (red), requirements.txt (green), or a pipfile (pink). (C) The notebooks depending on external modules (green) are plotted against notebooks depending on local modules (red) and notebooks that had both (brown).
Figure 19:
Figure 19:
Exceptions occurring in Jupyter notebooks in our corpus. See Table 5 for information about the nature of these errors and potential fixes.
Figure 20:
Figure 20:
ModuleNotFoundError, ImportError, and FileNotFoundError exceptions by year of publication. Note that data for 2023 are incomplete.
Figure 21:
Figure 21:
Exceptions by year of publication normalized by the number of notebooks associated with articles published that year.
Figure 22:
Figure 22:
Jupyter notebook exceptions by research field, taking as a proxy the highest-level MeSH terms (of which there may be more than 1) of the article associated with the notebook. We did not normalize these values, so as to let the magnitude of the problem speak for itself.
Figure 23:
Figure 23:
Exceptions by journal, normalized by the number of notebooks and sorted by the notebook count and percentage of exceptions. The absolute number of notebooks associated with a journal is presented on top of its bar. As an example, in the journal iScience, 26 exceptions were identified among 1,684 notebooks, accounting for 2% of the total. For context, Gigascience had 116 exceptions in 405 notebooks, giving it an exception percentage of 29%.
Figure 24:
Figure 24:
Exceptions by article type, normalized by the number of notebooks per article type and sorted by the total number of notebooks per article type, which is shown on top of each bar. For example, out of 709 notebooks associated with Tools and Resources articles—published in eLife [111]—13% resulted in exceptions, but there were only 32 such articles in total. The tag AcademicSubjects/SCI00010 is used by Oxford University Press to identify articles in biology, for which the exception rate was about 5 times that of Tools and Resources articles.
Figure 25:
Figure 25:
Analysis of the notebook structure and exceptions. In all 3 panels, “Percentage” represents the percentage of exceptions from notebooks with a given ordinate value relative to the total number of notebooks with that exception.
Figure 26:
Figure 26:
Exceptions by ratio of Markdown to code cells in the corresponding notebooks. “Percentage” represents the percentage of exceptions from notebooks with a given Markdown to code cell value relative to the total number of notebooks associated with that particular exception. For instance, 34% of all FileNoteFoundError exceptions were due to notebooks with a Markdown to code cell ratio of 0 (i.e., without any Markdown cells).
Figure 27:
Figure 27:
Rate of successful reproduction as a function of the age of the repository (relative to 2023). On top of the bars is the total number of notebooks per age cohort. Note that notebooks might be less old than the repository in which they are hosted, but we did not account for that.
Figure 28:
Figure 28:
Reproducibility of notebooks with identical and different results by research field, taking upper-level MeSH terms as a proxy.
Figure 29:
Figure 29:
Scholia panel from the use profile for Jupyter notebook, displaying the results of a Wikidata query for research resources commonly used together with Jupyter notebooks. The magnifying glasses link to uses profiles that display information about co-use of the respective research resource alongside Jupyter notebooks.
Figure 30:
Figure 30:
ORCID usage in our collection. Bars indicate the total number of ORCIDs found each year for authors of articles in our collection. Colors indicate the number of articles that year with Jupyter notebooks. Note that data for 2023 are incomplete.

Similar articles

Cited by

References

    1. Siebert S, Machesky LM, Insall RH. Point of view: overflow in science and its implications for trust. Elife. 2015;4:e10825. 10.7554/eLife.10825. - DOI - PMC - PubMed
    1. Contera S. Communication is central to the mission of science. Nat Rev Mater. 2021;6(5):377–8.. 10.1038/s41578-021-00316-w. - DOI - PMC - PubMed
    1. Gray S, Shwom R, Jordan R. Understanding factors that influence stakeholder trust of natural resource science and institutions. Environm Manag. 2012;49(3):663–74.. 10.1007/s00267-011-9800-7. - DOI - PubMed
    1. Kroeger CM, Garza C, Lynch CJ, et al. Scientific rigor and credibility in the nutrition research landscape. Am J Clin Nutr. 2018;107(3):484. 10.1093/ajcn/nqx067. - DOI - PMC - PubMed
    1. Jamieson KH, McNutt M, Kiermer V, et al. Signaling the trustworthiness of science. Proc Natl Acad Sci. 2019;116(39):19231–6.. 10.1073/pnas.1913039116. - DOI - PMC - PubMed

Publication types