. 2024 Jan 11;134(5):e166149.
doi: 10.1172/JCI166149.

TRIM56 protects against nonalcoholic fatty liver disease by promoting the degradation of fatty acid synthase

Affiliations

TRIM56 protects against nonalcoholic fatty liver disease by promoting the degradation of fatty acid synthase

Suowen Xu et al. J Clin Invest. .

Abstract

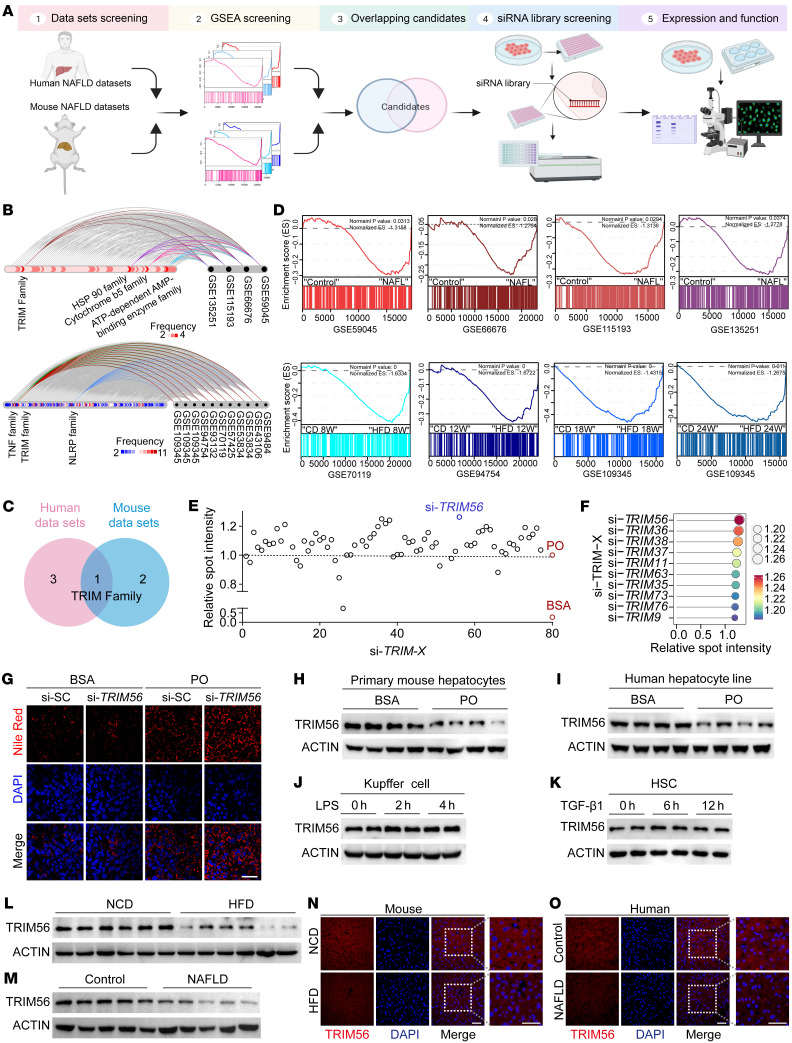
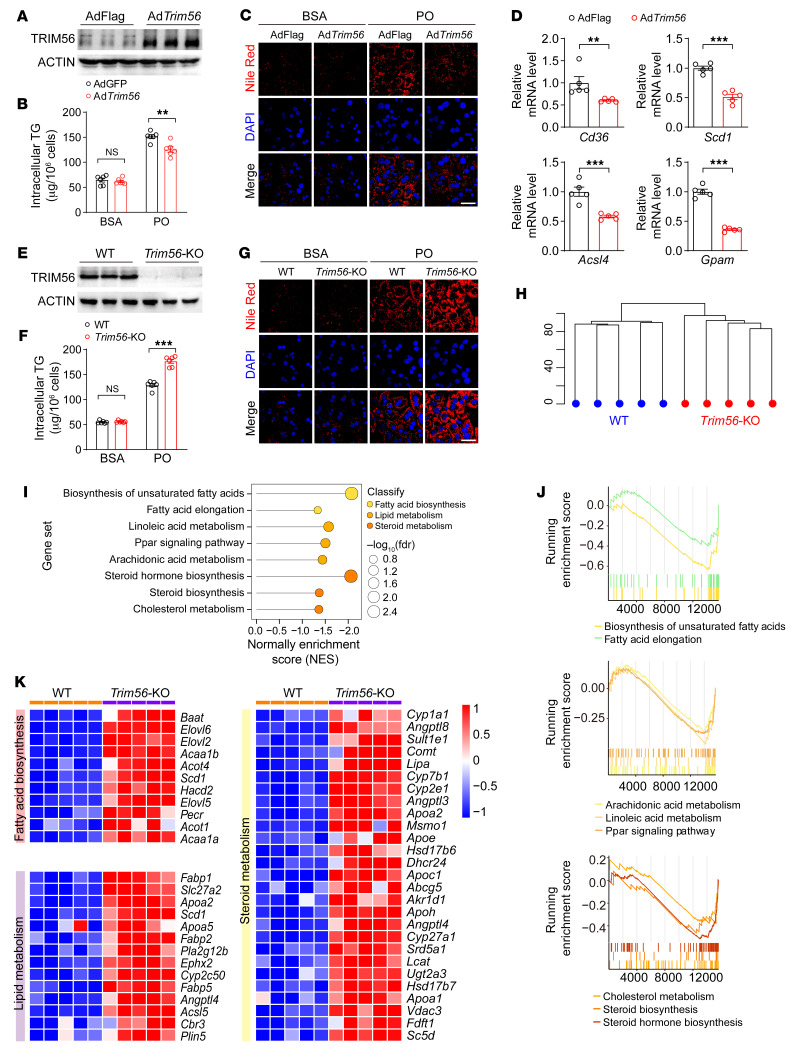
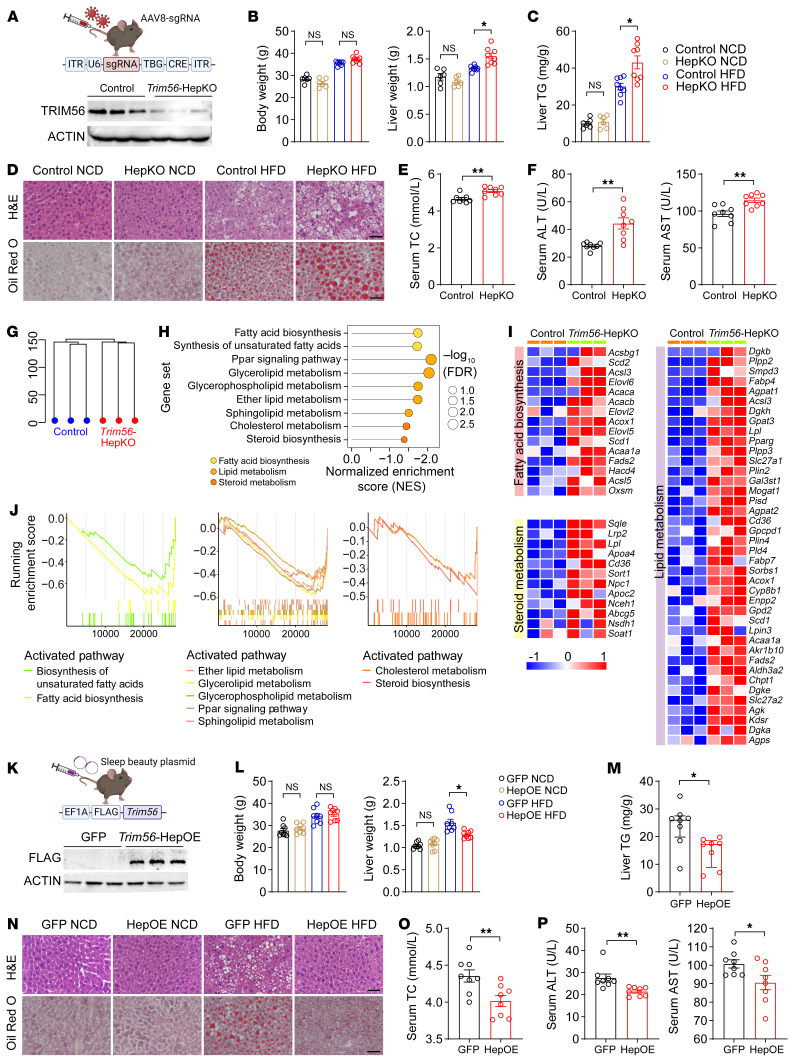
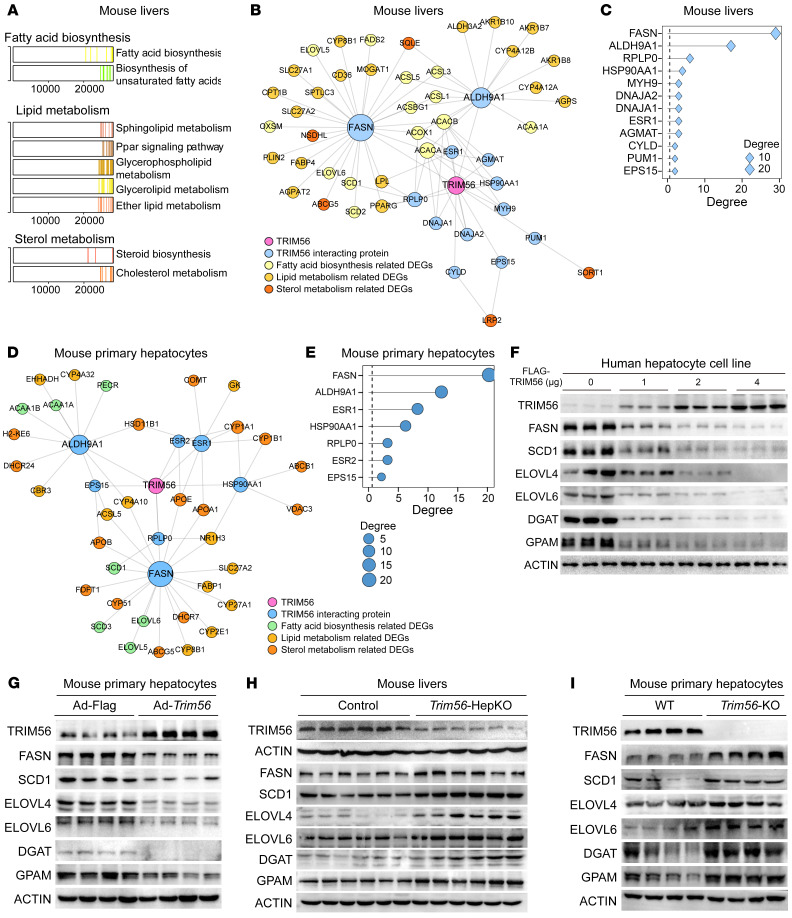
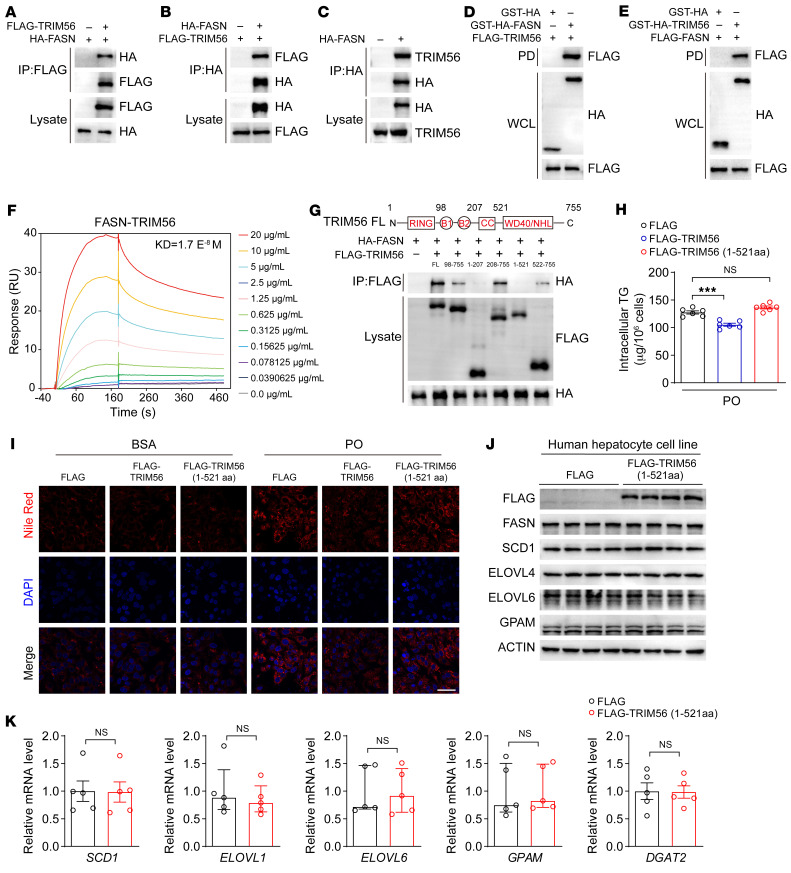
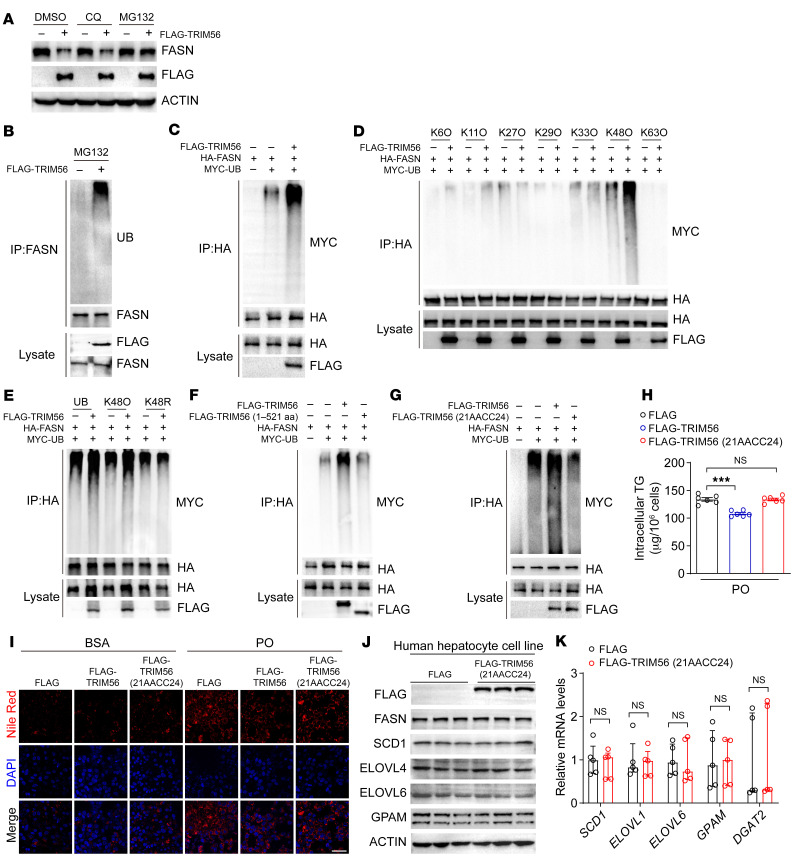
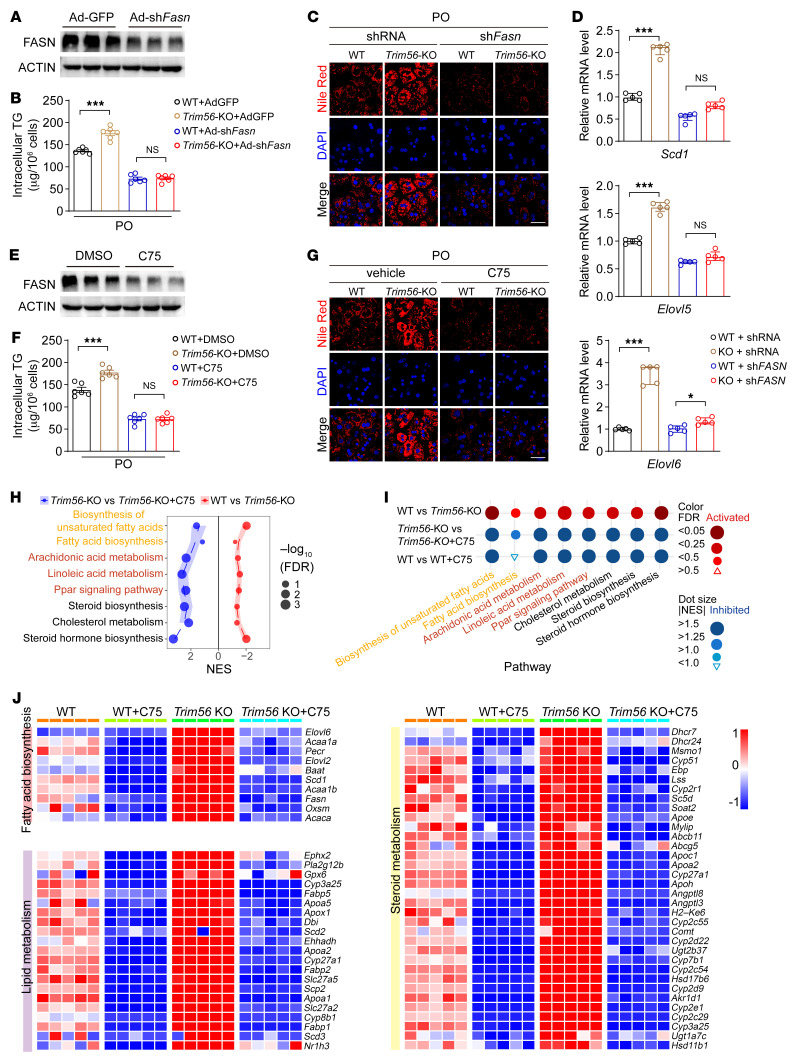
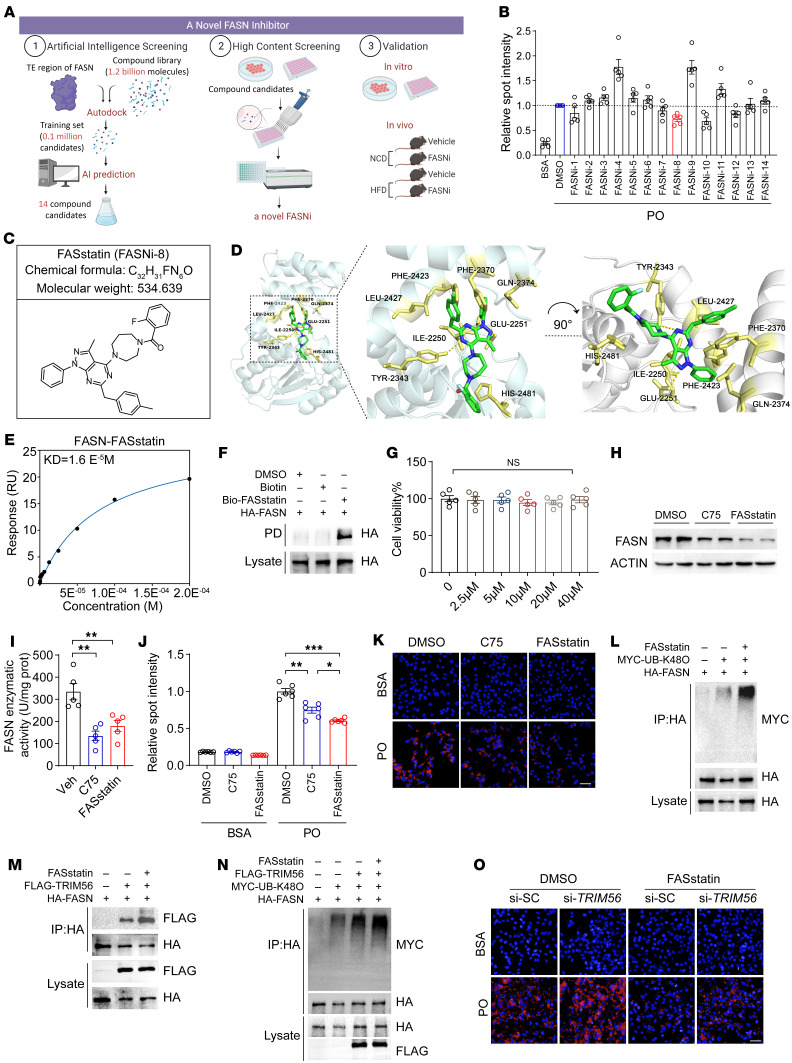
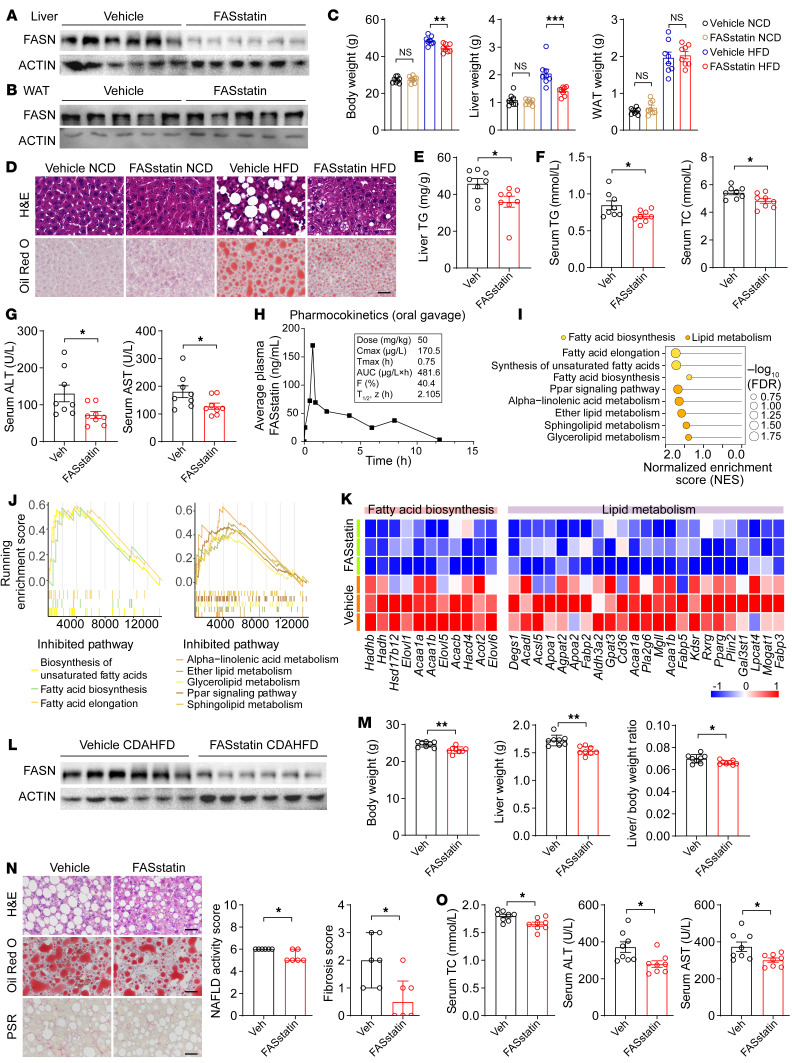
Nonalcoholic fatty liver disease (NAFLD) encompasses a disease continuum from simple steatosis to nonalcoholic steatohepatitis (NASH). However, there are currently no approved pharmacotherapies for NAFLD, although several drugs are in advanced stages of clinical development. Because of the complex pathophysiology and heterogeneity of NAFLD, the identification of potential therapeutic targets is clinically important. Here, we demonstrated that tripartite motif 56 (TRIM56) protein abundance was markedly downregulated in the livers of individuals with NAFLD and of mice fed a high-fat diet. Hepatocyte-specific ablation of TRIM56 exacerbated the progression of NAFLD, while hepatic TRIM56 overexpression suppressed it. Integrative analyses of interactome and transcriptome profiling revealed a pivotal role of TRIM56 in lipid metabolism and identified the lipogenesis factor fatty acid synthase (FASN) as a direct binding partner of TRIM56. TRIM56 directly interacted with FASN and triggered its K48-linked ubiquitination-dependent degradation. Finally, using artificial intelligence-based virtual screening, we discovered an orally bioavailable small-molecule inhibitor of FASN (named FASstatin) that potentiates TRIM56-mediated FASN ubiquitination. Therapeutic administration of FASstatin improved NAFLD and NASH pathologies in mice with an optimal safety, tolerability, and pharmacokinetics profile. Our findings provide proof of concept that targeting the TRIM56/FASN axis in hepatocytes may offer potential therapeutic avenues to treat NAFLD.

Keywords: Hepatology; Ubiquitin-proteosome system.


Figures

Figure 1
Figure 1. Identification of TRIM56 as the key regulator of NAFLD.
(A) Workflow for the discovery of key regulator(s) of NAFLD. (B) Hive plot showing the top protein families associated with NAFLD in RNA-Seq data sets from human (upper panel) and mouse (lower panel) NAFLD data sets. (C) Venn diagram of panel B. (D) GSEA analysis of TRIM protein family members in individuals with NAFL (upper panel) and in mice with NAFLD after HFD feeding for different weeks (lower panel). ES, enrichment score; W, weeks. (E) Scatterplot of Nile Red–stained lipid droplet content in palmitic acid (0.5 mM) and oleic acid–challenged (1.0 mM) (PO-challenged) human hepatocytes after knockdown of TRIM family member proteins) (n = 4). Results for spot intensity relative to that of PO-challenged cells are presented. (F) Lollipop chart of top 10 hit using average fold change as the readout. (G) Representative images of Nile Red staining for TRIM56 knockdown in the presence or absence of PO (n = 3). (H) Western blotting of TRIM56 in mouse primary hepatocytes treated with BSA or PO for 18 hours (n = 4). (I) Western blotting of TRIM56 in HepG2 cells treated with BSA or PO for 18 hours (n = 3). (J) Western blotting of TRIM56 in mouse Kupffer cells that were treated with LPS (1 μg/mL) (n = 3). (K) Western blotting of TRIM56 in isolated primary mouse HSCs were treated with recombinant mouse TGF-β1 (10 ng/mL) for the indicated durations (n = 3). (L) Western blotting of TRIM56 in liver tissues from mice fed a normal chow diet (NCD) or a HFD for 24 weeks (n = 6). (M) Western blotting of TRIM56 in liver samples from individuals with NAFLD or control group (n = 5). (N) Representative immunofluorescence staining for TRIM56 (red) in liver tissues from HFD- and NCD-fed mice (n = 6). TRIM56 (red); DAPI (blue). Scale bars: 50 μm. (O) Representative immunofluorescence staining for TRIM56 (red) in liver tissues from individuals with NAFLD and healthy control individuals (n = 6). Scale bars: 50 μm.
Figure 2
Figure 2. TRIM56 blocks hepatocyte lipid accumulation.
(A) Primary mouse hepatocytes were infected with control adenovirus (AdFLAG) or Trim56 adenovirus (AdTrim56) for 24 hours before Western blotting was performed to determine the extent of TRIM56 overexpression (n = 3). (B) Intracellular TG levels were determined in primary mouse hepatocytes infected with AdFLAG or AdTrim56 in the presence of PO (n = 6). One-way ANOVA followed by Bonferroni’s post hoc test. (C) Primary mouse hepatocytes were infected with AdFLAG or AdTrim56 in the presence of PO. Nile Red staining was performed to visualize lipid droplet accumulation (n = 3). Scale bar: 50 μm. (D) Relative mRNA levels of genes related to fatty acid metabolism (Cd36, Scd1, Acsl4, Gpam) in the indicated groups in the presence of PO (n = 5). Mann-Whitney U test for Cd36; 2-tailed Student’s t test for Scd1, Acsl4, and Gpam. (E) TRIM56 protein expression in hepatocytes isolated from WT and Trim56 global-KO (Trim56-KO) mice (n = 3). (F) Primary hepatocytes were isolated from WT and Trim56-KO mice. Intracellular TG levels were determined in PO-challenged primary hepatocytes (n = 6). One-way ANOVA followed by Tamhane’s T2 analysis. (G) WT or Trim56-KO hepatocytes were treated with PO for 18 hours before Nile Red staining was performed to visualize lipid droplet accumulation (n = 3). Scale bar: 50 μm. (H) Cluster profile of WT and Trim56-KO hepatocytes treated with PO (n = 5). (I) Enriched pathways in Trim56-KO hepatocytes versus WT hepatocytes treated with PO. (J) GSEA analysis of pathways displayed in I. (K) RNA-Seq heatmap analysis of differentially expressed genes between WT and Trim56-KO hepatocytes treated with PO. Differentially expressed genes in pathways of lipid metabolism, fatty acid metabolism, and steroid metabolism are highlighted. **P < 0.01 and ***P < 0.001 (B, D, and F).
Figure 3
Figure 3. Hepatocyte TRIM56 protects against HFD-induced hepatic steatosis.
(A) Scheme for the generation of hepatocyte-specific Trim56-KO mice (Trim56-HepKO) and western blot validation (n = 3). (B) Body weight and liver weight of WT and Trim56-HepKO after 16 weeks of HFD feeding (n = 6 for NCD; n = 8 for HFD). One-way ANOVA followed by Bonferroni’s post hoc test for body weight and Tamhane’s T2 analysis for liver weight. (C) Liver TG content in WT and Trim56-HepKO. after 16 weeks of HFD feeding (n = 6 for NCD; n = 8 for HFD) for B and C. (D) Representative H&E and Oil Red O staining of liver sections from mice indicated groups of the indicated groups (n = 4). Scale bars: 50 μm. (E) Serum TC content of WT and Trim56-HepKO mice after 16 weeks of HFD feeding (n = 8). Two-tailed Student’s t test. (F) Serum ALT and AST levels of the mice after 16 weeks of HFD feeding (n = 8). Two-tailed Student’s t test. (G) Cluster profile of WT and Trim56-HepKO mice fed a HFD for 16 weeks. (H) Enriched pathway analysis of liver tissues from Trim56-HepKO mice versus control mice (n = 3). (I) Heatmap illustrating overrepresented pathways of fatty acid biosynthesis, lipid metabolism, and steroid metabolism genes in liver tissues from Trim56-HepKO mice (n = 3). (J) GSEA showing overrepresentedthat pathways of fatty acid biosynthesis, lipid metabolism, and steroid metabolism genes were overrepresented in liver tissues from Trim56-HepKO mice (n = 3). (K) Scheme for the generation of hepatocyte-specific Trim56-overexpressing mice (Trim56-HepOE) and using Trim56–sleeping beauty plasmid injection. Control mice receive an injection of empty vector. Successful deletion of TRIM56 protein in the liver was verified by Western blotting validation (n = 3). (L) Body weight and liver weight of WT (GFP) and Trim56-HepOE mice after 16 weeks of NCD or HFD feeding (n = 8). One-way ANOVA followed by Bonferroni’s post hoc test for body weight and Tamhane’s T2 analysis for liver weight. (M) Liver TG content in WT and Trim56-HepOE mice after 16 weeks of HFD feeding (n = 8). Mann-Whitney U test. (N) Representative H&E and Oil Red O staining of liver sections from mice in the indicated groups (n = 3). Scale bars: 50 μm. (O) Serum TC content of WT and Trim56-HepOE mice after 16 weeks of HFD feeding (n = 8). Two-tailed Student’s t test. (P) Serum ALT and AST content levels in WT and Trim56-HepOE mice after 16 weeks of HFD feeding (n = 8). Two-tailed Student’s t test. *P < 0.05 and **P < 0.01.
Figure 4
Figure 4. Identification of FASN as a TRIM56 binding partner.
(A) Enriched pathway analysis in Trim56-HepKO mouse liver tissues as revealed by RNA-Seq. (B) Integrated analysis of TRIM56 interactomics and RNA-Seq of the samples described in A. (C) Ranking of candidate proteins interacting with TRIM56 in mouse liver tissues. (D) Integrated analysis of TRIM56 interactomics and RNA-seq of samples from Trim56-KO hepatocytes. (E) Ranking of candidate proteins interacting with TRIM56 in mouse hepatocytes. (F) HepG2 cells were transfected with empty vector (FLAG) or increasing amounts of FLAG-TRIM56 (0, 1, 2, and 4 μg) in the presence of PO before whole-cell lysate was collected for Western blotting to determine protein expression levels in the lipogenesis pathway (SCD1, ELOVL4, ELOVL6, DGAT, and GPAM) (n = 3). (G) Primary mouse hepatocytes were infected with AdFLAG or AdFLAG-Trim56 in the presence of PO before whole-cell lysate was collected for Western blotting to determine the expression of proteins in the lipogenesis pathway (n = 4). (H) Expression of FASN and downstream proteins associated with the lipogenesis pathway in WT and Trim56-HepKO mouse liver tissues under HFD conditions (n = 6). (I) Expression of FASN and downstream lipogenesis-related proteins in WT and Trim56-KO mouse hepatocytes treated with PO (n = 4).
Figure 5
Figure 5. TRIM56 interacts with FASN.
(A and B) Interaction of FLAG-TRIM56 with HA-FASN in HEK293T cells as demonstrated by IP (n = 3). (C) HA-FASN interacted with endogenous TRIM56 in HEK293T (n = 3). (D and E) GST-pulldown assay confirmed the interaction between TRIM56 and FASN in HEK293T cells (n = 3). (F) FASN-TRIM56 direct interaction as determined by SPR analysis. (G) Molecular characterization of FASN interaction with different truncated fragments of TRIM56 in HEK293T cells (n = 3). (H) Determination of intracellular TG content in HepG2 cells transfected with empty vector (FLAG) or FLAG -TRIM56 or the FLAG-TRIM56 (1–521 aa) fragment in the presence of PO (n = 6). ***P < 0.001, by 1-way ANOVA followed by Bonferroni’s post hoc test. (I) HepG2 were transfected with empty vector or FLAG-TRIM56, or FLAG-TRIM56 (1–521 aa) fragment in the presence or absence of PO before Nile Red staining (n = 3). Scale bars: 50 μm. (J) HepG2 cells were transfected with empty vector (FLAG) or FLAG-TRIM56 (1–521 aa) in the presence of PO before whole-cell lysate was collected for Western blotting to determine the expression of proteins related to fatty acid metabolism (n = 3). (K) Expression of the indicated genes in HepG2 cells transfected with empty vector (FLAG) or FLAG-TRIM56 (1–521 aa) in the presence of PO (n = 5). NS, by 2-tailed Student’s t test for SCD1 and DGAT2 and Mann-Whitney U test for ELOVL1, ELOVL6, and GPAM.
Figure 6
Figure 6. TRIM56 promotes FASN degradation.
(A) HepG2 cells were transfected with empty vector or FLAG-TRIM56 in the presence of indicated compounds. FASN protein expression was determined (n = 3). (B) HEK293T cells were transfected with empty vector or FLAG-TRIM56 in the presence of MG132 before IP was performed (n = 3). (C) HEK293T cells were transfected with HA-FASN with or without FLAG-TRIM56 and MYC-ubiquitin before IP was performed (n = 3). (D) HEK293T cells were transfected with HA-FASN in the presence or absence of FLAG-TRIM56 and MYC tagged site-specific ubiquitin mutants. Then, IP was performed (n = 3). (E) HEK293T cells were transfected with HA-FASN with or without FLAG-TRIM56 and MYC-tagged active K48–linked ubiquitin (K48O) or inactive K48–linked ubiquitin (K48R) mutant. Then, IP was performed (n = 3). (F) HEK293T cells were transfected with HA-FASN in the presence or absence of FLAG-TRIM56 (full-length), FLAG-TRIM56 (1–521 aa), and MYC-ubiquitin (UB). Then, IP was performed (n = 3). (G) HEK293T cells were transfected with HA-FASN with or without FLAG-TRIM56, E3 ligase–defective mutant FLAG-TRIM56 (21AACC24), and MYC-UB. Then, IP was performed (n = 3). (H) Intracellular TG content (n = 6). ***P < 0.001, by 1-way ANOVA followed by Bonferroni’s post hoc test. (I) HepG2 cells were transfected with empty vector (FLAG) or FLAG-TRIM56, or FLAG-TRIM56 mutant (21AACC24) with or without PO before Nile Red staining (n = 3). Scale bar: 50 μm. (J) HepG2 cells were transfected with empty vector (FLAG) or FLAG-TRIM56 mutant (21AACC24) to determine the expression of the indicated proteins (n = 3). (K) Expression of the indicated genes in HepG2 transfected with empty vector (FLAG) or FLAG-TRIM56 mutant (21AACC24) in the presence of PO (n = 5). Two-tailed Student’s t test for SCD1 and GPAM; Mann-Whitney U test for ELOVL1, ELOVL6, and DGAT2.
Figure 7
Figure 7. FASN inhibition blocks the effect of Trim56 ablation on lipid accumulation.
(A) Silencing efficiency of adenovirus vector encoding an shRNA against Fasn (Ad-shFasn) in primary mouse hepatocytes. Hepatocytes were infected with control adenovirus (Ad-GFP) or Ad-shFasn (MOI = 2) for 24 hours before whole-cell lysate was collected for Western blotting (n = 3). (B) Primary mouse hepatocytes were isolated from WT and Trim56-KO mice. Then, hepatocytes were infected with Ad-GFP or Ad-shFasn in the presence of PO for 18 hours before intracellular TG levels were determined (n = 6). One-way ANOVA followed by Bonferroni’s post hoc test. (C) Nile Red staining of WT and Trim56-KO hepatocytes treated as described in B (n = 3.). Scale bar: 50 μm. (D) mRNA expression of Scd1, Elovl5, and Elovl6 in hepatocytes from the indicated groups (n = 5). One-way ANOVA followed by Bonferroni’s post hoc test for Elovl5; Kruskal-Wallis test for Scd1 and Elovl6. (E) Effect of the FASN inhibitor C75 on FASN protein expression. Primary mouse hepatocytes were treated with vehicle (0.1%DMSO) or C75 (a pharmacological inhibitor of FASN, 20 μM) for 24 hours (n = 3). (F) Primary mouse hepatocytes were isolated from WT and Trim56-KO mice. Then, hepatocytes were treated with vehicle or C75 (20 μM) in the presence of PO before intracellular TG analysis (n = 6). One-way ANOVA followed by Bonferroni’s post hoc test. (G) Nile Red staining was performed on hepatocytes treated as described in F (n = 3). Scale bar: 50 μm. (H) Enriched pathway analysis in WT and Trim56-KO hepatocytes treated with vehicle control or C75 (20 μM) in the presence of PO (n = 5). (I) Dot analysis of the enriched pathways identified in H (n = 5). (J) Heatmap analysis revealed the expression profile of genes involved in lipid metabolism, fatty acid biosynthesis, and steroid metabolism in WT and Trim56-KO hepatocytes treated with vehicle or C75 (20 μM) (n = 5). *P < 0.05 and ***P < 0.001 (B, D, and F).
Figure 8
Figure 8. AI-based compound screening identifies FASstatin as an inhibitor of FASN.
(A) High-throughput virtual screening workflow for lead compound identification and pharmacological validation. (B) Validation of top 14 hit FASNi by BODIPY staining in a PO-challenged human hepatocyte line (n = 5). (C) Chemical structure of the hit compound FASstatin (FASNi-8). (D) Molecular docking of FASstatin to the thioesterase domain of FASN. (E) Interaction of FASN and FASstatin in a SPR assay. (F) Biotin-labeled FASstatin interacted with FASN in a streptavidin bead–pulldown (PD) assay (n = 3). (G) Cell viability assay of HepG2 cells treated with increasing doses of FASstatin (n = 5). One-way ANOVA. (H) Effects of FASstatin (20 μM) and C75 (20 μM) on FASN protein expression in human hepatocyte lines (n = 3). (I) Effect of FASstatin (20 μM) and C75 (20 μM) on FASN enzyme activity (n = 5). One-way ANOVA followed by Bonferroni’s post hoc test. prot, protein; Veh, vehicle. (J) Effects of FASstatin (20 μM) and C75 (20 μM) on PO-induced lipid accumulation in Huh7 cells (n = 6). One-way ANOVA followed by Tamhane’s T2 analysis. (K) Representative immunofluorescence images of Nile Red staining of Huh7 cells treated as described in H (n = 6). Scale bar: 50 μm. (L) Effect of FASstatin on FASN ubiquitination at Lys 48 in human hepatocyte line (n = 3). (M) FASstatin potentiated TRIM56-FASN interaction in HEK293T cells (n = 3). (N) Effect of FASstatin on TRIM56-mediated, K48-linked ubiquitination of FASN in human hepatocyte line (n = 3). (O) Effect of FASstatin on PO-induced lipid accumulation (revealed by Nile Red staining) in TRIM56-depleted hepatocytes. si-SC, scrambled siRNA (n = 3). Scale bar: 50 μm. *P < 0.05, **P < 0.01, and ***P < 0.001 (G, I, and J).
Figure 9
Figure 9. FASstatin protects against NAFLD and NASH with good safety and oral bioavailability.
(A and B) The NAFLD model was established by feeding male C57BL/6J mice a HFD for 16 weeks. Thereafter, mice were orally administered vehicle or FASstatin (50 mg/kg/d) for an additional 8 weeks, concurrently with HFD feeding. FASN protein expression in livers and white adipose tissue (WAT) of NAFLD mice treated with vehicle or FASstatinin 2 groups of mice (n = 5–6, 6). (B) Western blot analysis of FASN protein expression in WAT of NAFLD mice treated with vehicle or FASstatin as described in A (n = 5). (C) Body weight, liver weight, and WAT weight of mice as described in A (n = 8). One-way ANOVA followed by Bonferroni’s post hoc test. (D) Representative images of H&E-stained (top) and Oil Red O–stained staining(bottom) of liver sections from 2 groups of miceNCD- or HFD-fed mice treated with vehicle or FASstatin for 8 weeks (n = 6). Scale bars: 50 μm. (E) TG content per gram of liver from the indicated groups of mice fed a HFDdetermination (n = 8). Two-tailed Student’s t test. (F) Serum levels of TG and TC in vehicle- and FASstatin-treated mice (n = 8). Two-tailed Student’s t test. (G) Serum levels of ALT and AST in vehicle- and FASstatin-treated mice (n = 8). Two-tailed Student’s t test. (H) Pharmacokinetic characterization of FASstatin in the plasma of C57BL/6J mice after a single dose of FASstatin administered via oral gavage (50 mg/kg). Plasma was harvested at the indicated time point, and the concentration-time curve (T1/2) was plotted (n = 3). The bioavailability factor (F) was calculated. (I) Pathway enrichment analysis of liver tissues from vehicle- or FASstatin-treated mice fed a HFD (n = 3). (J) GSEA analysis of the indicated pathways (n = 3). (K) Heatmap analysis of differentially expressed genes in liver tissues from HFD mice treated with vehicle or FASstatin (n = 3). (L) Effect of FASstatin on FASN protein expression in liver tissues from mice fed a CDAHFD (n = 6). Male C57BL/6J mice were fed a CDAHFD for 2 weeks before treatment with vehicle or FASstatin (50 mg/kg/d, i.g.) for an additional 4 weeks. (M) Effect of FASstatin on liver weight, body weight and the liver weight/body weight ratio in mice fed a CDAHFD as described in L (n = 8). Two-tailed Student’s t test. (N) Effect of FASstatin on liver pathology (H&E staining), hepatic steatosis (Oil Red O staining), and fibrogenesis (Picrosirius red staining of vehicle- and FASstatin-treated NASH mice). NAS and fibrosis score was calculated (n = 6). Scale bars: 50 μm. Mann-Whitney U test. (O) Effect of FASstatin on serum TC, ALT, and AST levels (n = 8). Two-tailed Student’s t test (EG, M, and O). *P < 0.05, **P < 0.01, and ***P < 0.001 (C, EG, and MO).

Similar articles

Cited by

References

    1. Powell EE, et al. Non-alcoholic fatty liver disease. Lancet. 2021;397(10290):2212–2224. doi: 10.1016/S0140-6736(20)32511-3. - DOI - PubMed
    1. Eslam M, et al. A new definition for metabolic dysfunction-associated fatty liver disease: An international expert consensus statement. J Hepatol. 2020;73(1):202–209. doi: 10.1016/j.jhep.2020.03.039. - DOI - PubMed
    1. Rinella ME, et al. A multi-society Delphi consensus statement on new fatty liver disease nomenclature. J Heptol. 2023;78(6):1966–1986. doi: 10.1097/HEP.0000000000000520. - DOI - PMC - PubMed
    1. Bugianesi E, Petta S. Global burden of NAFLD and NASH: trends, predictions, risk factors and prevention. Nat Rev Gastroenterol Hepatol. 2022;15(1):11–20. doi: 10.1038/nrgastro.2017.109. - DOI - PubMed
    1. Cazanave SC, et al. Peptide-based urinary monitoring of fibrotic nonalcoholic steatohepatitis by mass-barcoded activity-based sensors. Sci Transl Med. 2021;13(616):eabe8939. doi: 10.1126/scitranslmed.abe8939. - DOI - PubMed