. 2024 Apr 11;110(4):819-833.
doi: 10.1093/biolre/ioae001.

Uterine injury during diestrus leads to placental and embryonic defects in future pregnancies in mice†

Affiliations

Uterine injury during diestrus leads to placental and embryonic defects in future pregnancies in mice†

Elisa T Zhang et al. Biol Reprod. .

Abstract

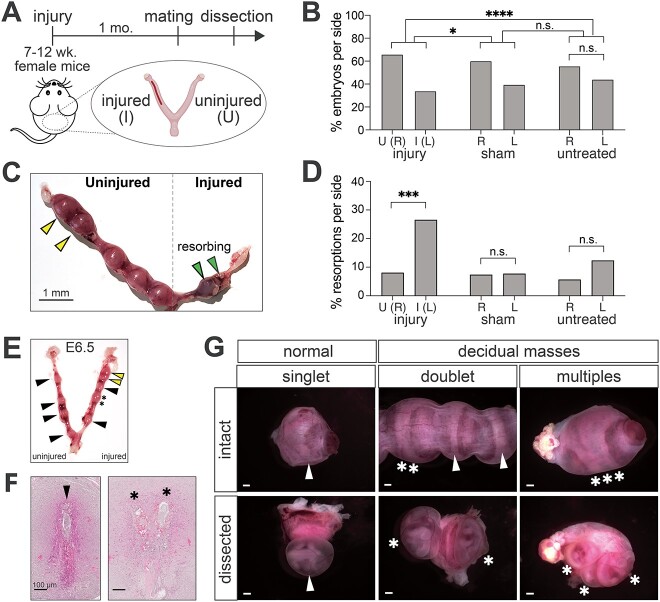
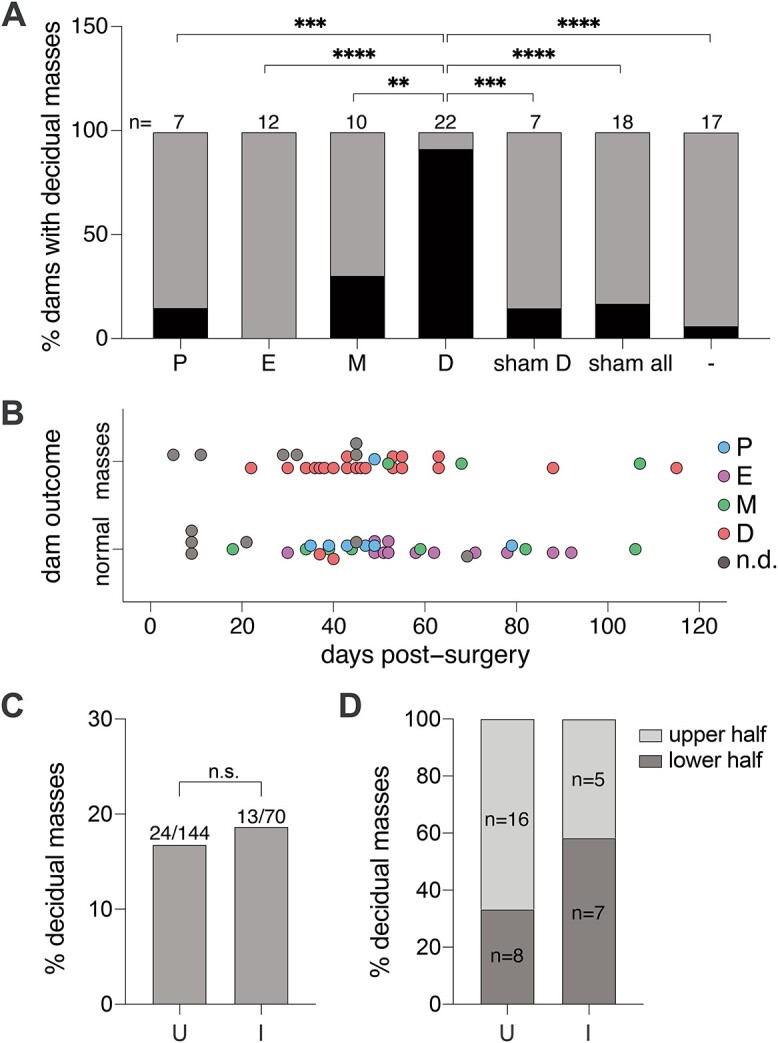
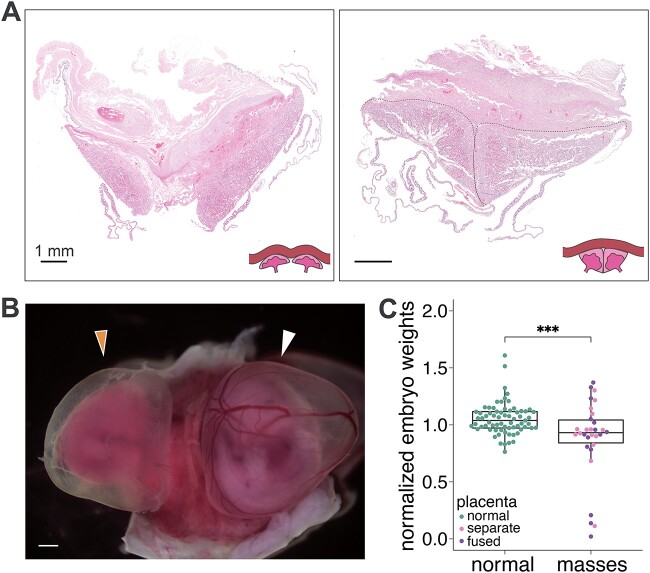
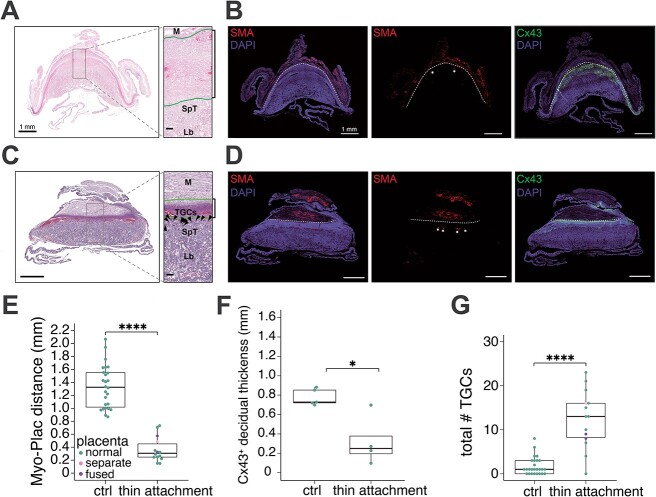
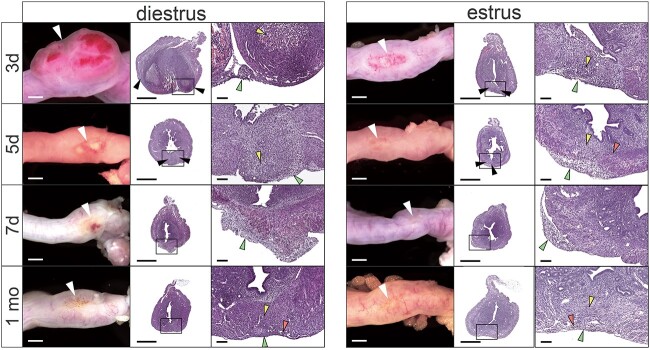
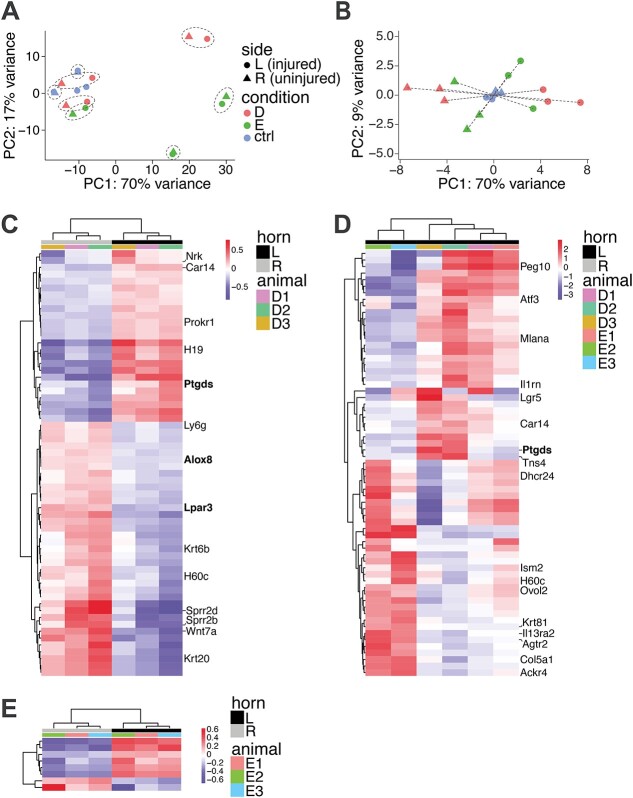
Uterine injury from procedures such as Cesarean sections (C-sections) often have severe consequences on subsequent pregnancy outcomes, leading to disorders such as placenta previa, placenta accreta, and infertility. With rates of C-section at ~30% of deliveries in the USA and projected to continue to climb, a deeper understanding of the mechanisms by which these pregnancy disorders arise and opportunities for intervention are needed. Here we describe a rodent model of uterine injury on subsequent in utero outcomes. We observed three distinct phenotypes: increased rates of resorption and death, embryo spacing defects, and placenta accreta-like features of reduced decidua and expansion of invasive trophoblasts. We show that the appearance of embryo spacing defects depends entirely on the phase of estrous cycle at the time of injury. Using RNA-seq, we identified perturbations in the expression of components of the COX/prostaglandin pathway after recovery from injury, a pathway that has previously been demonstrated to play an important role in embryo spacing. Therefore, we demonstrate that uterine damage in this mouse model causes morphological and molecular changes that ultimately lead to placental and embryonic developmental defects.

Keywords: C-section; embryo spacing; injury; placenta accreta; placenta previa; pregnancy; uterus; wound healing.


Figures

Figure 1
Figure 1
Uterine injury in mice leads to fewer implanting embryos, more resorptions, and embryo spacing defects. (A) Schematic showing timeline of surgical procedure, mating, and analysis. (B) Percentage of total embryos in the injured (I or Left (L)) or uninjured (U or Right (R)) uterine horns in animals subjected to surgeries (injury), to sham surgeries (sham), or to no treatment (untreated). (*) p < 0.05, (****) p < 0.0001, n.s. = not significant based on a one-sample proportions test compared with theoretical 0.5 proportion of embryos per horn. (C) E12.5 uterus showing the presence of resorbed embryos in the injured uterine horn. Scale bar = 1 mm. (D) Percentage of embryos that are resorbed in the injured (I or L) or uninjured (U or R) horns in animals subjected to surgeries (injury), to sham surgeries (sham), and to no treatment (untreated). (***) p < 0.001, n.s. = not significant based on the two-sample test for equality of proportion. (E) Uterus showing the presence of misspaced embryos at E6.5. Embryos that have implanted as a decidual mass are indicated with stars. Other abnormally spaced embryos are indicated with yellow arrows. (F) H&E-stained sections of embryos from (E) showing a normal, singlet implantation site (left; embryo indicated with black arrow) and a decidual mass containing a doublet of embryos (right; embryos indicated with stars). Scale bar = 100 μm. (G) Images showing intact, undissected uteri (top row) and dissected samples (bottom row) with normal singlets (arrows) or decidual masses containing a shared decidua capsularis (stars). Implantation sites contain either a single embryo (left), a doublet (middle), or a triplet (right) at E12.5 are shown. Scale bar = 1 mm.
Figure 2
Figure 2
Embryo spacing defects are dependent upon phase of the estrous cycle at time of injury. (A) Percentage of dams displaying embryo spacing defects (black) after injury during proestrus (P), estrus (E), metestrus (M), or diestrus (D), or after sham surgery during diestrus (sham D), during all phases (sham all), or in untreated controls (−). (*) p < 0.05, (**) p < 0.01, (***) p < 0.001, and (****) p < 0.0001 based on two-sample tests for equality of proportion. (B) Graph plotting effect of the estrous cycle at the time of injury with the eventual appearance of decidua masses in pregnant dams from 0 to 120 days post-surgery. Number of days post-injury is counted between date of surgery and date of plug (E0.5). Estrous phases are indicated as described in (A). n.d. = not determined. (C) Percentage of embryos contained in decidual masses in either the uninjured (U; right) or injured (I; left) horns. n.s. = not significant, based on two-sample test for equality of proportion. (D) Percentage of decidual masses in the upper (light gray) compared with lower (dark gray) halves of each uterine horn (U = uninjured, I = injured).
Figure 3
Figure 3
Embryo spacing defects affect placentation and embryogenesis. (A) H&E-stained sections of E12.5 decidual masses containing separate (left) and fused (right; dashed gray lines) placentas. (B) Representative image of E12.5 embryos within a decidual mass containing one underdeveloped embryo (left, orange arrow) and one normal embryo (right, white arrow). Scale bar = 1 mm. (C) Box-and-whisker plot showing normalized weights of embryos collected at E11.5–E14.5 relative to mean litter embryo weight. Embryos not in decidua masses (normal; green dots) compared with embryos within decidual masses (masses; either pink or purple dots). Pink dots represent placentas in decidual masses that remain separate. Purple dots represent placentas in decidual masses that are fused. (***) p < 0.001 based on a two-tailed Student t-test.
Figure 4
Figure 4
Uterine injury leads to placentas with features of PAS. (A) H&E-stained section of a normal E12.5 placenta attached to the uterus. Myometrium (M), SpT, and labyrinth (Lb) are indicated. Green lines mark the myometrial (top) and placental (bottom) boundaries. Scale bar = 1 mm; inset scale bar = 100 μm. (B) IF staining of an adjacent serial section of the normal E12.5 placenta and uterus shown in (A). SMA = smooth muscle actin to mark myometrium, Cx43 = Connexin 43 to mark decidual stromal cells. Dashed white lines mark the myometrial boundary. Asterisks mark nonspecific background staining from the anti-rabbit secondary antibody. Scale bar = 1 mm. (C) H&E-stained section of an E12.5 placenta with a thin attachment and expanded numbers of TGCs. Myometrium (M), SpT, TGCs, and labyrinth (Lb) are indicated. Green lines mark the myometrial (top) and placental (bottom) boundaries. Scale bar = 1 mm; inset scale bar = 100 μm. (D) IF staining of an adjacent serial section of the placenta and uterus shown in (B). SMA = smooth muscle actin to mark myometrium, Cx43 = Connexin 43 to mark decidual stromal cells. Dashed white lines mark the myometrial boundary. Asterisks mark nonspecific background staining from the anti-rabbit secondary antibody. Scale bar = 1 mm. (E) Box-and-whisker plot of the distances between the myometrium and the placenta (Myo-Plac distance) of E12.5 normal placentas from control dams (ctrl) and affected placentas from injured dams (thin attachment). (****) p < 0.0001 based on a Welch t-test. (F) Box-and-whisker plot of the thicknesses of the Cx43+ decidua in a subset of ctrl (n = 4) and affected (thin attachment; n = 4) placental-myometrial units quantified in (E). (G) Box-and-whisker plot of total number of TGCs in the middle third of normal E12.5 placentas from control dams (ctrl) and affected placentas from injured dams (thin attachment). (****) p < 0.0001 based on a Welch t-test.
Figure 5
Figure 5
Uterine wound healing properties depend on estrous phase at time of injury. Images (left) and corresponding H&E-stained sections (right) of uteri injured during either diestrus or estrus, with time of recovery indicated on the far left. White arrows indicate scar site. Black arrows indicate myometrial borders at the sites of prior incision. Green arrows indicate scar tissue. Yellow arrows indicate areas of inflammation with lymphocytes, and red arrows indicate hemosiderin. Scale bar = 1 mm; inset scale bar = 100 μm.
Figure 6
Figure 6
RNA-seq reveals molecular signatures of diestrus injury. (A) PCA plot of RNA-seq samples. Samples from the two uterine horns of the same dam are indicated with dotted gray lines. The injured (L) uterine horn of each dam is indicated by a triangle; the uninjured (R) uterine horn is indicated by a circle. Dams in diestrus (D) or estrus (E) at time of surgery are indicated in red and green, respectively. Control dams are colored in blue. (B) PCA plot of samples after correcting for individual variation. (C) Heat map showing DEGs between the diestrus-injured and -uninjured uterine horns with a fold-change > 2. COX/prostaglandin pathway genes are shown in bold. (D) Heat map showing DEGs between the diestrus-injured and estrus-injured uterine horns with a fold-change > 2. COX/prostaglandin pathway genes are shown in bold. (E) Heat map showing DEGs between the estrus-injured and -uninjured uterine horns with a fold-change > 2.

Similar articles

Cited by

References

    1. Jauniaux E, Gronbeck L, Bunce C, Langhoff-Roos J, Collins SL. Epidemiology of placenta previa accreta: a systematic review and meta-analysis. BMJ Open 2019; 9:e031193. - PMC - PubMed
    1. Wortman AC, Alexander JM. Placenta accreta, increta, and percreta. Obstet Gynecol Clin North Am 2013; 40:137–154. - PubMed
    1. Fitzpatrick KE, Sellers S, Spark P, Kurinczuk JJ, Brocklehurst P, Knight M. Incidence and risk factors for placenta accreta/increta/percreta in the UK: a national case-control study. PloS One 2012; 7:e52893. - PMC - PubMed
    1. Silver RM, Barbour KD. Placenta accreta spectrum: accreta, increta, and percreta. Obstet Gynecol Clin North Am 2015; 42:381–402. - PubMed
    1. Wu S, Kocherginsky M, Hibbard JU. Abnormal placentation: twenty-year analysis. Am J Obstet Gynecol 2005; 192:1458–1461. - PubMed