. 2024 Jan 11;22(1):e3002464.
doi: 10.1371/journal.pbio.3002464. eCollection 2024 Jan.

Retinoic acid signaling regulates spatiotemporal specification of human green and red cones

Affiliations

Retinoic acid signaling regulates spatiotemporal specification of human green and red cones

Sarah E Hadyniak et al. PLoS Biol. .

Abstract

Trichromacy is unique to primates among placental mammals, enabled by blue (short/S), green (medium/M), and red (long/L) cones. In humans, great apes, and Old World monkeys, cones make a poorly understood choice between M and L cone subtype fates. To determine mechanisms specifying M and L cones, we developed an approach to visualize expression of the highly similar M- and L-opsin mRNAs. M-opsin was observed before L-opsin expression during early human eye development, suggesting that M cones are generated before L cones. In adult human tissue, the early-developing central retina contained a mix of M and L cones compared to the late-developing peripheral region, which contained a high proportion of L cones. Retinoic acid (RA)-synthesizing enzymes are highly expressed early in retinal development. High RA signaling early was sufficient to promote M cone fate and suppress L cone fate in retinal organoids. Across a human population sample, natural variation in the ratios of M and L cone subtypes was associated with a noncoding polymorphism in the NR2F2 gene, a mediator of RA signaling. Our data suggest that RA promotes M cone fate early in development to generate the pattern of M and L cones across the human retina.


Conflict of interest statement

The authors have declared that no competing interests exist.

Figures
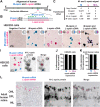
Fig 1
Fig 1. An in situ hybridization approach distinguishes M-opsin and L-opsin mRNA.
(A) Alignment of human M-opsin and L-opsin mRNA. Green bar = nucleotide difference. Horizontal pink and blue lines = location of in situ hybridization probes. (B) Alignment of portions of exon 5 from M- and L-opsin. In situ hybridization probes target mRNA sequences, indicated by blue (M-opsin) and pink (L-opsin) boxes. Green arrowheads indicate 8 nucleotide differences. Dots indicate nucleotide alignment between the opsins. (C–H) HEK293 cells probed for M-opsin mRNA (blue) and L-opsin mRNA (pink). Insets = schematic of transfected plasmid. Cells that did not express M-opsin mRNA or L-opsin mRNA were not quantified. (C) Quantification of transfected HEK293 cells expressing M-opsin mRNA only, L-opsin mRNA only, or M-opsin mRNA and L-opsin mRNA for the conditions in (D–H). (D–H) Brightfield images of cells with: (D) No plasmid transfected. (E) Transfection of a plasmid driving M-opsin. (F) Transfection of a plasmid driving L-opsin. (G) Transfection of either a plasmid driving M-opsin or a plasmid driving L-opsin independently and then the cells were mixed. (H) Transfection of both a plasmid driving M-opsin and a plasmid driving L-opsin. (I) Visualization of M-opsin mRNA, L-opsin mRNA, and M-/L-opsin protein (black) in HEK293 cells transfected with both a plasmid driving M-opsin and a plasmid driving L-opsin. M-opsin (blue) and L-opsin (pink). Blue arrow indicates a cell expressing M-opsin mRNA only. Pink arrows indicate cells expressing L-opsin mRNA only. Purple arrow indicates a cell expressing both M-opsin mRNA and L-opsin mRNA. Black arrow indicates an untransfected cell. Cells were identified based on nuclear Hoechst staining (S1A Fig). With this combined RNA in situ hybridization/immunohistochemistry approach, the mRNA signal was reduced, when compared to the mRNA signal observed when RNA in situ hybridization was conducted alone (Fig 1H). (J) Quantification of M-/L-opsin mRNA and M/L-opsin protein expression in transfected HEK293 cells (I). Original data sets are in S1 Data. (K) Quantification of M-/L-opsin mRNA and M/L-opsin protein expression in adult human retina (L). Original data sets are in S1 Data. (L) Visualization of M-opsin mRNA, L-opsin mRNA, and M-/L-opsin protein in cone cells in an adult human retina. M-opsin (blue) and L-opsin (pink). No cones co-expressed M-opsin mRNA and L-opsin mRNA. ONL, outer nuclear layer; OPL, outer plexiform layer; INL, inner nuclear layer. Cell boundaries were determined by identifying layers from a nuclear Hoechst stain (S1B Fig) and analyzing opsin protein immunohistochemistry signal from the ONL to the OPL.
Fig 2
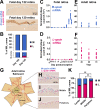
Fig 2. Expression of M-opsin mRNA and L-opsin mRNA in fetal and adult human retinas.
(A) 20 μm sections of 122-day-old and 130-day-old human fetal retinas. M-opsin (blue) and L-opsin (pink). White arrow indicates L-opsin-expressing cell. (B) Quantification of % M and L cones in 122-day-old and 130-day-old human fetal retinas. (C–F) M- and L-opsin mRNA expression in developing human fetal retinas and adult retinas. Values indicate total pileup count, normalized to total read count. Each data point indicates detection of M- or L-opsin mRNAs, based an individual nucleotide difference. N = 1 for each time point, except 94–2 where N = 2. 52/54 = exact date is unclear. Analyzed from [16,17]. Original data sets are in S2 Data. (C) M-opsin mRNA in fetal retinas. (D) L-opsin mRNA in fetal retinas. (E) M-opsin mRNA in adult retinas. (F) L-opsin mRNA in adult retinas. (G) Schematic of adult human retina with regions isolated using a 5 mm biopsy punch. White circle = optic nerve. Red lines = blood vessels. Yellow circle = macular pigment. (H–J) 20 μm sections were probed for M-opsin (blue) and L-opsin (pink) mRNA. (K) Average ratios of M and L cones as percent of M/L total cones across 3 individuals. One-way ANOVA with Tukey’s multiple comparisons test: Center L versus Middle L = no significance; Center L versus Periphery L p < 0.01; Middle L versus Periphery L p < 0.01. ** Indicates p < 0.01. Original data sets are in S2 Data.
Fig 3
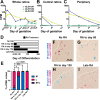
Fig 3. RA signaling induces M-opsin and inhibits L-opsin early in human retinal organoids.
(A–C) Expression of ALDH1A1, ALDH1A2, and ALDH1A3 in fetal human retinas by day of gestation and retinal region. CPM, log counts per million. Analyzed from [16]. Error bars for the 2 samples from fetal day 94 indicate SEM. Original data sets are in S3 Data. (A) Whole retina. (B) Central retina. (C) Periphery. (D) Black bars indicate temporal windows of 1.0 μm RA addition during retinal organoid culture. (E) Quantification of M and L cone ratios for RA treatments. For “No RA,” N = 3; for “RA to day 60,” N = 6; for “RA to day 130,” N = 3; and for “Late RA,” N = 5. One-way ANOVA with Dunnett’s multiple comparisons test: “No RA” L-opsin versus “RA to day 60” L-opsin, p < 0.05; “No RA” L-opsin versus “RA to day 130” L-opsin p < 0.005; “No RA” L-opsin versus “Late RA” L-opsin p = 0.9635. Error bars indicate SEM. * Indicates p < 0.05; *** indicates p < 0.005. (F–I) M-opsin (blue) and L-opsin (pink) expression in organoids grown in different RA conditions (D), quantified in (E). White dotted outlines indicate M- or L-opsin-expressing cells. White lines indicate the edge of the organoid. (F) No RA. (G) RA to day 60. (H) RA to day 130. (I) Late RA.
Fig 4
Fig 4. Natural variation in cone ratios is associated with RA signaling regulation.
(A) Histogram of the ratios of % L from 738 human males with normal color vision. (B) L cone ratios for SNP rs372754794 genotypes. Original data sets are in S4 Data. (C) SNP rs372754794 genotype frequencies for L cone ratio deciles. Original data sets are in S4 Data. (D) Manhattan plot of the genetic variant p-values. Dots represent genetic variants in genes. Genetic variants above the gray line (Bonferroni corrected threshold) are significant (p < 0.05). The dots for each gene locus are presented in the same color (ex: DIO1 = dark blue; PIAS3 = orange). Along the X axis, the dots are spaced to scale as they occur in the genome. As OPN1LW and OPN1MW are nearby each other in the genome, the variants are represented together at the OPN1LW/MW locus in the same dark blue color. Due to the highly similar sequences of OPN1LW and OPN1MW, many reads could not be mapped, resulting in the gap in the variants at the OPN1LW/MW locus. Original data sets are in S4 Data. (E) Location of SNP rs372754794 upstream at the NR2F2 gene locus. NR2F2 gene (blue); NR2F2 antisense RNA (pink). Yellow arrow denotes the location of the SNP. (F) Local LD plot for rs37275494 based on data from an African American (ASW) population from the 1000 Genomes Project. Top indicates variants. Bottom indicates gene predictions. (G) Minor (G) allele ratio at rs37275494 by ancestry. Original data sets are in S4 Data. (H) Association of L:M ratio and rs372754794 stratified by self-reported ancestry. Original data sets are in S4 Data.
Fig 5
Fig 5. Model—RA regulates the spatiotemporal patterning of M and L cones in the human retina.

Similar articles

Cited by

References

    1. Baden T, Osorio D. The Retinal Basis of Vertebrate Color Vision. Annu Rev Vis Sci. 2019;5:177–200. Epub 2019/06/22. doi: 10.1146/annurev-vision-091718-014926 . - DOI - PubMed
    1. Hussey KA, Hadyniak SE, Johnston RJ Jr. Patterning and Development of Photoreceptors in the Human Retina. Front Cell Dev Biol. 2022;10:878350. Epub 2022/05/03. doi: 10.3389/fcell.2022.878350 ; PubMed Central PMCID: PMC9049932. - DOI - PMC - PubMed
    1. Nathans J, Thomas D, Hogness DS. Molecular genetics of human color vision: the genes encoding blue, green, and red pigments. Science. 1986;232(4747):193–202. doi: 10.1126/science.2937147 . - DOI - PubMed
    1. Yamaguchi T, Motulsky AG, Deeb SS. Visual pigment gene structure and expression in human retinae. Hum Mol Genet. 1997;6(7):981–90. Epub 1997/07/01. doi: 10.1093/hmg/6.7.981 . - DOI - PubMed
    1. Winderickx J, Battisti L, Motulsky AG, Deeb SS. Selective expression of human X chromosome-linked green opsin genes. Proc Natl Acad Sci U S A. 1992;89(20):9710–4. Epub 1992/10/15. doi: 10.1073/pnas.89.20.9710 ; PubMed Central PMCID: PMC50202. - DOI - PMC - PubMed