

Are lipids always depleted? Comparison of hydrogen, carbon, and nitrogen isotopic values in the muscle and lipid of larval lampreys
- PMID: 38206962
- PMCID: PMC10783746
- DOI: 10.1371/journal.pone.0286535
Are lipids always depleted? Comparison of hydrogen, carbon, and nitrogen isotopic values in the muscle and lipid of larval lampreys
Abstract
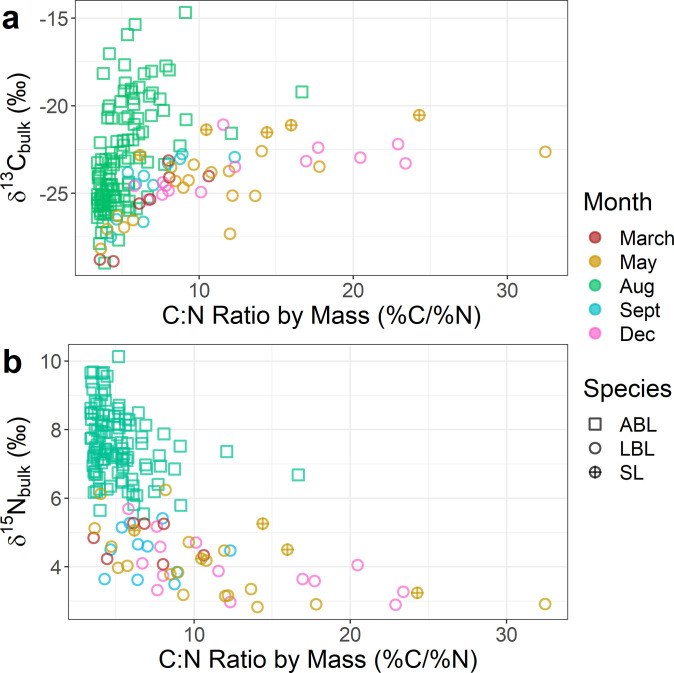
Stable isotope ratios in organisms can be used to estimate dietary source contributions, but lipids must first be accounted for to interpret values meaningfully. Lipids are depleted in heavy isotopes because during lipid synthesis light isotopes of carbon (12C) and hydrogen (1H) are preferentially incorporated. Prior work in larval lampreys has noted unusual lipid effects, which suggest lipids are enriched in the heavy isotope of carbon (13C), but still depleted in the heavy isotope of hydrogen (deuterium; 2H); nitrogen, a relatively rare element in lipids, has not been identified as being as sensitive to lipid content. Our objective was to determine if stable isotope ratios of hydrogen, carbon, and nitrogen behaved as expected in larval lampreys, or if their lipids presented different isotopic behavior. The δ2H, δ13C, and δ15N were measured from the muscle of four lamprey species before and after lipid extraction. In addition, muscle of least brook lamprey (Lampetra aepyptera) was collected every three months for a year from two streams in Maryland. Isotopic ratios were measured in bulk and lipid-extracted muscles, as well as in extracted lipids. The difference between muscle samples before and after lipid extraction (Δδ2H, Δδ13C, Δδ15N) was positively related to lipid proxy (%H or C:N ratio) and were fit best by linear models for Δδ2H and Δδ15N, and by a non-linear model for Δδ13C. The difference between lipid-extracted muscle and lipid δ13C (ΔMLδ13C) was negative and varied between months (ANOVA, F3,53 = 5.05, p < 0.005). Our work suggests that while lipids are often depleted in 13C, this is not a universal rule; however, the depletion of 2H in lipid synthesis appears broadly true.
Copyright: © 2024 Evans, Beharie. This is an open access article distributed under the terms of the Creative Commons Attribution License, which permits unrestricted use, distribution, and reproduction in any medium, provided the original author and source are credited.
Conflict of interest statement
The authors have declared that no competing interests exist.
Figures


Similar articles
-
Using stable isotopes and C:N ratios to examine the life-history strategies and nutritional sources of larval lampreys.J Fish Biol. 2016 Feb;88(2):638-54. doi: 10.1111/jfb.12858. Epub 2015 Dec 28. J Fish Biol. 2016. PMID: 26707340
-
Equations for lipid normalization of carbon stable isotope ratios in aquatic bird eggs.PLoS One. 2014 Jan 22;9(1):e83597. doi: 10.1371/journal.pone.0083597. eCollection 2014. PLoS One. 2014. PMID: 24465384 Free PMC article.
-
Short-term tissue decomposition alters stable isotope values and C:N ratio, but does not change relationships between lipid content, C:N ratio, and Δδ13C in marine animals.PLoS One. 2018 Jul 18;13(7):e0199680. doi: 10.1371/journal.pone.0199680. eCollection 2018. PLoS One. 2018. PMID: 30020988 Free PMC article.
-
Does lipid-correction introduce biases into isotopic mixing models? Implications for diet reconstruction studies.Oecologia. 2019 Dec;191(4):745-755. doi: 10.1007/s00442-019-04525-7. Epub 2019 Oct 30. Oecologia. 2019. PMID: 31667600 Review.
-
Altering the Hydrogen Isotopic Composition of the Essential Nutrient Water as a Promising Tool for Therapy: Perspectives and Risks.Int J Mol Sci. 2025 May 7;26(9):4448. doi: 10.3390/ijms26094448. Int J Mol Sci. 2025. PMID: 40362685 Free PMC article. Review.
References
-
- Michener RH, Lajtha K. Stable Isotopes in Ecology and Environmental Science. 2nd ed. Cambridge, MA: Blackwell Scientific Publications; 2007.
-
- Fry B. Stable Isotope Ecology. Springer; 2006.
-
- Ben-David M, Flaherty EA. Stable isotopes in mammalian research: a beginner’s guide. Journal of Mammalogy. 2012;93: 312–328. doi: 10.1644/11-MAMM-S-166.1 - DOI
-
- Dawson TE, Mambelli S, Plamboeck AH, Templer PH, Tu KP. Stable Isotopes in Plant Ecology. Annual Review of Ecology and Systematics. 2002;33: 507–559. doi: 10.1146/annurev.ecolsys.33.020602.095451 - DOI
-
- Post DM. Using stable isotopes to estimate trophic position: Models, methods, and assumptions. Ecology. 2002;83: 703–718.
MeSH terms
Substances
LinkOut - more resources
Full Text Sources
Miscellaneous
