. 2024 Jan 11;20(1):e1011037.
doi: 10.1371/journal.pgen.1011037. eCollection 2024 Jan.

Searching across-cohort relatives in 54,092 GWAS samples via encrypted genotype regression

Affiliations

Searching across-cohort relatives in 54,092 GWAS samples via encrypted genotype regression

Qi-Xin Zhang et al. PLoS Genet. .

Erratum in

Abstract

Explicitly sharing individual level data in genomics studies has many merits comparing to sharing summary statistics, including more strict QCs, common statistical analyses, relative identification and improved statistical power in GWAS, but it is hampered by privacy or ethical constraints. In this study, we developed encG-reg, a regression approach that can detect relatives of various degrees based on encrypted genomic data, which is immune of ethical constraints. The encryption properties of encG-reg are based on the random matrix theory by masking the original genotypic matrix without sacrificing precision of individual-level genotype data. We established a connection between the dimension of a random matrix, which masked genotype matrices, and the required precision of a study for encrypted genotype data. encG-reg has false positive and false negative rates equivalent to sharing original individual level data, and is computationally efficient when searching relatives. We split the UK Biobank into their respective centers, and then encrypted the genotype data. We observed that the relatives estimated using encG-reg was equivalently accurate with the estimation by KING, which is a widely used software but requires original genotype data. In a more complex application, we launched a finely devised multi-center collaboration across 5 research institutes in China, covering 9 cohorts of 54,092 GWAS samples. encG-reg again identified true relatives existing across the cohorts with even different ethnic backgrounds and genotypic qualities. Our study clearly demonstrates that encrypted genomic data can be used for data sharing without loss of information or data sharing barrier.


Conflict of interest statement

The authors have declared that no competing interests exist.

Figures

Fig 1
Fig 1. Resolution for varying relatedness using GRM, encGRM and encG-reg.
The figure shows the resolution for detecting relatives or overlapping samples with respect to varying number of markers at every row (for better illustration me was twice that of Eq 3) and the degree of relatives to be detected (r = 0, 1, and 2). The y axis is the relatedness calculated from GRM and the x axis is the estimated relatedness calculated from encG-reg (A) and encGRM (B). Each point represents an individual pair between cohort 1 and cohort 2 (there are 200 × 200 = 40,000 pairs in total), given the simulated relatedness. The dotted line indicates the 95% confidence interval of the relatedness directly estimated from the original genotype (blue) and the encrypted genotype (red). The table provides how m and k are estimated. The columns “under minimal me” provide benchmark for a parameter, and it is practically to choose 2×me and then estimate k as shown under the column “practical me”.
Fig 2
Fig 2. Workflow of encG-reg and its practical timeline as exercised in Chinese cohorts.
The mathematical details of encG-reg are simply algebraic, but its inter-cohort implementation involves coordination. (A) We illustrate its key steps, the time cost of which was adapted from the present exercise for 9 Chinese datasets (here simplified as three cohorts). Cohort assembly: It took us about a week to call and got positive responses from our collaborators (See Table 3), who agreed with our research plan. Inter-cohort QC: we received allele frequencies reports from each cohort and started to implement inter-cohort QC according to “geo-geno” analysis (see Fig 6). This step took about two weeks. Encrypt genotypes: upon the choice of the exercise, it could be exhaustive design (see UKB example), which may maximize the statistical power but with increased logistics such as generating pairwise Sij; in the Chinese cohorts study we used parsimony design, and generated a unique S given 500 SNPs that were chosen from the 7,009 common SNPs. It took about a week to determine the number of SNPs and the dimension of k according to Eq 3 and 4, and to evaluate the effective number of markers. Perform encG-reg and validation: we conducted inter-cohort encG-reg and validated the results (see Fig 7 and Table 4). It took one week. (B) Two interactions between data owners and central analyst, including example data for exchange and possible attacks and corresponding preventative strategies.
Fig 3
Fig 3. Sampling variance of GRM, encGRM and encG-reg in simulations.
The observed and theoretical sampling variance of GRM (A1-A4), encGRM (B1-B4) and encG-reg (C1-C4) are given in bar plots. Individual genotypes are simulated with m = 1,000, 1,250, 1,500, 1,750, and 2,000 independent markers. A total number of n1 = n2 = 1,000 pairs of relatives are simulated under each different levels of relatedness (r = 0, 1, 2, and 3). As for the encryption, the column number of random matrices are k = 4,000, 5,000, 6,000, 7,000, and 8,000 correspondingly.
Fig 4
Fig 4. Influence of minor allele frequencies in detecting relatives in Manchester and Oxford cohorts.
The bar plots provide a comparison of relatedness scores for the known 1st-degree and 2nd-degree relatives estimated by KING, GRM, encG-reg, and encG-reg+ at two representative assessment centers (Manchester and Oxford). For each assessment centers, 566 and 2,209 SNPs were randomly selected within specific MAF ranges: 0.01 to 0.05, 0.05 to 0.15, 0.15 to 0.25, 0.25 to 0.35, 0.35 to 0.5, and 0.05 to 0.5. Here, encG-reg+ denotes the use of 1.2-fold of the minimum number of k and IBD denotes twice the relatedness score estimated by KING. After resampling SNPs 100 times, the average GRM score, standard deviation, and statistical power were calculated for each detected relative-pair. The grey dashed line indicates the expected statistical power of 0.9. The solid colored lines indicate the average relatedness scores for certain degrees as estimated by the four methods. 17 pairs of so-called 1st-degree and 2 pairs of 2nd-degree relatives were approved using overall SNPs by KING.
Fig 5
Fig 5. Resolution for detecting relatives in UKB cohorts by KING and encG-reg under exhaustive design.
(A) Chord diagrams show the number of inter-cohort identical/twins, 1st-degree, and 2nd-degree relatedness across 19 UKB assessments with over 10,000 samples. Relatedness was detected and compared between KING and encG-reg under an exhaustive design, encompassing a total of 171 inter-cohort analyses. In each chord plot, the length of the side edge is proportional to the count of detected relatives between the focal cohort and other cohorts. (B) The scatter plot shows the estimated relatedness score by KING and encG-reg for inter-cohort relative pairs, including identical, 1st-degree, and 2nd-degree pairs. (C) The histogram shows the distribution of relatedness scores estimated by encG-reg. (D) The histogram shows the distribution of relatedness scores estimated by KING.
Fig 6
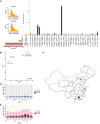
Fig 6. Cohort-level genetic background analyses for Chinese cohorts under parsimony encG-reg analysis.
(A) Overview of the intersected SNPs across cohorts, a black dot indicated its corresponding cohort was included. Each row represented one cohort while each column represented one combination of cohorts. Dots linked by lines suggested cohorts in this combination. The height of bars represented the cohort’s SNP numbers (rows) or SNP intersection numbers (columns). Inset histogram plots show the distribution of the 7,009 intersected SNPs and the 500 SNPs randomly chosen from the 7,009 SNPs for encG-reg analysis. (B) 7,009 SNPs were used to estimate fPC from the intersection of SNPs for the 9 cohorts. Each triangle represented one Chinese cohort and was placed according to their first two principal component scores (fPC1 and fPC2) derived from the received allele frequencies. (C) Five private datasets have been pinned onto the base map from GADM (https://gadm.org/data.html) using R language. The size of point indicates the sample size of each dataset. (D) Global fStructure plot indicates global-level Fst-derived genetic composite projected onto the three external reference populations: 1KG-CHN (CHB and CHS), 1KG-EUR (CEU and TSI), and 1KG-AFR (YRI), respectively; 4,296 of the 7,009 SNPs intersected with the three reference populations were used. (E) Within Chinese fStructure plot indicates within-China genetic composite. The three external references are 1KG-CHB (North Chinese), 1KG-CHS (South Chinese), and 1KG-CDX (Southwest minority Chinese Dai), respectively; 4,809 of the 7,009 SNPs intersected with these three reference populations were used. Along x axis are 9 Chinese cohorts and the height of each bar represents its proportional genetic composition of the three reference populations. Cohort codes: YRI, Yoruba in Ibadan representing African samples; CHB, Han Chinese in Beijing; CHS, Southern Han Chinese; CHN, CHB and CHS together; CEU, Utah Residents with Northern and Western European Ancestry; TSI, Tuscani in Italy; CDX, Chinese Dai in Xishuangbanna.
Fig 7
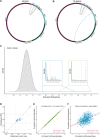
Fig 7. Detected identical pairs and 1st-degree pairs between Chinese cohorts.
(A) The circle plot illustrates identical pairs and (B) 1st-degree pairs across 9 Chinese cohorts. The solid links indicates anticipated relatedness between the CAS cohorts. The dashed link indicates relatedness identified across cohorts. The length of each cohort bar is proportional to their respective sample sizes. (C) The histogram shows all estimated relatedness using encG-reg between CAS1 and CAS2, most of which are unrelated pairs and the theoretical probability density function is given as the normal distribution N(0,1me+1k1) (grey solid curve). The inset histogram on the left shows the estimated relatedness around 0.5 and the theoretical probability density function is given as the normal distribution N(θr,1θr2me+1θr2k1) (blue solid curve). The threshold (grey dot line) for rejecting H0 was calculated by z1α/N1me+1k1. The inset histogram on the right shows the estimated relatedness around 1. The threshold (grey dot line) for rejecting H0 was calculated by z1α/N1me+1k0. Here we included 208 controls merged from 1KG-CHN. me=477,k0=70,k1=710,N=930,140,004. (D) Relationship verification for 19 Guangdong twins split in CAS cohorts. Dashed lines indicate inference criteria for detecting relatedness of different degrees. Solid line of y = x indicates the agreement between encG-reg and IBD. Points are colored with IBD-inferred relatedness in KING (identical in green, 1st-degree in blue, and unrelated in red) and are shaped according to encG-reg-inferred relatedness (identical in square, 1st-degree in diamond, and unrelated in circle). (E) and (F) Illustration for encG-reg estimation for sporadic related inter-cohort samples. The grey line is the criterion for identical pairs (slope of 1) or 1st-degree pairs (slope of 0.5). The solid lines colored in red are without adjustment for missing values (encG-reg score), and in the bottom (colored in purple) are adjusted for missing values (encG-reg score*).

References

    1. Manichaikul A, Mychaleckyj JC, Rich SS, Daly K, Sale M, Chen WM. Robust relationship inference in genome-wide association studies. Bioinformatics. 2010; 26: 2867–2873. doi: 10.1093/bioinformatics/btq559 - DOI - PMC - PubMed
    1. Thomson R, McWhirter R. Adjusting for familial relatedness in the analysis of GWAS data. Methods in Molecular Biology. Humana Press, New York, NY; 2017. pp. 175–190. doi: 10.1007/978-1-4939-6613-4_10 - DOI - PubMed
    1. Choi SW, Mak TSH, O’Reilly PF. Tutorial: a guide to performing polygenic risk score analyses. Nature Protocols. Europe PMC Funders; 2020. pp. 2759–2772. doi: 10.1038/s41596-020-0353-1 - DOI - PMC - PubMed
    1. Wray NR, Yang J, Hayes BJ, Price AL, Goddard ME, Visscher PM. Pitfalls of predicting complex traits from SNPs. Nature Reviews Genetics. NIH Public Access; 2013. pp. 507–515. doi: 10.1038/nrg3457 - DOI - PMC - PubMed
    1. Guerrini CJ, Robinson JO, Bloss CC, Bash Brooks W, Fullerton SM, Kirkpatrick B, et al.. Family secrets: Experiences and outcomes of participating in direct-to-consumer genetic relative-finder services. Am J Hum Genet. 2022; 109: 486–497. doi: 10.1016/j.ajhg.2022.01.013 - DOI - PMC - PubMed