. 2024 Jan 12;383(6679):190-200.
doi: 10.1126/science.adg1955. Epub 2024 Jan 11.

Hyperglycosylation of prosaposin in tumor dendritic cells drives immune escape

Affiliations

Hyperglycosylation of prosaposin in tumor dendritic cells drives immune escape

Pankaj Sharma et al. Science. .

Abstract

Tumors develop strategies to evade immunity by suppressing antigen presentation. In this work, we show that prosaposin (pSAP) drives CD8 T cell-mediated tumor immunity and that its hyperglycosylation in tumor dendritic cells (DCs) leads to cancer immune escape. We found that lysosomal pSAP and its single-saposin cognates mediated disintegration of tumor cell-derived apoptotic bodies to facilitate presentation of membrane-associated antigen and T cell activation. In the tumor microenvironment, transforming growth factor-β (TGF-β) induced hyperglycosylation of pSAP and its subsequent secretion, which ultimately caused depletion of lysosomal saposins. pSAP hyperglycosylation was also observed in tumor-associated DCs from melanoma patients, and reconstitution with pSAP rescued activation of tumor-infiltrating T cells. Targeting DCs with recombinant pSAP triggered tumor protection and enhanced immune checkpoint therapy. Our studies demonstrate a critical function of pSAP in tumor immunity and may support its role in immunotherapy.


Conflict of interest statement

Competing interests: F.W. and P.S. are listed as inventors on a patent application filed by Boston Children’s Hospital (provisional application no. 63/350,734), which covers the use of pSAP in cancer therapy. The authors declare no conflict of financial interests.

Figures

Fig. 1.
Fig. 1.. Saposins promote cross-presentation of membrane-associated tumor antigens.
(A) Diagram depicting the experimental read-outs used in Fig. 1. MCA101 fibrosarcoma cells were γ-irradiated (100 Gy) prior to the collection of apoptotic vesicles from supernatant and analysis with electron microscopy (EM) and calcein leakage assay. Apoptotic MCA101 or MCA101-OVA cells were used to pulse bone marrow–derived DCs from WT or pSAP-KO mice prior to the analysis of digestion of apoptotic cells with confocal microscopy and antigen processing and T cell activation with FACS. (B) Calcein leakage assay to quantify the effect of saposins on disintegration of apoptotic bodies. Apoptotic vesicles were prepared with differential ultracentrifugation (100,000g) from the supernatant of irradiated MCA101 cells and visualized with transmission electron microscopy (left). Scale bar, 200 nm. Apoptotic bodies were further loaded with calcein dye prior to incubation with indicated saposins or BSA (negative control), and calcein release was quantified in the supernatant with fluorimetry. (Right) Depicted is percent leakage compared with 100% lysis induced by Triton X-100. SAP, saposin. (C) Representative confocal microscopy image showing colocalization of apoptotic bodies (green) with LAMP-1 (red). WT DCs were pulsed with CFSE-labeled, γ-irradiated apoptotic MCA101 tumor cells for 2 hours. ApoBD, apoptotic body. (D) Representative confocal microscopy images showing the kinetics of apoptotic cell disintegration in WT and pSAP-KO DCs. DCs were pulsed with CFSE-labeled, γ-irradiated apoptotic MCA101 tumor cells for 2 hours, and the numbers of apoptotic bodies (ApoBD) were quantified at the indicated time points with ImageJ software (DAPI, blue; LAMP-1, red; ApoBD, green). (E) Representative histogram overlays and bar graph showing flow cytometry staining and mean fluorescence intensity (MFI) of MHC-I-SIINFEKL peptide on the surface of WT or pSAP-KO DCs after incubation with either soluble OVA (sOVA) or irradiated MCA101-OVA tumor cells (mOVA, membrane-associated OVA) for 4 hours. (F) Histograms and bar graph showing frequencies of proliferating CFSElow CD8 T cells after a three-day coculture with WT or pSAP-KO DCs pulsed with soluble OVA. (G) Histograms and bar graph depicting the frequencies of CFSElow CD8 T cells after a three-day coculture with WT or pSAP-KO DCs pulsed with irradiated MCA101-OVA cells. Additionally, pSAP-KO DCs were reconstituted with 10 μg/ml of recombinant pSAP prior to the T cell assay. Data shown in all graphs represent mean ± SD from three to five independent replicates. P values were determined with one-way analysis of variance (ANOVA) [(B) and (G)] or unpaired Student’s t test [(D), (E) and (F)]. *P < 0.05; **P < 0.01; ***P < 0.001; ns, not significant.
Fig. 2.
Fig. 2.. pSAP is required for tumor immunity and boosts T cells derived from melanoma patient samples.
(A) Experimental scheme of tumor challenge studies. WT and pSAP-KO BM chimeric mice were primed with 4 × 10⁵ γ-irradiated MCA101-OVA cells subcutaneously (s.c.) and subsequently inoculated with 1 × 10⁶ live MCA101-OVA cells (s.c.) 7 days post priming (D0). (B) Comparison of tumor sizes between WT and pSAP-KO mice on day 17 (left) and the kinetics of the tumors’ growth (right). (C) Representative histogram overlay and bar graph depicting the staining and MFI of MHC-I-SIINFEKL peptide on the surface of tumor DCs from pSAP-KO or WT animals. (D) FACS plots and bar graphs showing frequencies of MHC-I (Kb-SIINFEKL) tetramer- and IFN-γ–positive tumor-infiltrating CD8 T cells in pSAP-KO or WT mice. MHC-I tetramer specifically detects CD8 T cells that are reactive with SIINFEKL peptide. (E) Experimental setup for the coculture of myeloid and CD8 T cells isolated from human melanoma. Single-cell suspensions from human melanoma samples were FACS-sorted for CD146+ melanoma cells, CD8+ T cells, and CD11c/b+ myeloid cells. CD146+ cells were γ-irradiated and incubated with DCs, which were further cocultured with CD8 T cells in the presence or absence of recombinant pSAP. (F) FACS plots and bar graph showing the frequencies of IFN-γ–positive CD8 T cells following the indicated culture conditions. (G) Representative histogram overlay and bar graph demonstrating surface staining and MFI of LAMP-1 on CD8 T cells according to the indicated culture conditions. Graph colors represent the same as in (F). (H) Flow cytometry analysis and summarizing bar graph depicting the frequencies of antigen-specific CD8 T cells reactive with HLA-A*0201 tetramers loaded with epitopes from gp100, MART-1, tyrosinase, and NY-ESO-1 following the indicated culture setups. Amino acid residues are depicted on top, and percentages of gated cells are shown as mean ± SD in the dot plots. Data shown in (B) to (D) are representative of three independent experiments, whereas (F) to (H) depict mean ± SD from seven independent subjects. P values were determined by unpaired Student’s t test [(B) to (D)] or one-way ANOVA [(F) to (H)]. **P < 0.01; ***P < 0.001; ****P < 0.0001.
Fig. 3.
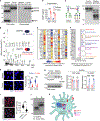
Fig. 3.. Hyperglycosylation of pSAP in tumor DCs leads to its secretion.
WT mice were inoculated with 1 × 10⁶ live MCA101 cells, and 18 days post tumor inoculation, cDC1 and cDC2 populations were FACS-sorted from tumor and spleen. (A) Immunoblot showing the abundance of pSAP and saposins in DCs as well as pSAP secretion. The left blot shows the expression of pSAP and saposins in FACS-sorted DC subsets from tumor and spleen, whereas the right blot shows secreted pSAP in the culture supernatant. pSAP-75, hyperglycosylated pSAP; pSAP-65, glycosylated pSAP; SAPs, saposins. (B) Quantification of pSAP secreted by DCs. FACS-sorted splenic and tumor DC subsets were cultured in cRPMI for 48 hours, and pSAP in culture supernatant was quantified with ELISA. (C) Immunoblot of Endo H–treated pSAP. (Left) Mechanism of Endo H that leads to cleavage of high-mannose, but not complex, glycans. (Right) FACS-sorted DCs from tumor and spleen were lysed in radioimmunoprecipitation assay (RIPA) buffer and cell lysates were treated with Endo H for 12 hours at 37°C prior to analysis with immunoblot. (D) Matrix-assisted laser desorption/ionization–time-of-flight (MALDI-TOF) mass spectrometry analysis of permethylated N-linked glycans of pSAP immunoprecipitated from FACS-sorted CD11c+ DCs. Enzymatically released N-glycans from pSAP of splenic (top) and tumor (bottom) DCs were analyzed. Glycan compositions were assigned based on m/z values. x axis, mass to charge ratio (m/z). y axis, signal intensity of the ions. green circle, mannose; yellow circle, galactose; red triangle, fucose; blue square, N-acetylglucosamine; magenta diamond, sialic acid. (E) Heat map of differentially expressed genes in tumor DCs involved in glycosylation, as analyzed by real-time RT2 profiler PCR array. Splenic DCs were used as the control to calculate fold change in gene expression. (F) Bar graph depicting glycosyltransferase and glycosidase gene expression in tumor compared with that of splenic DC1. (G) PLA of pSAP and sortilin. Confocal microscopy images of tumor and splenic DC subsets reveal PLA signal between pSAP and sortilin. Blue indicates cell nucleus (DAPI) and magenta represents ligation signal. The violin plot shows quantification of PLA signal, where 200 cells from each sample were analyzed for statistics. (H) Coimmunoprecipitation of sortilin and pSAP in tumor and splenic DCs. (Top) Blot of sortilin pulled down by anti-pSAP antibody. (Bottom) Immunoblot of total sortilin in corresponding DC populations. Bar graphs depict the densitometric and statistical analysis of sortilin abundance in the immunoblots. Red, tumor; blue, spleen. IP-pSAP, immunoprecipitation of pSAP. (I) PLA of pSAP and sortilin in human melanoma and monocyte-derived DCs (MoDCs). Melanoma DCs were sorted as CD11c+ cells from viable CD45+ cells isolated from human melanoma samples, whereas MoDCs were generated by culturing monocytes with interleukin 4 (IL-4) and granulocyte-macrophage colony-stimulating factor (GM-CSF) for 4 days. Blue indicates cell nucleus (DAPI), and magenta represents ligation signal. The violin plot shows quantification of PLA signal, where 200 cells from each sample were analyzed for statistics. (J) Immunoblot of pSAP in human melanoma DCs and MoDCs. (K) Illustration visualizing glycosylation mechanisms that control pSAP trafficking in tumor DCs. Hyperglycosylation of pSAP compromises its interaction with sortilin and reroutes it to the secretory pathway. Data shown in all graphs are representative of three independent experiments, and P values were determined with unpaired Student’s t test. *P < 0.05; **P < 0.01; ***P < 0.001; ****P < 0.0001; ns, not significant.
Fig. 4.
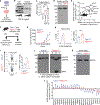
Fig. 4.. TGF-β induces pSAP hyperglycosylation in DCs and compromises tumor immunity.
(A) Experimental setup of murine DC (DC2.4) cells treated with TGF-β and read-outs shown in (B) to (E). (B) Immunoblot showing dose-dependent induction of pSAP hyperglycosylation and secretion by DC2.4 cell line incubated with recombinant TGF-β for 48 hours. (C) Quantification of pSAP in the culture supernatant of DC2.4 cells after incubation with recombinant TGF-β for 2 days as measured with ELISA. Unst., unstimulated. (D) Immunoblot of sortilin in DC2.4 cells after incubation with recombinant TGF-β for 2 days. (E) Scatter plot showing the correlation of gene expression of glycosyltransferases and glycosidases between tumor DCs and TGF-β–stimulated DC2.4 cells. mRNA fold changes were quantified by real-time RT2 profiler PCR array. CD11c+ tumor DCs were analyzed with splenic DCs as the control, whereas TGF-β-stimulated DC2.4 cells were compared with sham-treated DC2.4 cells. (F) Experimental scheme of tumor cell challenge. Tgfbr2f/f and CD11c–Cre × Tgfbr2f/f (Tgfbr2ΔDC) BM chimeric mice were inoculated with 1 × 10⁶ live MCA101-OVA cells (s.c.). (G) Kinetics of tumor growth in Tgfbr2f/f and Tgfbr2ΔDC mice. (H) Histogram overlay and bar graph depicting H-2Kb-SIINFEKL staining and MFI on tumor DCs from Tgfbr2ΔDC mice or Tgfbr2f/f controls on day 20 after tumor cell injection. (I) FACS plots and bar graph showing frequencies of IFN-γ+ tumor-infiltrating CD8 T cells in Tgfbr2ΔDC or Tgfbr2f/f animals on day 20 post tumor challenge. (J) Immunoblot of pSAP and saposins (SAPs) in tumor DCs, macrophages, and other CD45+ leukocytes from Tgfbr2ΔDC or Tgfbr2f/f mice on day 20 after tumor cell inoculation. (K) Immunoblot of sortilin in tumor DCs from Tgfbr2ΔDC or Tgfbr2f/f mice on day 20 after tumor cell inoculation. (L) Differentially expressed glycosyltransferase and glycosidase genes in tumor DCs isolated from Tgfbr2ΔDC or Tgfbr2f/f mice on day 20 after tumor challenge. Splenic DCs from Tgfbr2f/f animals were used as control to calculate mRNA fold change. Data shown in all graphs are representative of three independent experiments, and P values were determined with one-way ANOVA (C) or unpaired Student’s t test [(G) to (I)]. *P < 0.05; **P < 0.01; ***P < 0.001; ****P < 0.0001.
Fig. 5.
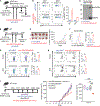
Fig. 5.. Reconstitution of tumor DCs with recombinant pSAP drives protection from cancer.
(A) Regime of pSAP targeting to tumor DCs. pSAP-KO BM-chimeric mice were inoculated with 1 × 10⁶ live MCA101-OVA cells. On days 9 and 13 after tumor cell injection, mice were intravenously treated with pSAP coupled with either anti-DEC205 or isotype control antibodies. (B) FACS plots and bar graph showing the amount of pSAP uptake by DCs at the tumor site as analyzed on day 14 after tumor challenge. (C) Immunoblot of delivered pSAP and single saposins in pSAP-deficient tumor DCs on day 20 after tumor cell inoculation. (D) Experimental setup depicting tumor cell inoculation and pSAP targeting through DEC205 in WT mice. (E) Comparison of tumor sizes on day 20 (left) and kinetics of tumor growth (right). (F) Histogram overlay and bar graph showing H-2Kb-SIINFEKL peptide surface staining and MFI on tumor DCs on day 20 post tumor challenge. (G) FACS plots and bar graphs showing percentages of IFN-γ–positive CD8 T cells in tumors and dLNs in mice treated with pSAP coupled to anti-DEC205 or isotype control. (H) Flow cytometry and bar graphs showing MHC-I (Kb-SIINFEKL) tetramer (MHC-I-Tet)–positive CD8 T cells in tumors and dLNs. (I) Experimental setup depicting B16F10 melanoma cell inoculation, pSAP targeting through DEC205, and tumor growth kinetics. WT mice were inoculated with 3 × 10⁶ live melanoma cells and were treated with pSAP coupled with anti-DEC205 or isotype control antibodies, either alone or in combination with anti–PD-L1 antibodies. Statistical analysis of tumor volume across all treatment groups is shown on day 32 after tumor challenge. Percentages of gated cells are shown as mean ± SD in the dot plots in (B), (G), and (H). Data shown in all graphs are representative of three independent experiments, and P values were determined with unpaired Student’s t test [(B) and (E) to (H)] or one-way ANOVA (I). **P < 0.01; ***P < 0.001; ****P < 0.0001.

Update of

References

    1. Vesely MD, Kershaw MH, Schreiber RD, Smyth MJ, Annu. Rev. Immunol 29, 235–271 (2011). - PubMed
    1. Rooney MS, Shukla SA, Wu CJ, Getz G, Hacohen N, Cell 160, 48–61 (2015). - PMC - PubMed
    1. Sade-Feldman M et al., Nat. Commun 8, 1136 (2017). - PMC - PubMed
    1. Alloatti A et al., J. Exp. Med 214, 2231–2241 (2017). - PMC - PubMed
    1. Blum JS, Wearsch PA, Cresswell P, Annu. Rev. Immunol 31, 443–473 (2013). - PMC - PubMed