. 2024 Jan 12;383(6679):eadf6493.
doi: 10.1126/science.adf6493. Epub 2024 Jan 12.

Deterministic reprogramming of neutrophils within tumors

Affiliations

Deterministic reprogramming of neutrophils within tumors

Melissa S F Ng et al. Science. .

Abstract

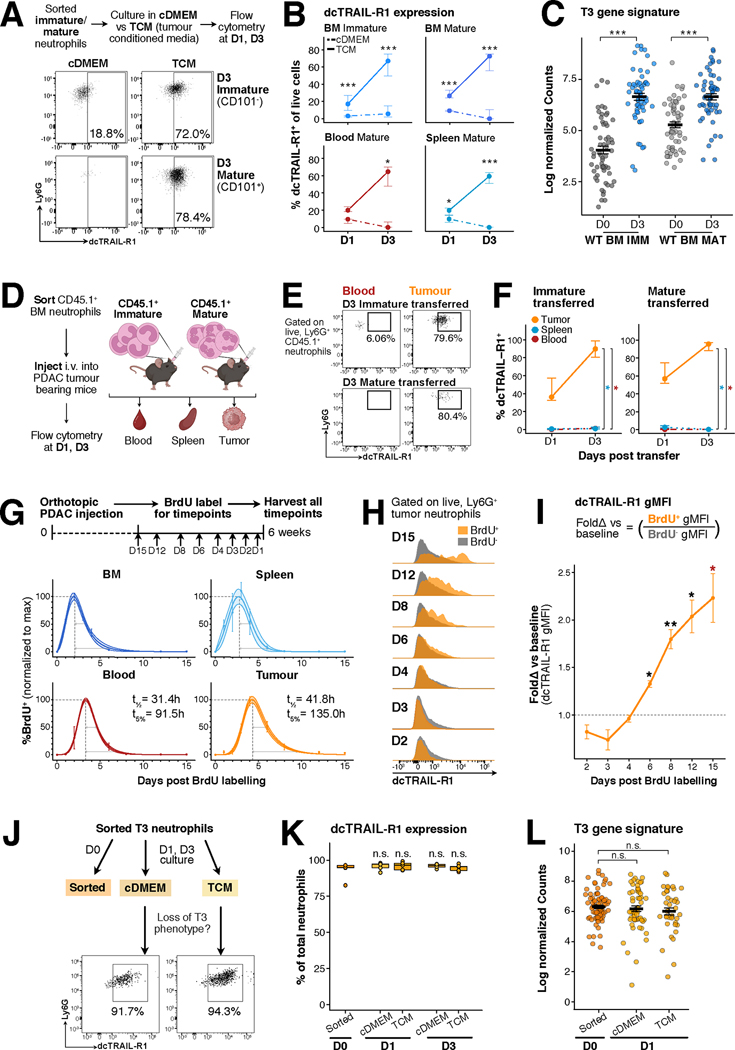
Neutrophils are increasingly recognized as key players in the tumor immune response and are associated with poor clinical outcomes. Despite recent advances characterizing the diversity of neutrophil states in cancer, common trajectories and mechanisms governing the ontogeny and relationship between these neutrophil states remain undefined. Here, we demonstrate that immature and mature neutrophils that enter tumors undergo irreversible epigenetic, transcriptional, and proteomic modifications to converge into a distinct, terminally differentiated dcTRAIL-R1+ state. Reprogrammed dcTRAIL-R1+ neutrophils predominantly localize to a glycolytic and hypoxic niche at the tumor core and exert pro-angiogenic function that favors tumor growth. We found similar trajectories in neutrophils across multiple tumor types and in humans, suggesting that targeting this program may provide a means of enhancing certain cancer immunotherapies.


Conflict of interest statement

Competing interests: The authors declare that they have no competing interests.

Figures

Figure 1.
Figure 1.. Neutrophils infiltrating the pancreatic tumor undergo further differentiation and converge upon a transcriptionally distinct T3 neutrophil state.
(A) Schematic shows scRNAseq workflow. CD11b+Ly6G+ neutrophils were sorted from the bone marrow, spleen, blood and pancreatic tumor for tumor bearing mice 6 weeks post orthotopic injection (n=2). Each sample was individually tagged with cell-hashing antibodies before they were pooled for analysis with 10X V3 3’ scRNAseq. (see also fig. S1A and Materials and Methods) (B) UMAP projection of total neutrophils in bone marrow (BM), spleen, blood and tumor show strong enrichment of three clusters (T1, T2 and T3) in the tumor. Louvain clustering was performed and colors correspond to clusters identified. (C) Low dimensional embedding of all neutrophils using a diffusion-map approach reveals a branch point between mature and tumor neutrophils. Scatterplot shows diffusion components 1 and 2. Light grey arrows are used to indicate the trajectory from precursor, immature and mature neutrophil states. Black arrows denote the branching into T3 neutrophils from T1 and T2 states. (D) The neutrophil maturation score can be used to identify Louvain clusters along their differentiation trajectory. Histograms show the module score of the maturation gene signature for each cluster identified in (B), with scores closest to 1 being the most mature. Dotted line in grey defines the cut-off for mature neutrophils, and is set at the lower bound of the Mature 2 cluster. (E) RNA velocity suggests the convergent differentiation of T1 and T2 into T3 neutrophils. RNA velocity vectors are projected on the diffusion map embedding with velocity vectors terminating in the tumor and mature neutrophils. (F) Principal component analysis of bulk ATAC (Assay for transposase accessible chromatin) sequencing (ATACseq) indicate that changes in chromatin accessibility established in tumor neutrophils cluster them away from other neutrophil subsets. ATACseq was performed for immature (circles) and mature (squares) neutrophils sorted from the bone marrow (grey and dark blue, n= 3 each), spleen (light blue, n=3 each), blood (red, n=3 mature, n=2 immature) and tumor (orange, n =3 each) in wild type (WT) or tumor-bearing (tumor) mice. (G) Open chromatin regions (OCRs) matched to differentially expressed T3 genes, have increased accessibility only in immature and mature tumor neutrophils. Heatmap shows intensity of fragment mapping across indicated neutrophil subsets, histograms indicate average mapping intensity. T3 genes linked to hypoxia, glycolysis and angiogenesis are annotated. (see also table S2) (H) Heatmap shows scaled AUC scores of the top 25 transcription factor regulons enriched in T3 neutrophils computed by PySCENIC (see also table S2). Numbers in brackets denote the number of genes assigned to the transcription factor regulon. Transcription factors that also had increased motif enrichment in tumor immature and mature bulk neutrophil populations are in bold.
Figure 2.
Figure 2.. Combinatorial CD101 and dcTRAIL-R1 expression identifies T3, T2 and T1 neutrophils
(A) UMAP projection of live, CD45+ immune cells within the pancreatic ductal adenocarcinoma tumor reveals two clusters of neutrophils present in the tumor. High parameter flow cytometry was carried on single cell suspensions of pooled tumours (n=10) using the LEGENDScreen panel (Biolegend). Live, CD45+ well-compensated FCS were first analyzed and then exported out for analysis using the InfinityFlow package in R. UMAP shows Ly6G expression intensity imputed by InfinityFlow from high (red) to low (blue). Clusters are annotated by canonical surface marker expression. (see also fig. S3B). (B) Neutrophil cluster 2 has increased expression of immunosuppressive/immunomodulatory surface markers compared to cluster 1. Surface marker expression intensities are shown for curated surface markers from clockwise: dcTRAIL-R1, PD-L1, CD14, CD371, VISTA and CD39. Data are represented as a Z score based on predicted log2 mean fluorescence intensity (MFI) from high (red) to low (blue). (see also fig. S3C) (C) dcTRAIL-R1 expression marks and is restricted to a separate population of tumor infiltrating neutrophils. Representative contour flow cytometry plots (top) show dcTRAIL-R1 expression against Ly6G expression in the tumor for indicated cell populations. Heatmap (bottom) shows scaled mean fluorescence intensity (MFI) for markers in (B), scaled between 0–1 across all populations, with 0 being the lowest MFI. Populations were analyzed by flow cytometry, where total neutrophils were gated as CD11b+CD115Ly6G+ in the bone marrow (BM), spleen, blood and tumor. Tumor macrophages (CD11b+Gr-1F4/80hiMHCIIhi) and monocytes (CD11b+Ly6GLy6Chi) were gated accordingly. (see also fig. S3D) (D) Proposed gating strategy to isolate T3, T2 and T1 neutrophils by dcTRAIL-R1 and CD101 expression. (E) Sorted dcTRAIL-R1+ tumor neutrophils have the highest expression of the T3 transcriptional signature. Heatmap shows scaled Nanostring gene counts (normalized against internal positive controls and housekeeping genes) for T1 (n=4), T2 (n=4) and T3 (n=4) neutrophils sorted according to (D). Genes belonging to either the T3, T2 or T1 transcriptional signature are indicated. (see also fig. S4C).
Figure 3.
Figure 3.. Spatial compartmentalization of T1, T2 and T3 neutrophils in the pancreatic tumor
(A) Chord diagram shows differentially expressed genes (DEGs) in T1 neutrophils that are enriched for gene ontology pathways linked to transcription and oxidative phosphorylation. (B) Chord diagram shows DEGs in T2 neutrophils that are enriched for gene ontology pathways linked to metabolism and immune response. (C) Chord diagram shows DEGs in T3 neutrophils that are enriched for gene ontology pathways linked to survival and angiogenesis. (A-C) Bars associated with each gene are colored by strength of fold change of differential expression, and are sized based on the number of pathways it interacts with. (see also table S4 for DEG lists) (D) Spatial transcriptomic analysis workflow. PDAC tumors were isolated and cut into quarters, where the sharp edges denote the core facing regions, before flash-freezing. Fresh frozen PDAC tumors were sectioned and placed on 10X Visium slides containing spatially barcoded capture spots. After processing and sequencing, the data was clustered spatially (BayesSpace) and cell type deconvolution was performed (Cell2location). Gene signatures of various biological processes were then probed and mapped with the UCell package. (E) Tumor neutrophils localize to different spatial clusters. Projection of T3, T2 and T2 neutrophil enriched spots identified by Cell2location on merged UMAP derived from BayeSpace enhanced clustering analysis of tumor sections (n=4) (F) Merged UMAP representation of spots of tumor sections analysed, color-coded according to BayesSpace identified clusters (top). Violin plots show frequency of T1, T2 and T3 neutrophils enriched spots mapping to each cluster (bottom). (G) Spatial mapping of T1, T2 and T3 neutrophils across tumor sections (n=4) by Cell2location. Black lines denote the outline of the section, grey colored areas indicated the excluded DAPIpanCKhi regions annotated to be fibrotic/necrotic. Spots are filtered based on Ly6G positive staining (see also fig. S6B). (H) Quantification of deconvoluted T3 neutrophil-enriched spots falling into high or low scoring spots for GO ontology pathways: glycolytic (GO:0061621), hypoxic (GO:001666), and angiogenic (GO:0045766). Boxplots show median (centre line) with standard deviation (whiskers). p<0.05*, by one-tailed T test.
Figure 4.
Figure 4.. T3 neutrophils occupy a hypoxic-glycolytic niche in the pancreatic tumor
(A) Workflow diagram of multiplexed imaging using MICS technology. Cryosections of halved PDAC tumors were placed on slides, fixed and permeabilized, before region of interest (ROI) selection with DAPI staining. Sections were stained for 10 minutes per cycle containing antibodies in FITC, PE and APC. After scanning, sections are photobleached and scanned to subtract background signals. After imaging the desired cycles, images were registered, segmented and exported for conventional flow cytometric annotation of cell types which are further used for spatial statistical analysis with SPIAT. (B) Tumor pictograph showing ROI1 selection area. (C) Immunofluorescent image of ROI1 with indicated stain markers of respective tumor regions. Scale bar = 100um. (D) (left) Expression marker intensity map of CD73 and GLUT1. (right) Co-expression plot of CD71 and GLUT1 marker intensities. (E) Spatial mapping of each annotated tumor neutrophil subsets in ROI1. (F) Co-mapping of neutrophil subsets in ROI1. (G) (left) Gating strategy of CD45-negative, CD105-negative tumor regions demarcated by CD73 and GLUT1. (right) Mapped gated regions on segmented data of ROI1. (H) Spatial statistical analysis of segmented tumor neutrophils. (left) Average minimum distance of each segmented neutrophil subset to hypoxichighglycolytichigh regions. (right) Co-localisation of tumor neutrophils with hypoxichighglycolytichigh regions, measured using a normalized mixing score for each radius of interaction.
Figure 5.
Figure 5.. Reprogramming within the tumor environment results in long-lived, terminally differentiated T3 neutrophils
(A) Experimental set-up of in vitro culture of sorted neutrophils from wild type (WT) mice in control media (complete DMEM, cDMEM) versus tumor conditioned media (TCM). Representative flow cytometry plots show dcTRAIL-R1 expression increases on sorted immature and mature WT neutrophils from the bone marrow (BM) after three days of culture in TCM but not in cDMEM. (B) Neutrophils cultured in TCM upregulate dcTRAIL-R1 over time. Lineplots show the percentage of dcTRAIL-R1+ cells gated as in (B), dots indicate the median, error bars indicate Q1 and Q3 intervals for neutrophil subsets cultured in cDMEM (dotted line) and TCM (solid line) over 1 and 3 days. Each group contains the following number of samples – Day 1 cDMEM: BM immature (n=8), BM mature (n=8), Spleen Mature (8), Blood Mature (3), Day 1 TCM: BM immature (n=8), BM mature (n=8), Spleen Mature (8), Blood Mature (5), Day 3 cDMEM: BM immature (n=10), BM mature (n=10), Spleen Mature (10), Blood Mature (4), Day 3 TCM: BM immature (n=10), BM mature (n=10), Spleen Mature (10), Blood Mature (5). p<0.05*, p<0.01**, p<0.001***, by Mann-Whitney U test. (C) Neutrophils cultured in TCM upregulate the T3 gene signature. Scatter dot plots for T3 gene signature expression in BM immature (WT BM IMM) and mature (WT BM MAT) that were freshly sorted (D0) or cultured for 3 days (D3), n=3 for all samples. Each dot denotes a single gene, lines denote the mean, error bars show standard error mean (SEM). p<0.001***, by Wilcoxon signed-rank test with Bonferonni’s correction, comparisons indicated on graph. (D) Experimental set-up for transfer of CD45.1+ neutrophils into pancreatic tumor bearing mice. Sorted WTBM immature and mature neutrophils were intravenously injected into WT PDAC tumor-bearing mice. At 1- and 3-days post transfer, CD45.1+ neutrophils were evaluated within the blood, spleen and tumour for dcTRAIL-R1 expression by flow cytometry. (E) Upregulation of dcTRAIL-R1 expression is restricted to the tumor. Representative flow plots show dcTRAIL-R1 expression present on transferred CD45.1+ immature and mature neutrophils present in the blood or tumor at 3-days post transfer. (F) Lineplots show proportion of WT BM CD45.1+ immature (n=4 at day 1, n=3 at day 3) or mature neutrophils (n=3 at both timepoints) expressing dcTRAIL-R1. Each dot denotes a single gene, lines denote the mean, error bars show standard error mean (SEM). p<0.05*, by Kruskal-Wallis test with Dunn’s post-test. (G) Experimental set-up for BrdU pulse-labelling in tumor-bearing mice. WT mice received orthotopic injection of the pancreatic ductal adenocarcinoma (PDAC) cells, and the tumor was allowed to grow. At days 15 (n=4), 12 (n=4), 8 (n=5), 6 (n=3), 4 (n=4), 3 (n=4), 2 (n=3), and 1 (n=4) prior to the harvest, mice were injected with BrdU, thus labelling proliferating neutrophils within the bone marrow and spleen. At day 42 (6 weeks) post injection, mice were harvested, and BrdU+ neutrophils within the bone marrow, spleen, blood and tumor were quantified. BrdU percentages at all timepoints were then normalized to the maximal BrdU+ percentage value for each tissue, which was set to 100%. Dots shows mean expression with error bars denoting 95% confidence intervals. A mathematical model capturing the full temporal window was fitted to estimate half-life (t1/2)and lifespan (t5%)for each organ, denoted on each plot in hours (see also Methods and fig. S12C). (H) BrdU labelled neutrophils upregulate dcTRAIL-R1 over time. Histograms show geometric mean fluorescence intensity (gMFI) of dcTRAIL-R1 within BrdU+ (orange) and BrdU (grey) neutrophils over day 2,3,4,6,8,12 and 15 timepoints post BrdU labelling. (I) Quantification of gMFI in (H). Line plots fold change of dcTRAIL-R1 gMFI of BrdU+ against BrdU neutrophils. BrdU neutrophils served as a measure of baseline dcTRAIL-R1 gMFI within the tumour. Each dot denotes the mean, with error bars showing SEM. p<0.05*, p<0.01**, by Mann-Whitney U test, one-tailed, alternative = “greater”. (J) Experimental set-up of in vitro culture of sorted T3 neutrophils from PDAC mice in cDMEM or TCM at 1 or 3 days. Representative flow cytometry plots show dcTRAIL-R1 expression is retained on T3 neutrophils after 1 day of culture in both cDMEM and TCM. (K) Boxplots show quantification of frequency of dcTRAIL-R1+ neutrophils (n=5) in (I), where lines denote the mean. p = n.s. (non significant), by Kruskal-Wallis followed by many-to-one U test comparing against the D0 timepoint. (L) T3 neutrophils cultured overnight do not downregulate the T3 gene signature. Scatter dot plots for T3 gene signatures in sorted, cDMEM or TCM cultured neutrophils (n=3 each), each dot denotes a single gene, lines denote the mean, error bars show standard error mean. p = n.s., by Kruskal-Wallis followed by Dunn’s post-test.
Figure 6.
Figure 6.. Pro-tumoral T3 neutrophils promote tumor growth and associate with poorer patient outcomes
(A) T3 neutrophils have the highest expression of Vegfa transcripts. UMAP projection of total neutrophils in bone marrow (BM), spleen, blood and tumor shows expression density of Vegfa. (B) T3 neutrophils have the highest expression of VEGFα. Representative flow plots show intracellular VEGFα protein staining in neutrophils from the spleen and T1, T2 and T3 neutrophils in the pancreatic tumor. (C) Boxplots quantify VEGFα expression as shown in (B). Boxplots show median (centre line) with standard deviation (whiskers). p<0.05*, p<0.01**, by Kruskal-Wallist followed by many-to-one U test comparing against T3 neutrophils. (D) T3 neutrophils promote rapid tumor growth. Schematic of experimental set-up to determine the ability of neutrophils to promote tumor growth in vivo. Equal numbers of neutrophils and pancreatic ductal adenocarcinoma cells (PDAC) were mixed in Matrigel before subcutaneous injection into the right flank. Neutrophils in the tumor was boosted on day 3 (D3) and D7, by direct subcutaneous injection into the visible matrigel plug/tumor. Tumor growth was measured by calipers weekly until the day 28 endpoint. Line plots show volume of measured subcutaneous tumors co-injected with PBS (n=8), WT BM immature (WTBM IMM, n = 10), WT BM mature (WTBM MAT, n =12), T1 (n = 7), T2 (n=12), and T3 (n = 7) neutrophils. Dots show mean with error bars indicating standard error of mean (SEM), over all three measurement timepoints. p<0.05*, p<0.01**, by Kruskal-Wallis test followed by many-to-one U test comparing all other conditions to PBS co-injection. (E) Quantification of PDAC subcutaneous tumor incidence after neutrophil co-injection (see fig. S13D for quantification method). Piecharts show frequency of mice with tumours (light grey) or no tumor growth (dark grey) at day 28 endpoint in (A). (F) Tumors co-injected with T3 neutrophils had the biggest weights compared other conditions. Each dot represents one biological replicate, with boxplots showing median with interquartile range, and whiskers indicating lowest and highest measurement. p<0.05* by Kruskal-Wallis test followed by many-to-one U test comparing all other conditions to PBS co-injection. (G) Antibody neutralization of VEGFα reduces T3-mediated acceleration of tumor growth. Schematic of experimental set-up with sorted T3 neutrophils are co-injected with PDAC tumor with anti-VEGFα targeting antibody (n=10) or isotype control (n=7). WTBM mature neutrophils were utilized as controls (anti-VEGFα targeting antibody, n=4, isotype, n=5). Neutrophils were further injected on D3 and D7 with the corresponding antibody added, and tumour growth was measured at D14 and D21, 7 and 14 days post tumor injection. Boxplots show median tumour volume with whiskers representing the interquartile range. p<0.05* by by Mann-Whitney U test. (H) Visualization of CD31 vessels within T3 and WTBM MAT co-injected subcutaneous tumours. Subcutaneous tumours from (A) for T3 (n=3) and WTBM MAT (n-3) were dissected, optically cleared and permeabilized, stained with anti-CD31 antibody, and imaged in 3D at 0.65X (100% of total volume) and 2X resolution (35% of total volume starting from midpoint). Representative 3D immunofluorescence images show T3 (top, quarter) and WTBM MAT (bottom, whole) co-injected tumors, with tumour margins marked out in white dotted lines and indicated. (I) Subcutaneous PDAC tumors co-injected with T3 neutrophils have greater CD31 vessel density within the tumor core. Quantification of CD31 staining intensity at 2X resolution as in (E). CD31 staining was surfaced with a seedpoint of 16.2, and binned in 10% quantiles according to the distance from left or right margins towards the tumour core. To account for differences in tumor sizes, CD31 staining intensity was further normalized over total slice volume for each quantile. Lineplots represent volume-normalized staining intensity, with dots representing the mean and errors bars indicating SEM for T3 (orange) or WTBM MAT (grey) co-injected tumours. p<0.05* by Mann-Whitney U test, one-tailed, alternative = “greater”. (J) Antibody-mediated blockade of T3 neutrophils reduces their ability to promote rapid tumour growth. Schematic of experimental set-up - sorted T3 neutrophils are co-injected with PDAC tumor with anti-dcTRAIL-R1 targeting antibody (n=8) or isotype control (n=8). T3 neutrophils were further injected on D3 and D7 with the corresponding antibody added, and tumour growth was measured at D14 and D21, 7 and 14 days post tumor injection. Boxplots show median tumour volume with whiskers representing the interquartile range. p<0.05* by by Mann-Whitney U test. (K) The T3 neutrophil gene signature is associated with poorer patient overall survival (OS) and disease-free survival (DFS) in pancreatic cancer. Kaplan-Meier plots show OS (top) and DFS (bottom) for patients in the TCGA-PAAD (The Cancer Genomics Atlas, Pancreatic Adenocarcinoma) and PACA-AU (international Cancer Genome Consortium Pancreatic Cancer-Australia). Patients were split into high and low expression of the T3 curated signature. Median OS and DFS survival are represented on the graph when available. Events are represented by vertical lines and were defined from days to death (from initial pathological diagnosis) or days to first event (from initial treatment, for TCGA, and from clinical disease-free diagnosis for PACA-AU)). p<0.05* as calculated by log-rank test. (L) The T3 neutrophil gene signature is associated with poorer patient overall survival in a subset of solid tumor human cancers. Each data set within the curated TCGA Pan Cancer data set was scored for T3, T2 and T1 signatures (see also table S4). Forest plots show hazard ratio (HR) scores associated with patient overall survival (OS) that were significant (p<0.05) by Cox proportional hazards test across all signatures. Dots indicate the calculated HR, whiskers indicate 95% confidence intervals.

Comment in

References

    1. Ng LG, Ostuni R, Hidalgo A, Heterogeneity of neutrophils. Nat Rev Immunol. 19, 255–265 (2019). - PubMed
    1. Gentles AJ, Newman AM, Liu CL, Bratman SV, Feng W, Kim D, Nair VS, Xu Y, Khuong A, Hoang CD, Diehn M, West RB, Plevritis SK, Alizadeh AA, The prognostic landscape of genes and infiltrating immune cells across human cancers. Nat Med. 21, 938–945 (2015). - PMC - PubMed
    1. Bronte V, Brandau S, Chen S-H, Colombo MP, Frey AB, Greten TF, Mandruzzato S, Murray PJ, Ochoa A, Ostrand-Rosenberg S, Rodriguez PC, Sica A, Umansky V, Vonderheide RH, Gabrilovich DI, Recommendations for myeloid-derived suppressor cell nomenclature and characterization standards. Nat Commun. 7, 12150 (2016). - PMC - PubMed
    1. Sagiv JY, Michaeli J, Assi S, Mishalian I, Kisos H, Levy L, Damti P, Lumbroso D, Polyansky L, Sionov RV, Ariel A, Hovav A-H, Henke E, Fridlender ZG, Granot Z, Phenotypic Diversity and Plasticity in Circulating Neutrophil Subpopulations in Cancer. Cell Reports. 10, 562–573 (2015). - PubMed
    1. Hsu BE, Tabariès S, Johnson RM, Andrzejewski S, Senecal J, Lehuédé C, Annis MG, Ma EH, Völs S, Ramsay L, Froment R, Monast A, Watson IR, Granot Z, Jones RG, St-Pierre J, Siegel PM, Immature Low-Density Neutrophils Exhibit Metabolic Flexibility that Facilitates Breast Cancer Liver Metastasis. Cell Reports. 27, 3902–3915.e6 (2019). - PubMed

MeSH terms

Substances

LinkOut - more resources