

Systems-level analyses dissociate genetic regulators of reactive oxygen species and energy production
- PMID: 38207075
- PMCID: PMC10801874
- DOI: 10.1073/pnas.2307904121
Systems-level analyses dissociate genetic regulators of reactive oxygen species and energy production
Abstract
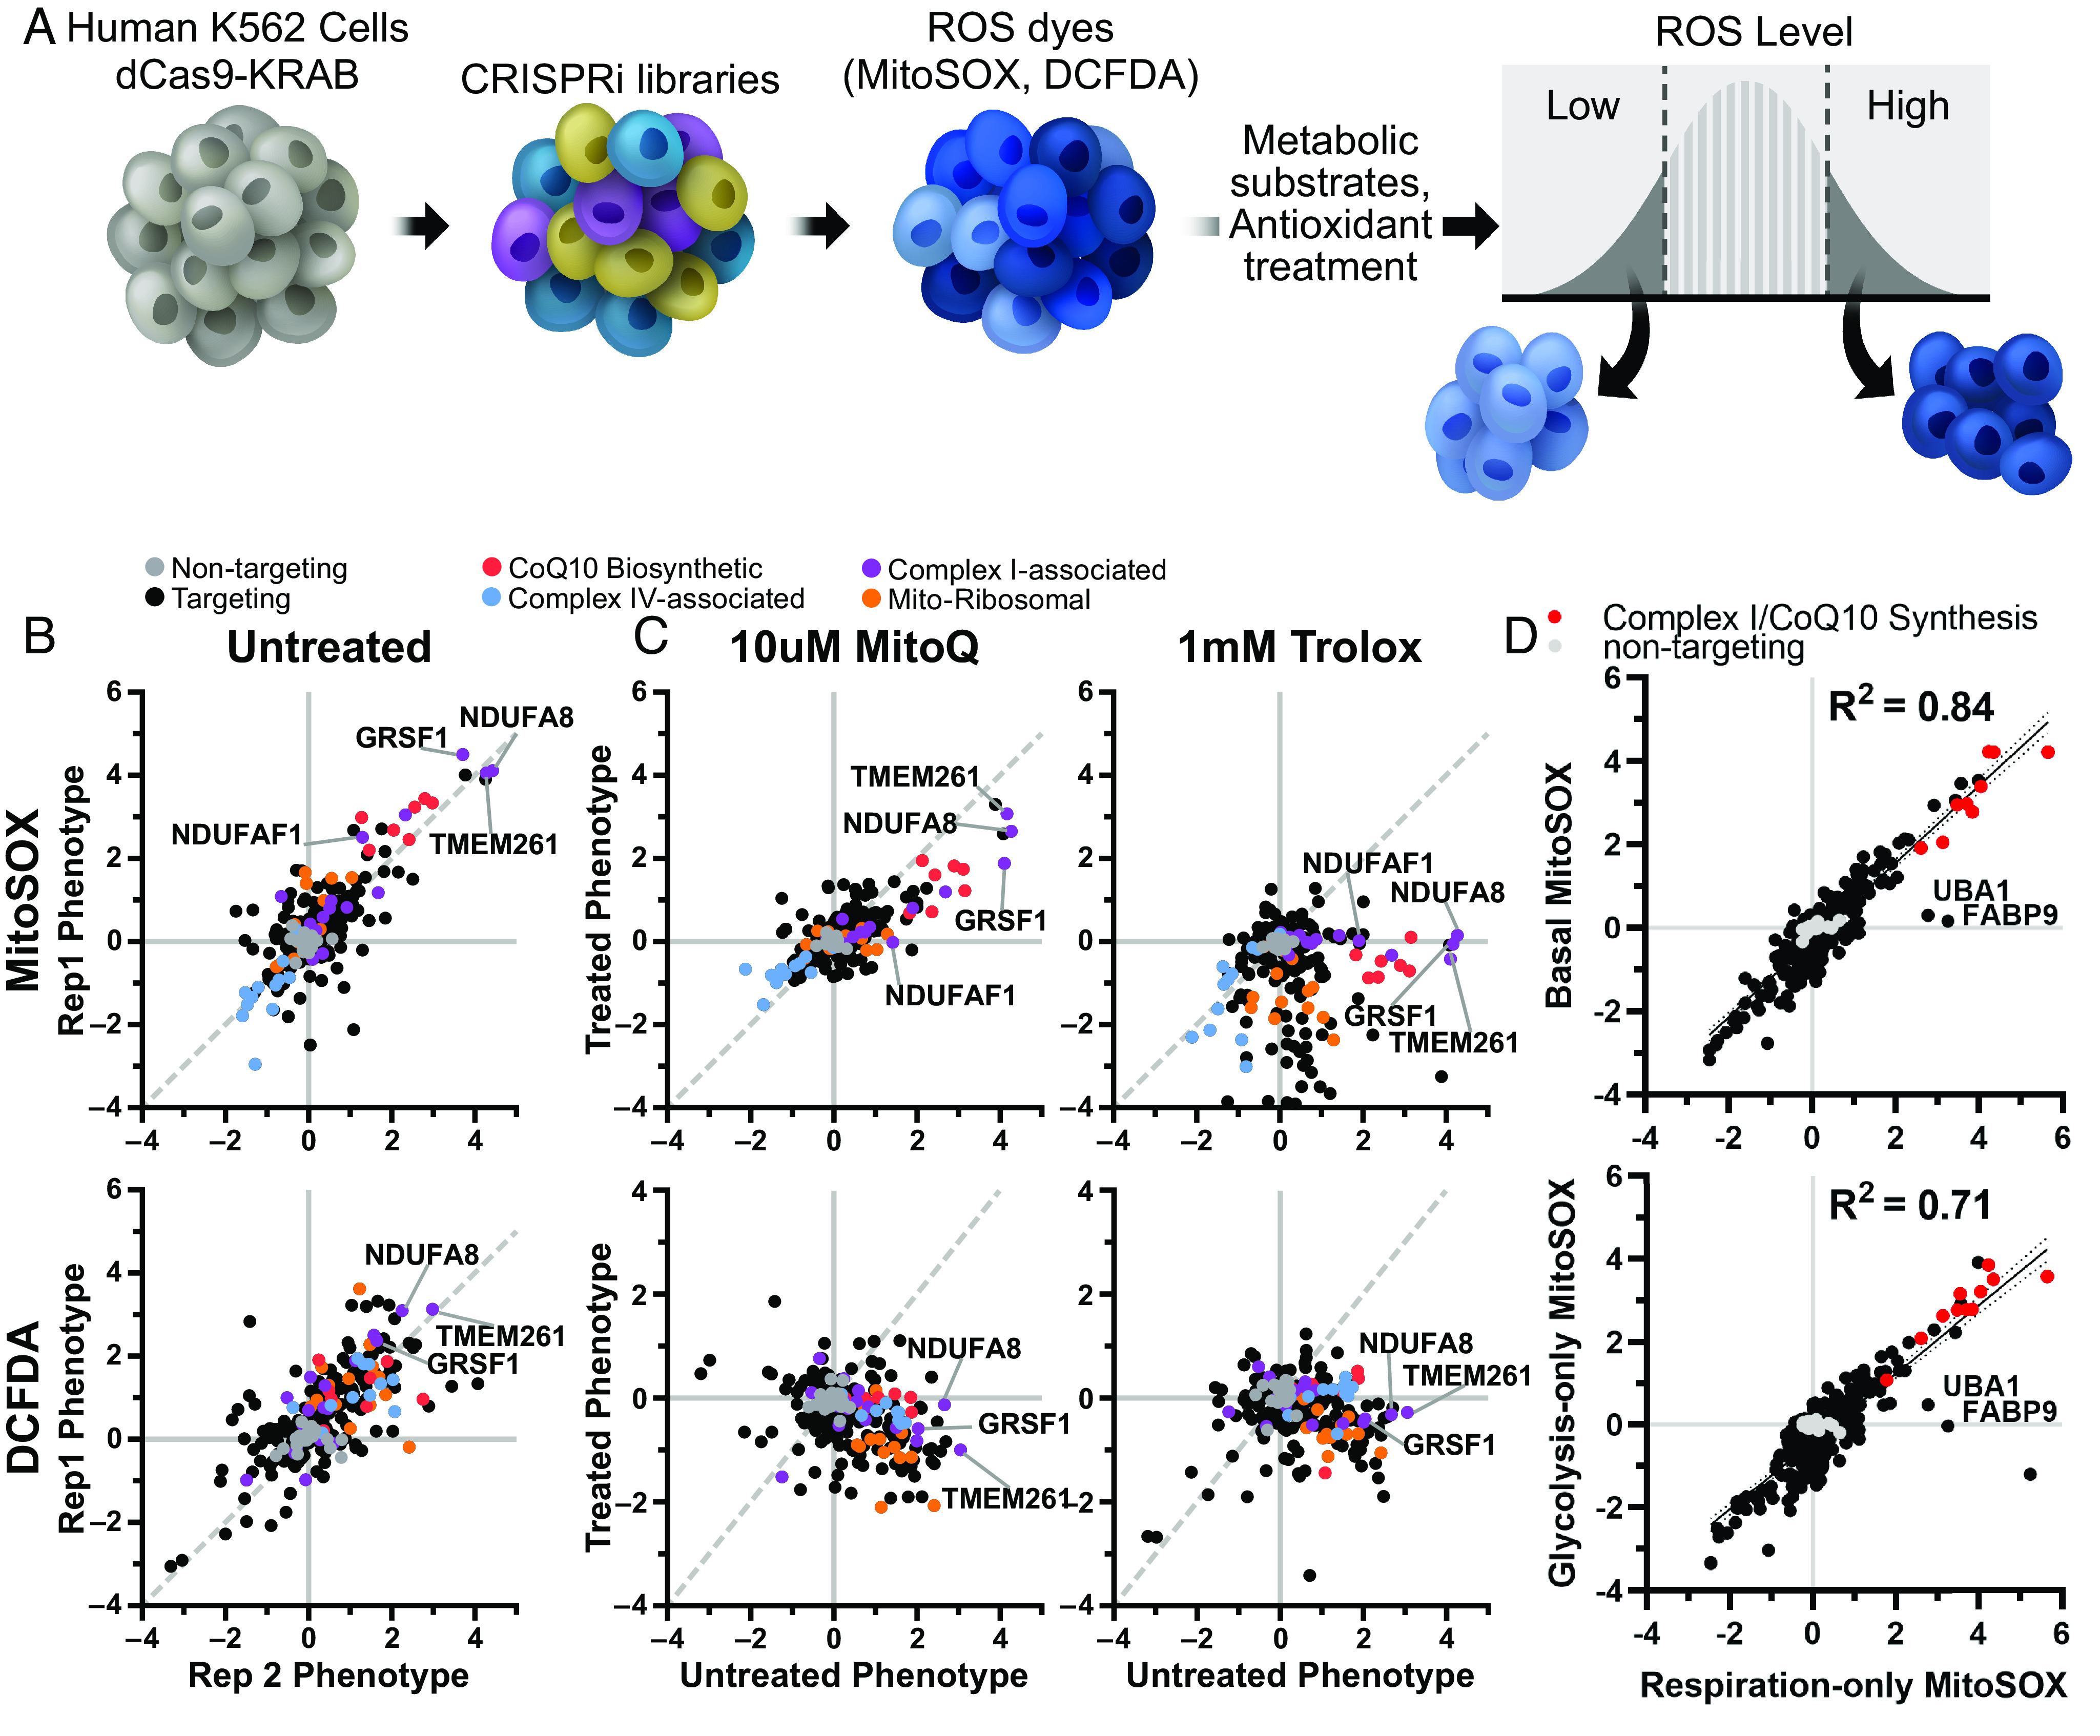
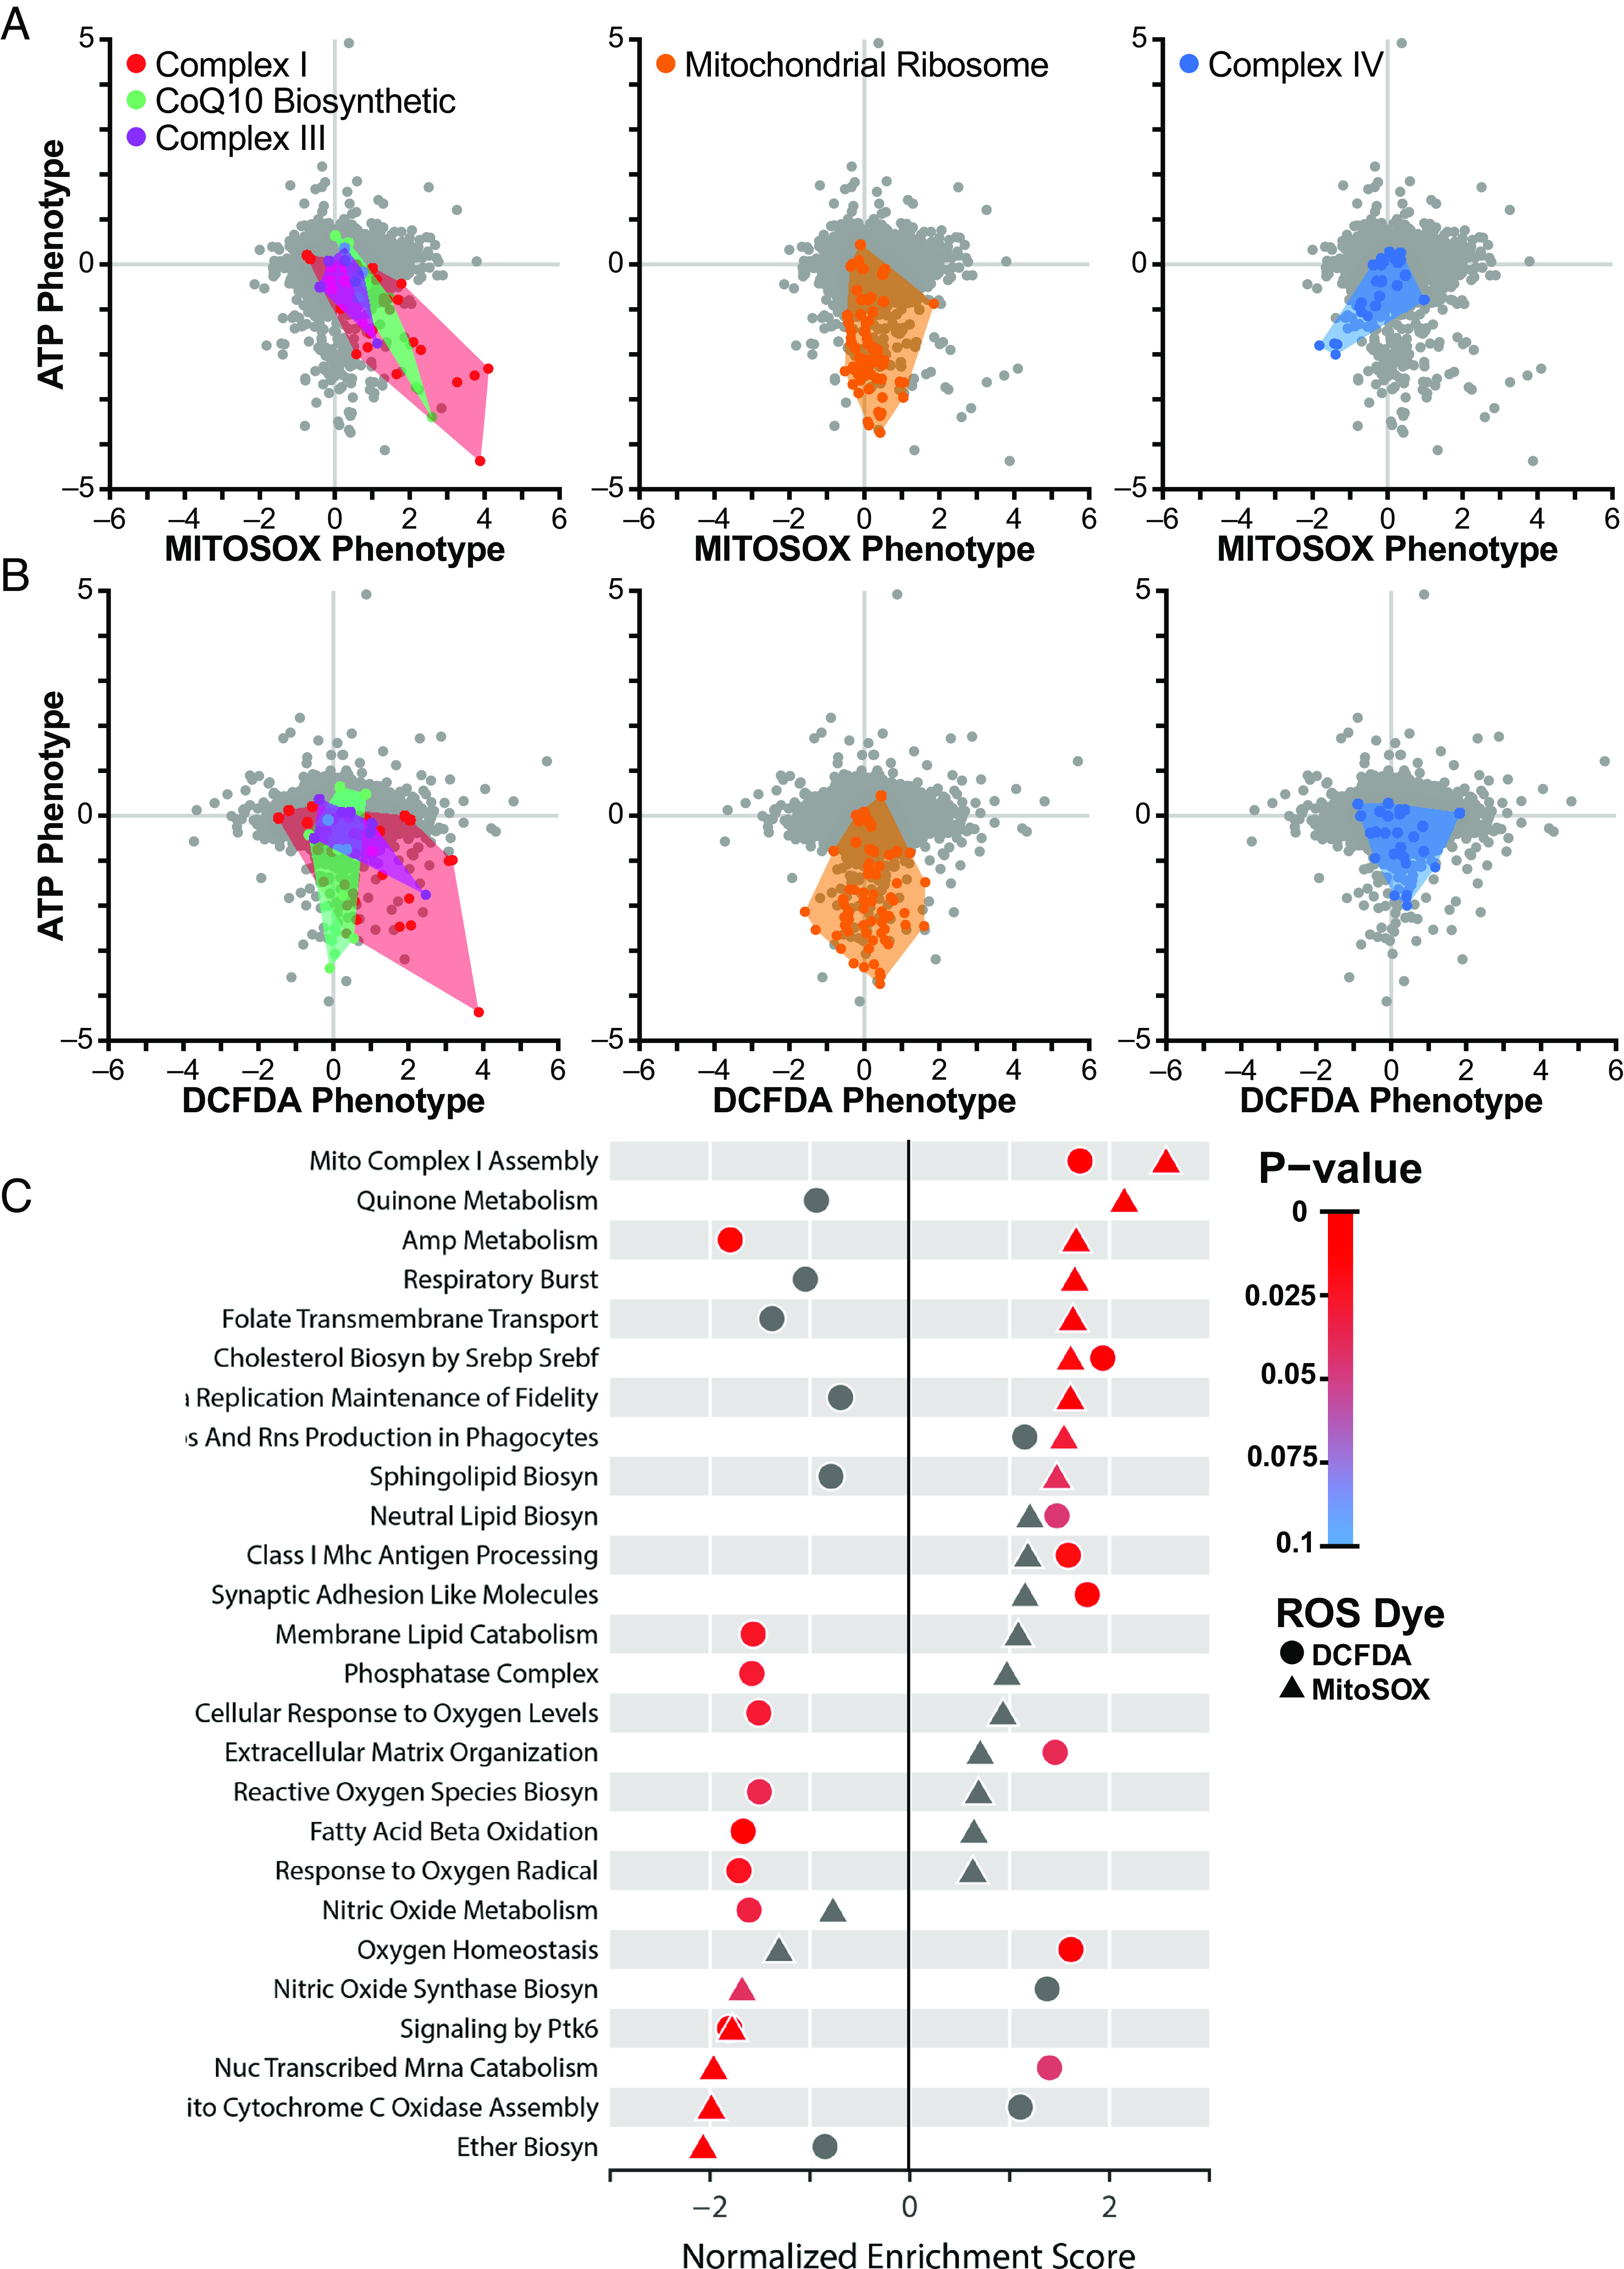
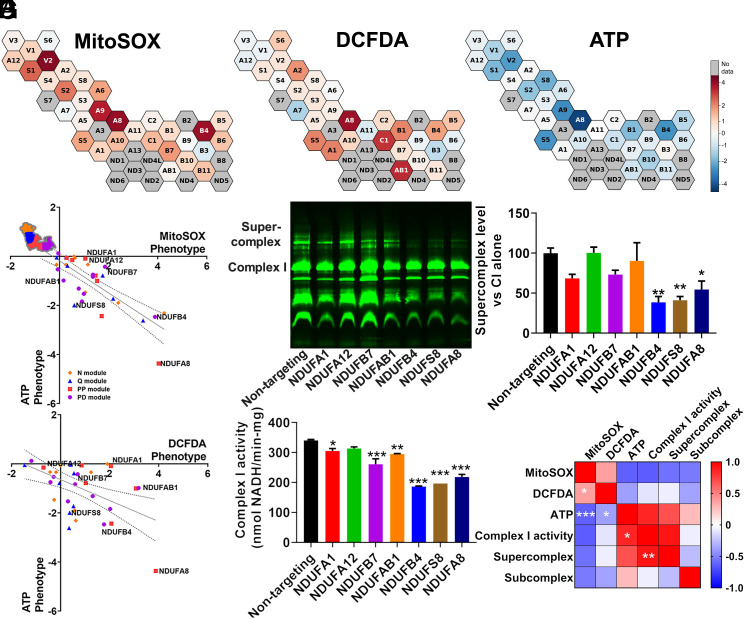
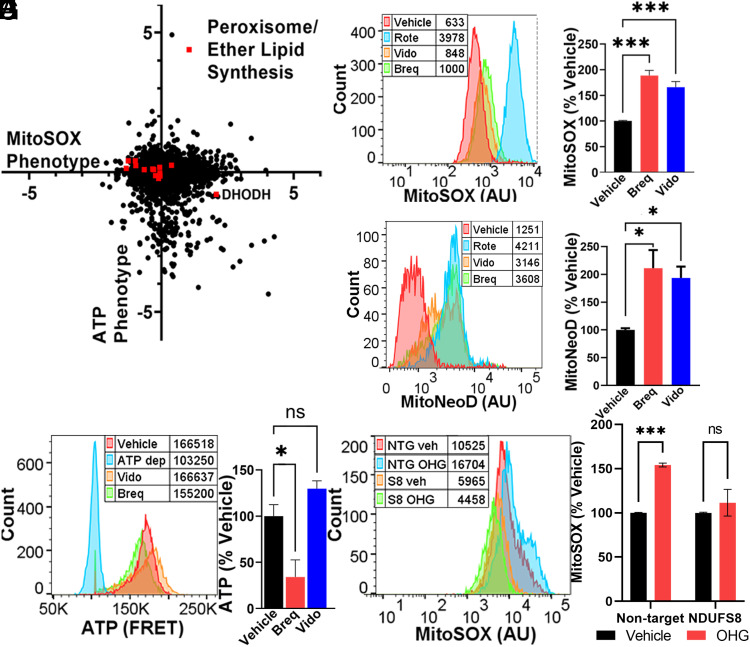
Respiratory chain dysfunction can decrease ATP and increase reactive oxygen species (ROS) levels. Despite the importance of these metabolic parameters to a wide range of cellular functions and disease, we lack an integrated understanding of how they are differentially regulated. To address this question, we adapted a CRISPRi- and FACS-based platform to compare the effects of respiratory gene knockdown on ROS to their effects on ATP. Focusing on genes whose knockdown is known to decrease mitochondria-derived ATP, we showed that knockdown of genes in specific respiratory chain complexes (I, III, and CoQ10 biosynthesis) increased ROS, whereas knockdown of other low ATP hits either had no impact (mitochondrial ribosomal proteins) or actually decreased ROS (complex IV). Moreover, although shifting metabolic conditions profoundly altered mitochondria-derived ATP levels, it had little impact on mitochondrial or cytosolic ROS. In addition, knockdown of a subset of complex I subunits-including NDUFA8, NDUFB4, and NDUFS8-decreased complex I activity, mitochondria-derived ATP, and supercomplex level, but knockdown of these genes had differential effects on ROS. Conversely, we found an essential role for ether lipids in the dynamic regulation of mitochondrial ROS levels independent of ATP. Thus, our results identify specific metabolic regulators of cellular ATP and ROS balance that may help dissect the roles of these processes in disease and identify therapeutic strategies to independently target energy failure and oxidative stress.
Keywords: ATP; CRISPRi; ROS; metabolism; mitochondria.
Conflict of interest statement
Competing interests statement:The authors declare no competing interest.
Figures
Update of
-
Systems-level analyses dissociate genetic regulators of reactive oxygen species and energy production.bioRxiv [Preprint]. 2023 Oct 18:2023.10.14.562276. doi: 10.1101/2023.10.14.562276. bioRxiv. 2023. Update in: Proc Natl Acad Sci U S A. 2024 Jan 16;121(3):e2307904121. doi: 10.1073/pnas.2307904121. PMID: 37904938 Free PMC article. Updated. Preprint.
Similar articles
-
Systems-level analyses dissociate genetic regulators of reactive oxygen species and energy production.bioRxiv [Preprint]. 2023 Oct 18:2023.10.14.562276. doi: 10.1101/2023.10.14.562276. bioRxiv. 2023. Update in: Proc Natl Acad Sci U S A. 2024 Jan 16;121(3):e2307904121. doi: 10.1073/pnas.2307904121. PMID: 37904938 Free PMC article. Updated. Preprint.
-
Opa1 relies on cristae preservation and ATP synthase to curtail reactive oxygen species accumulation in mitochondria.Redox Biol. 2021 May;41:101944. doi: 10.1016/j.redox.2021.101944. Epub 2021 Mar 19. Redox Biol. 2021. PMID: 33780775 Free PMC article.
-
Mitochondrial UCP4 mediates an adaptive shift in energy metabolism and increases the resistance of neurons to metabolic and oxidative stress.Neuromolecular Med. 2006;8(3):389-414. doi: 10.1385/NMM:8:3:389. Neuromolecular Med. 2006. PMID: 16775390
-
Pathophysiological implications of mitochondrial oxidative stress mediated by mitochondriotropic agents and polyamines: the role of tyrosine phosphorylation.Amino Acids. 2015 May;47(5):869-83. doi: 10.1007/s00726-015-1964-7. Epub 2015 Mar 20. Amino Acids. 2015. PMID: 25792113 Review.
-
ROS production by mitochondria: function or dysfunction?Oncogene. 2024 Jan;43(5):295-303. doi: 10.1038/s41388-023-02907-z. Epub 2023 Dec 11. Oncogene. 2024. PMID: 38081963 Review.
Cited by
-
Protein moonlighting by a target gene dominates phenotypic divergence of the Sef1 transcriptional regulatory network in yeasts.Nucleic Acids Res. 2024 Dec 11;52(22):13914-13930. doi: 10.1093/nar/gkae1147. Nucleic Acids Res. 2024. PMID: 39565215 Free PMC article.
-
Uremic toxin receptor NR1H3 contributes to hyperlipidemia- and chronic kidney disease-accelerated vascular inflammation, which is partially suppressed by novel YBX2 anti-ROS pathway.Redox Biol. 2025 Sep;85:103724. doi: 10.1016/j.redox.2025.103724. Epub 2025 Jun 9. Redox Biol. 2025. PMID: 40505347 Free PMC article.
-
NDUFA8 promotes cell viability and inhibits ferroptosis and cisplatin sensitivity by stabilizing Fe-S clusters in cervical cancer.Naunyn Schmiedebergs Arch Pharmacol. 2025 May 8. doi: 10.1007/s00210-025-04237-1. Online ahead of print. Naunyn Schmiedebergs Arch Pharmacol. 2025. PMID: 40335672
-
Imaging flow cytometry reveals divergent mitochondrial phenotypes in mitochondrial disease patients.iScience. 2024 Nov 28;28(1):111496. doi: 10.1016/j.isci.2024.111496. eCollection 2025 Jan 17. iScience. 2024. PMID: 39801833 Free PMC article.
-
Inter-Organelle Crosstalk in Oxidative Distress: A Unified TRPM2-NOX2 Mediated Vicious Cycle Involving Ca2+, Zn2+, and ROS Amplification.Antioxidants (Basel). 2025 Jun 24;14(7):776. doi: 10.3390/antiox14070776. Antioxidants (Basel). 2025. PMID: 40722879 Free PMC article. Review.
References
-
- Rhee S. G., Cell signaling. H2O2, a necessary evil for cell signaling. Science 312, 1882–1883 (2006). - PubMed
-
- Thannickal V. J., Fanburg B. L., Reactive oxygen species in cell signaling. Am. J. Physiol. Lung Cell Mol. Physiol. 279, L1005–L1028 (2000). - PubMed
-
- Ciano M., Fuszard M., Heide H., Botting C. H., Galkin A., Conformation-specific crosslinking of mitochondrial complex I. FEBS Lett. 587, 867–872 (2013). - PubMed
