. 2024 Jan 16;121(3):e2309152121.
doi: 10.1073/pnas.2309152121. Epub 2024 Jan 11.

Liquid-like condensates mediate competition between actin branching and bundling

Affiliations

Liquid-like condensates mediate competition between actin branching and bundling

Kristin Graham et al. Proc Natl Acad Sci U S A. .

Abstract

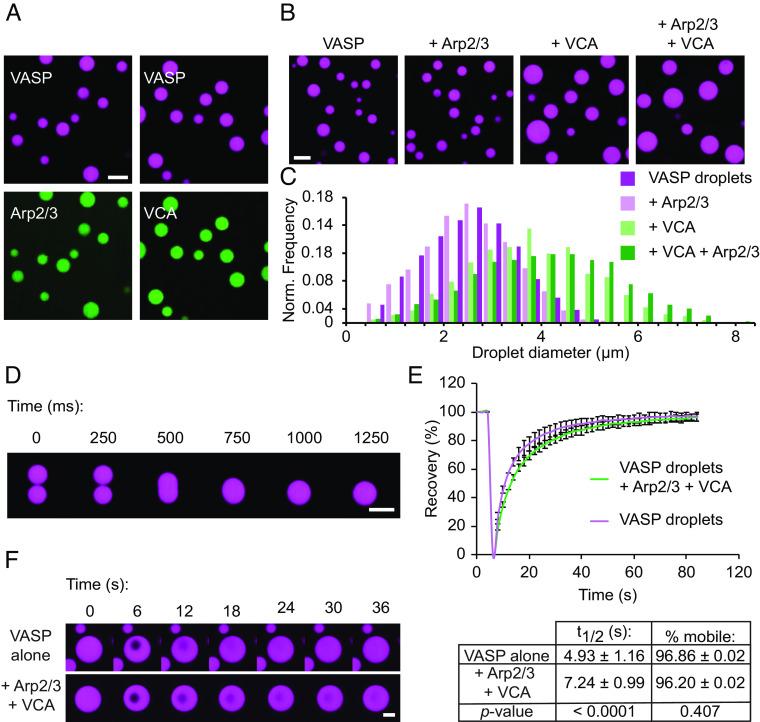
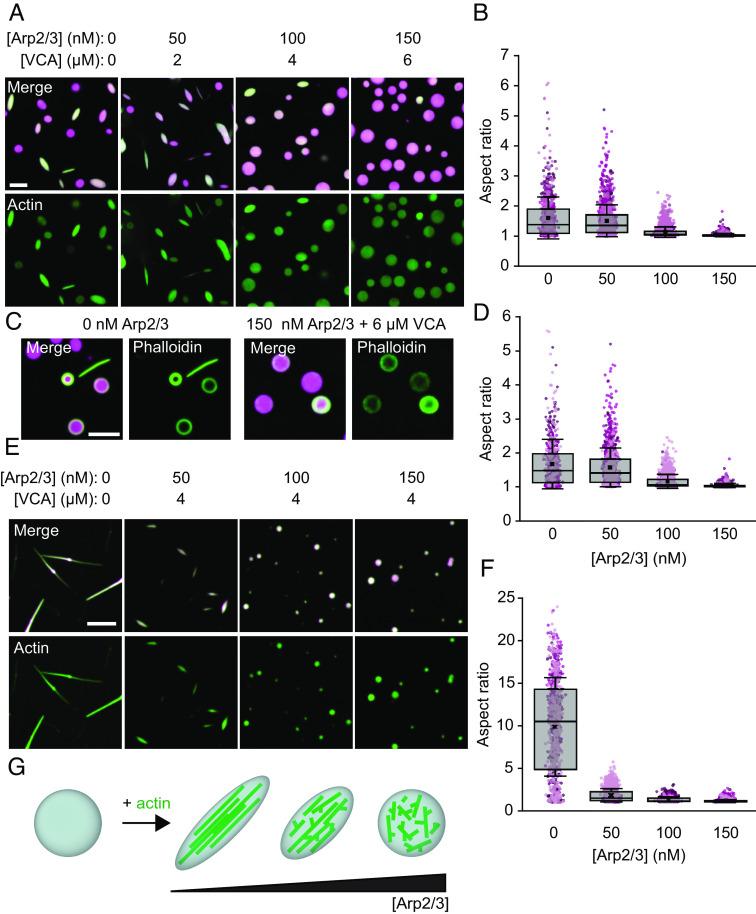
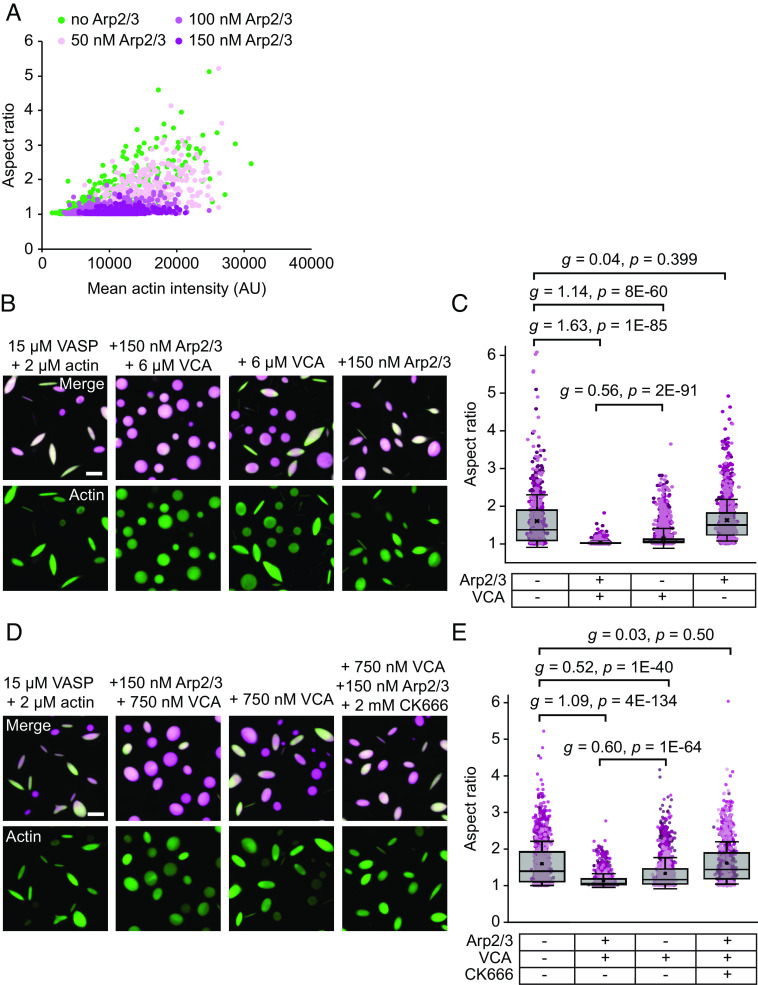
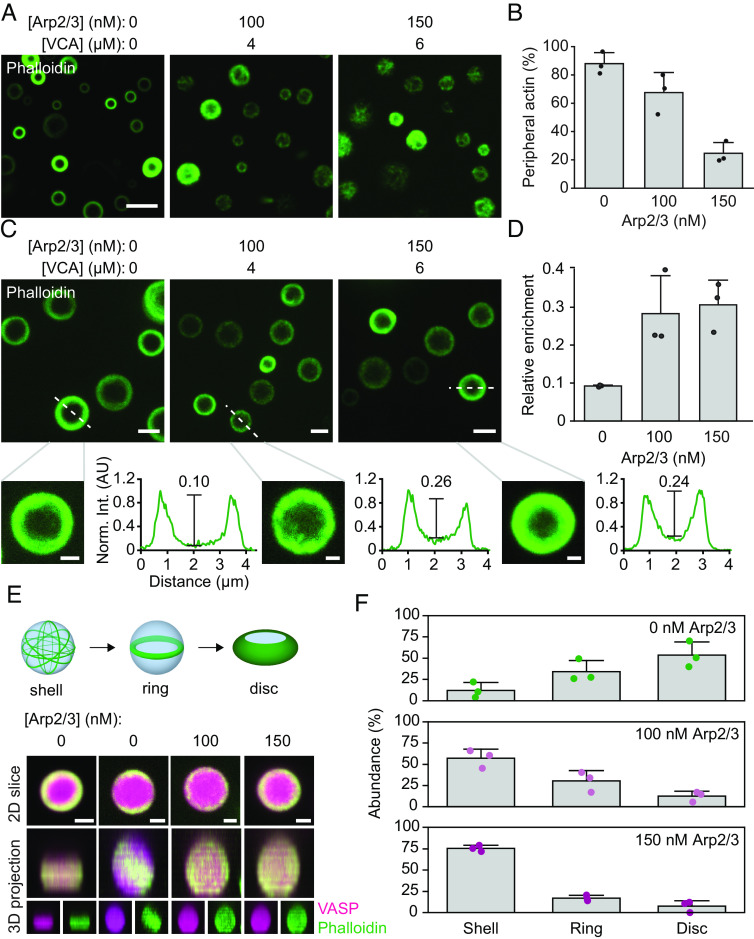
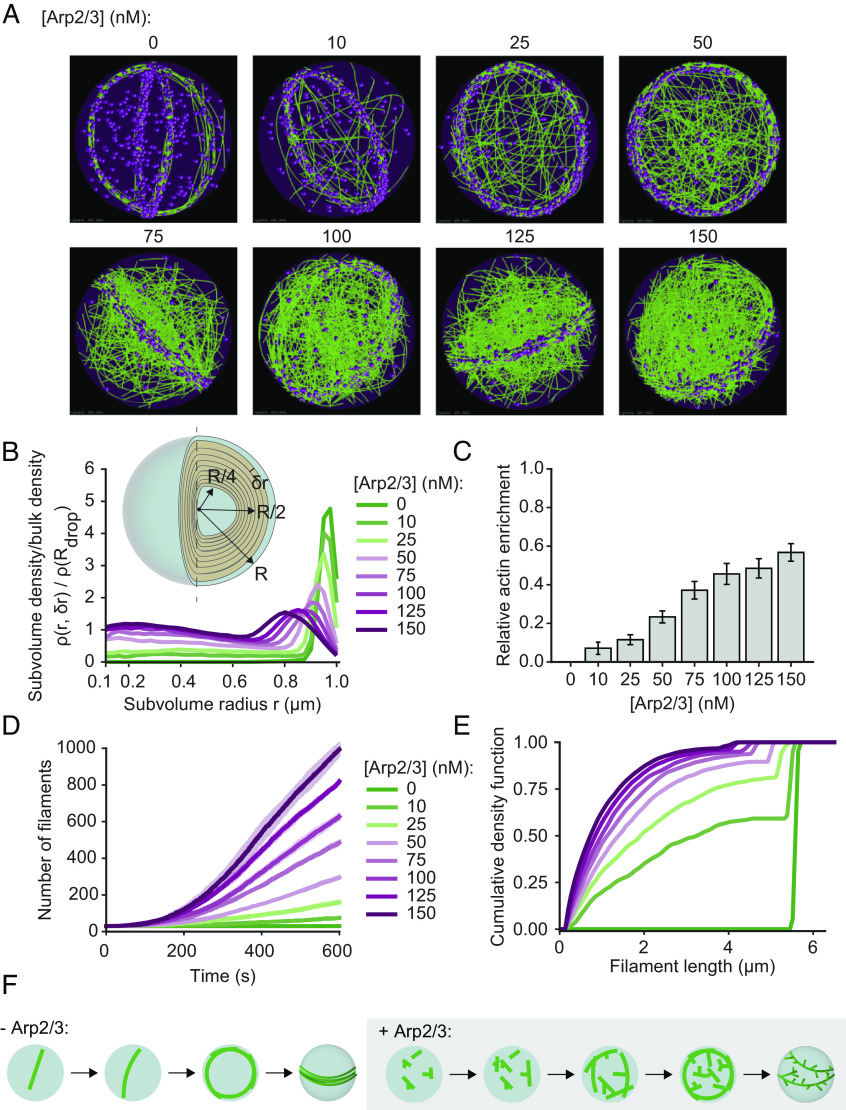
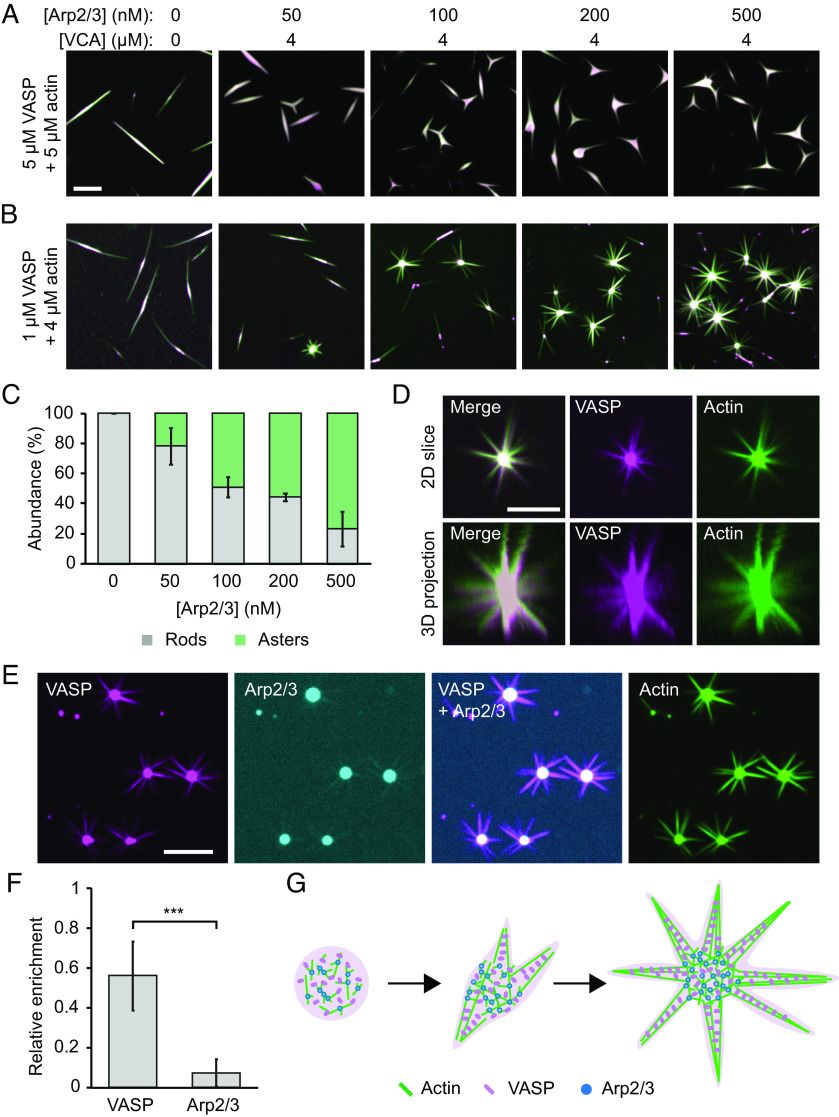
Cellular remodeling of actin networks underlies cell motility during key morphological events, from embryogenesis to metastasis. In these transformations, there is an inherent competition between actin branching and bundling, because steric clashes among branches create a mechanical barrier to bundling. Recently, liquid-like condensates consisting purely of proteins involved in either branching or bundling of the cytoskeleton have been found to catalyze their respective functions. Yet in the cell, proteins that drive branching and bundling are present simultaneously. In this complex environment, which factors determine whether a condensate drives filaments to branch or become bundled? To answer this question, we added the branched actin nucleator, Arp2/3, to condensates composed of VASP, an actin bundling protein. At low actin to VASP ratios, branching activity, mediated by Arp2/3, robustly inhibited VASP-mediated bundling of filaments, in agreement with agent-based simulations. In contrast, as the actin to VASP ratio increased, addition of Arp2/3 led to formation of aster-shaped structures, in which bundled filaments emerged from a branched actin core, analogous to filopodia emerging from a branched lamellipodial network. These results demonstrate that multi-component, liquid-like condensates can modulate the inherent competition between bundled and branched actin morphologies, leading to organized, higher-order structures, similar to those found in motile cells.

Keywords: actin; biomechanics; biomolecular condensate; cytoskeleton; liquid–liquid phase separation.


Conflict of interest statement

Competing interests statement:The authors declare no competing interest.

Figures

Fig. 1.
Fig. 1.
Arp2/3 and VCA participate in phase separation of liquid-like VASP droplets. (A) Enrichment of 1 μM Arp2/3 (labeled with Atto-594, shown in green) or 1 μM VCA (labeled with Atto-488, shown in green) to 20 μM VASP droplets. Droplets are formed in “droplet buffer”: 50 mM Tris pH 7.4, 150 mM NaCl, 3% (w/v) PEG8000. (Scale bar, 5 μm.) (B) Representative images of droplets formed from a 20 μM solution of VASP with either 150 nM Arp2/3, 6 μM VCA, or both 150 nM Arp2/3 and 6 μM VCA. (Scale bar, 5 μm.) (C) Histogram of droplet sizes quantified from B. Data from n = 3 replicates. (D) Composite droplets formed of 20 μM VASP, 150 nM Arp2/3, and 6 μM VCA still remain liquid-like, as exhibited by rapid fusion events. (Scale bar, 5 μm.) (E) Composite droplets formed of 20 μM VASP, 150 nM Arp2/3, and 6 μM VCA display rapid recovery after photobleaching, and the fraction of mobile VASP is nearly equivalent to droplets lacking Arp2/3 and VCA. Curves show the average VASP recovery profile with error bars representing SD for n = 13 droplets for each condition. Inset table shows t1/2 and percent mobile fraction for each condition, with corresponding P-values from an unpaired two-tailed t-test. (F) Representative time series of FRAP of either VASP-only droplets, or composite droplets as quantified in E. (Scale bar, 2 μm.)
Fig. 2.
Fig. 2.
Addition of Arp2/3 and VCA to VASP droplets inhibits droplet deformation and actin bundling. (A) Representative images of droplets formed from 15 μM VASP and 2 μM actin, with increasing concentrations of Arp2/3 and VCA. (Scale bar, 5 μm.) (B) Quantification of aspect ratios of droplets in A. Box represents interquartile range (IQR) with median as a bisecting line, mean as an “x,” and whiskers, which represent SD. Each background data point represents a single droplet, and are color-coded according to the three replicates. For 0 nM Arp2/3, n = 755 droplets; for 50 nM Arp2/3, n = 1,391; for 100 nM Arp2/3, n = 2,123; for 150 nM Arp2/3, n = 2,286. (C) Representative images of phalloidin staining of 2 μM actin polymerized by either 15 μM VASP-only droplets, or 15 μM VASP droplets with 150 nM Arp2/3 and 6 μM VCA. (Scale bar, 5 μm.) (D) Quantification of aspect ratios of droplets in B, filtered for droplets with a minor axis <3 μm. For 0 nM Arp2/3, n = 653 droplets; for 50 nM Arp2/3, n = 1,105; for 100 nM Arp2/3, n = 1,232; for 150 nM Arp2/3, n = 1,040. (E) Representative images of droplets formed from 5 μM VASP, exposed to 0.67 μM actin, with 4 μM VCA and increasing concentrations of Arp2/3. (Scale bar, 5 μm.) (F) Quantification of droplet aspect ratio as a function of Arp2/3 concentration as seen in E. The box represents IQR with median as a bisecting line, mean as an x, and whiskers, which represent SD. Data from three replicates. For 0 nM Arp2/3, n = 656; for 50 nM Arp2/3, n = 1,116; for 100 nM Arp2/3, n = 1,239; for 150 nM Arp2/3, n = 1,006. (G) Cartoon depicting sphere-to-rod transition driven by the ability of VASP droplets to bundle actin filaments, a process which is inhibited by the addition of Arp2/3 and VCA.
Fig. 3.
Fig. 3.
Decreased droplet deformation is due to Arp2/3 and VCA. (A) Relationship between droplet aspect ratio and actin intensity within the droplet for droplets formed from 15 μM VASP and exposed to 2 μM actin with increasing concentrations of Arp2/3 and VCA, as visualized in Fig. 2A. Replicates can be found in SI Appendix, Fig. S1. n = 2,885 droplets counted over at least three images per condition. (B) Representative images of droplets composed of 15 μM VASP and 2 μM actin, with either i) 150 nM Arp2/3 and 6 μM VCA added, ii) only VCA, or iii) only Arp2/3. (Scale bar, 5 μm.) (C) Quantification of droplet aspect ratio measured from B. Box represents IQR with median as a bisecting line, mean as an x, and whiskers represent SD. Data points are color-coded according to three independent replicates. At least 700 droplets were analyzed per condition. Brackets show data tested for effect size using Hedges' g, and significance using an unpaired two-tailed t-test. (D) Representative images of droplets composed of 15 μM VASP and 2 μM actin, with either i) 150 nM Arp2/3 and 750 nM VCA added, ii) only VCA, or iii) Arp2/3, VCA, and the Arp2/3 inhibitor, CK666. (Scale bar, 5 μm.) (E) Quantification of droplet aspect ratio measured from D. The box represents IQR with median as a bisecting line, mean as an x, and whiskers represent SD. Data points are color-coded according to three independent replicates. At least 1,000 droplets were analyzed per condition. Brackets show data tested for effect size using Hedges' g, and significance using an unpaired two-tailed t-test.
Fig. 4.
Fig. 4.
Arp2/3 activity reduces droplet deformation by inhibiting assembly of actin rings. (A) Representative images of droplets formed from 15 μM VASP with 2 μM actin and increasing concentration of Arp2/3 and VCA, stained with phalloidin. (Scale bar, 5 μm.) (B) Quantification of the abundance of droplets with peripheral actin accumulation as a function of Arp2/3 concentration. Bars represent mean ± SD of n = 3 experiments, with three images analyzed per condition. (C, Top) Representative images of droplets formed as in A, exhibiting peripheral accumulation of actin filaments. (Scale bar, 2 μm.) Bottom: Line profiles of actin intensity in designated droplets. The calculated enrichment of actin in the droplet center is displayed above a line that estimates the relative height difference between the droplet center and periphery, which is analogous to the enrichment calculation in D. (Scale bar, 1 μm.) Actin intensities are normalized to the max intensity of each profile. Note that the contrast was adjusted in the zoomed-in inserts to better display the relative intensities in the center of the droplet to the periphery. (D) Quantification of the relative enrichment of actin to the interior of the droplet compared to the periphery. Data are mean ± SD from n = 3 experiments, with 12 droplets analyzed per condition. (E, Top) Cartoon of the different 3D spatial arrangements of droplets with peripheral actin. Bottom: Representative 3D projections of droplets as in C, revealing examples of disc, ring, and shell distributions of actin. (Scale bar, 1 μm.) (F) Distribution of the abundance of actin shells, rings, and discs in droplets formed from 15 μM VASP with 2 μM actin and increasing Arp2/3 and VCA concentrations as shown in AD. Bars are mean ± SD across n = 3 experiments, with 3 images analyzed per condition. Statistical analysis is shown in SI Appendix, Fig. S3.
Fig. 5.
Fig. 5.
Simulations predict that Arp2/3-driven changes to filament length distribution inhibit the formation of actin-rich rings at the droplet periphery. (A) Representative final snapshots (t = 600 s) from rigid droplets (radius = 1 μm) [VASP-tet] = 0.2 μM and various Arp2/3 concentrations are shown. Actin filaments are shown in green while VASP tetramers are shown as magenta spheres. Movie S3 shows the time evolution of the trajectories. (B) Plot shows the mean ratio of actin density within subvolume shells of radius r and thickness δr= 25 nm (shown in Inset) to the overall density of actin within the droplet of radius R. Plot lines are colored based on Arp2/3 concentration. Inset depicts subvolume shells, with shells of radius r = R/4, R/2, and R highlighted, with 0 ≤ r ≤ R. (C) Actin enrichment close to droplet core is calculated as defined in SI Appendix, Methods as the ratio of maximum actin density at the core ( 0.2rC<0.6 ) and periphery ( 0.6rC<1.0 ). Data from six replicates; the last 10 snapshots per replicate were used here. (D) Mean (solid line) and SD (shaded area) in the number of actin filaments are plotted as time traces and colored based on the concentration of Arp2/3. (E) The final distribution of filament lengths (last 10 snapshots per replicate) is plotted as a cumulative density function and colored by Arp2/3 concentration. Data from five replicates. (F) Proposed model describing ring formation in the absence and presence of Arp2/3 activity.
Fig. 6.
Fig. 6.
At high actin-to-VASP ratios, Arp2/3 activity drives aster-like morphologies. (A) Titration of Arp2/3 and 4 μM VCA in droplets formed from 5 μM VASP and exposed to 5 μM actin. (Scale bar, 5 μm.) (B) Titration of Arp2/3 and 4 μM VCA as in A into droplets formed from 1 μM VASP and exposed to 4 μM actin. (Scale bar, 5 μm.) (C) Quantification of the percent of droplets that deformed into rods and asters in B. Bars are mean ± SD across n = 3 experiments, with at least four images analyzed per condition. (D) 3D projection of a representative aster-shaped droplet. (Scale bar, 5 μm.) (E) Representative images of VASP, Arp2/3, and actin intensity distributions throughout aster-shaped droplets. Condition: 1 μM VASP, 500 μM Arp2/3, 4 μM VCA, 4 μM actin. (Scale bar, 5 μm.) (F) Quantification of the relative enrichment of VASP and Arp2/3 to the spokes of aster-shaped droplets. Enrichment is normalized to actin intensity. Droplets formed as in E. Bars are mean ± SD across n = 3 experiments, with 10 droplets analyzed per experiment. Asterisks indicates data tested for significance via an unpaired two-tailed t-test, with P < 0.001. (G) Proposed model for Arp2/3- and VASP- mediated aster formation.

Update of

Similar articles

Cited by

References

    1. Blanchoin L., Boujemaa-Paterski R., Sykes C., Plastino J., Actin dynamics, architecture, and mechanics in cell motility. Physiol. Rev. 94, 235–263 (2014). - PubMed
    1. Stricker J., Falzone T., Gardel M. L., Mechanics of the F-actin cytoskeleton. J. Biomechanics 43, 9–14 (2010). - PMC - PubMed
    1. Fletcher D. A., Mullins R. D., Cell mechanics and the cytoskeleton. Nature 463, 485–492 (2010). - PMC - PubMed
    1. Mattila P. K., Lappalainen P., Filopodia: Molecular architecture and cellular functions. Nat. Rev. Mol. Cell Biol. 9, 446–454 (2008). - PubMed
    1. Padrick S. B., Doolittle L. K., Brautigam C. A., King D. S., Rosen M. K., Arp2/3 complex is bound and activated by two WASP proteins. Proc. Natl. Acad. Sci. U.S.A. 108, E472–E479 (2011). - PMC - PubMed

MeSH terms

LinkOut - more resources