Review
. 2024 Mar:306:107174.
doi: 10.1016/j.bpc.2024.107174. Epub 2024 Jan 7.

The influence of zwitterionic and anionic phospholipids on protein aggregation

Affiliations
Review

The influence of zwitterionic and anionic phospholipids on protein aggregation

Abid Ali et al. Biophys Chem. 2024 Mar.

Abstract

The progressive aggregation of misfolded proteins is the underlying molecular cause of numerous pathologies including Parkinson's disease and injection and transthyretin amyloidosis. A growing body of evidence indicates that protein deposits detected in organs and tissues of patients diagnosed with such pathologies contain fragments of lipid membranes. In vitro experiments also showed that lipid membranes could strongly change the aggregation rate of amyloidogenic proteins, as well as alter the secondary structure and toxicity of oligomers and fibrils formed in their presence. In this review, the effect of large unilamellar vesicles (LUVs) composed of zwitterionic and anionic phospholipids on the aggregation rate of insulin, lysozyme, transthyretin (TTR) and α- synuclein (α-syn) will be discussed. The manuscript will also critically review the most recent findings on the lipid-induced changes in the secondary structure of protein oligomers and fibrils, as well as reveal the extent to which lipids could alter the toxicity of protein aggregates formed in their presence.

Keywords: Amyloid fibrils; LUVs; Neurodegeneration; Oligomers; Toxicity.


Conflict of interest statement

Declaration of competing interest Dmitry Kurouski reports financial support was provided by Texas A&M University. If there are other authors, they declare that they have no known competing financial interests or personal relationships that could have appeared to influence the work reported in this paper.

Figures

Fig. 1.
Fig. 1.
A schematic diagram of α-Syn aggregation. Monomeric α-Syn aggregates into various small oligomers that have different structures and morphologies. Some of these oligomers further propagate into proto-fibrils and fibrils.
Fig. 2.
Fig. 2.
Role of lipids in aggregation of α-syn. (A) Variation in the maximum rate of aggregation of α-syn with changes in the DMPS/α-syn ratio; (B) LUV-based templating of α-syn aggregation. (C) Results of calcein release assay from LUVs of different POPS:POPC ratios after being incubated with monomeric (red bars), oligomeric (blue bars), and fibrillar (black bars) αS, at two different P:L ratios (1:10 and 1:100). (For interpretation of the references to colour in this figure legend, the reader is referred to the web version of this article.)
Fig. 3.
Fig. 3.
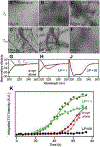
α-Syn remodeling of POPG SUVs and effect on amyloid formation. TEM images of POPG vesicles alone (A), α-syn + POPG SUVs at L/P = 1 (B) and L/P = 50 (C) before (T0) agitation and fibrils formed by α-syn alone (D) and by α-syn + POPG SUVs at L/P = 1 (E) and L/P = 50 (F) after (Tend) agitation (70 μM α-syn in 20 mM MOPS, 100 mM NaCl, pH 7, 37 °C). Length of scale bar is 100 nm. Far-UV CD spectra of α-syn alone (G), L/P = 1 (H), and L/P = 50 (J) at T0 (black) and Tend (red). (K) Aggregation kinetics of α-syn in the absence (red) or presence (green, L/P = 1; black, L/P = 50) of POPG SUVs monitored by ThT fluorescence.
Fig. 4.
Fig. 4.
Negatively charged phospholipids accelerate while zwitterionic phospholipids strongly inhibit insulin aggregation. ThT aggregation kinetics of insulin in the lipid-free environment (red), as well as in the presence of PG (blue), PS (green), CL (black), PC (purple) and PE (orange). Each kinetic curve is the average of three independent measurements. For Ins, 400 μM of bovine insulin was dissolved in 1xPBS with 2 mM of ThT; pH adjusted to pH 3.0. For Ins:PG, Ins:PS, Ins:PS and Ins:CL and Ins:PE, 400 μM of bovine insulin was mixed with an equivalent concentration of the corresponding lipid; pH was adjusted to pH 3.0. All samples were kept at 37 °C under 510 rpm for 24 h. (For interpretation of the references to colour in this figure legend, the reader is referred to the web version of this article.)
Fig. 5.
Fig. 5.
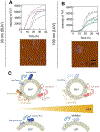
The effect of lipid vesicle size on the aggregation of Aβ1–40. ThT kinetics (top) of Aβ1–40 aggregation in the presence of (pink) and absence (black) of 30 nm (A) and 100 nm (B) DOPC vesicles with corresponding AFM images (bottom) of the formed fibrils; (C) Models of Aβ1–40 aggregation on the surface of defect-rich SUVs and defect-poor LUVs. (For interpretation of the references to colour in this figure legend, the reader is referred to the web version of this article.)
Fig. 6.
Fig. 6.
Length and saturation of FAs in PS uniquely alters the rate of lysozyme aggregation. (A) ThT aggregation kinetics of insulin in the lipid-free environment (grey), and in the presence of DMPS (green), DOPS (blue), POPS (orange), and DSPS (pink). Each kinetic curve is the average of three independent measurements. (B) A histogram of ttakeoff of lysozyme aggregation in the presence of DMPS (green), DOPS (blue), POPS (orange), and DPSP (pink). For Lys, 200 μM of chicken-egg lysozyme was dissolved in 1xPBS with 2 mM of ThT; pH adjusted to pH 3.0. For Lys:DMPS, Lys:DOPS, Lys:POPS, and Lys:DSPS, 200 μM of chicken-egg lysozyme was mixed with an equivalent concentration of the corresponding lipid; pH was adjusted to pH 3.0. All samples were kept at 37 °C under 510 rpm for 160 h. (For interpretation of the references to colour in this figure legend, the reader is referred to the web version of this article.)
Fig. 7.
Fig. 7.
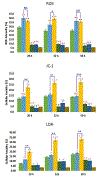
Histograms of ROS (top), JC-1(middle), and LDH (bottom) toxicity assays of α-Syn (green, 70 AD47), α-Syn:PS (light blue, 5B9BD5) and α-Syn:PC (yellow, FFC000) aggregates grown at lag phase (20h), growth phase (32h) and late stage (50 h) of protein aggregation, as well as PC (olive, 385,723) and PS (navy, 2F5597) lipids themselves. Control is in brown (7F6000). The percentage is calculated by comparing the intensity in the test group to the positive control. Red asterisks (*) show the significance of the level of difference between α-Syn and α-Syn aggregates grown in the presence of lipids as well as between lipid samples and α-Syn. Blue asterisks show the significance of the level of difference between α-Syn aggregates formed in PC and PS conditions. NS is a nonsignificant difference, and *p ≤ 0.05, **p ≤ 0.01, and ***p ≤ 0.001. (For interpretation of the references to colour in this figure legend, the reader is referred to the web version of this article.)
Fig. 8.
Fig. 8.
Histograms of LDH (left), ROS (middle) and JC-1 (right) assays reveals differences between cell toxicity of TTR, TTR:POPS, TTR:DOPS, TTR:DMPS, and TTR:DSPS. Black asterisks (*) show a significant level of differences between protein aggregates and the control; purple (LHD), orange (ROS), and green (JC-1) asterisks (*) show significance level of difference between TTR and TTR aggregates formed in the presence of lipids; * P < 0.05, *** P < 0.001, **** P < 0.0001. NS- non significant difference according to One-Way ANOVA and the Tukey HSD posthoc test. (For interpretation of the references to colour in this figure legend, the reader is referred to the web version of this article.)
Fig. 9.
Fig. 9.
Nanoscale analysis of (A) Ins:PC-u (red) and Ins:PC-s (green) and (C) Ins:CL-u (black) and Ins:CL-s (blue) aggregates. Histograms of relative contributions of parallel β-sheet (blue), unordered protein secondary structure (light blue) and antiparallel β-sheet (green) in amide I of AFM-IR spectra collected from two populations (A and B) of Ins:PC-u and Ins:PC-s (B) and Ins:CL-u and Ins:CL-s (D) together with insulin aggregates (Ins) grown in the lipid-free environment. (For interpretation of the references to colour in this figure legend, the reader is referred to the web version of this article.)
Fig. 10.
Fig. 10.
GM1 accelerated Aβ1–40 aggregation. (A) ThT fluorescence intensity of 10 μM Aβ1–40 alone (black) and with varying concentrations of GM1: 1 μM (red), 2.5 μM (green), 20 μM (magenta) and 40 μM (blue) in 20 mM phosphate buffer, pH 7.4 at 37 °C, slow continuous shaking. The line of best fit (yellow, R2 = 0.99) through the data points was obtained by global fitting the data with a sigmoidal function. TEM images of 10 μM Aβ1–40 alone (B), and in the presence of 1 μM GM1 (C and D), acquired after 48 h incubation at physiological pH and temperature conditions. (C and D) Are the images of the same sample taken from two different positions in the TEM grid. (For interpretation of the references to colour in this figure legend, the reader is referred to the web version of this article.)
Fig. 11.
Fig. 11.
Schematic illustration of GM1-induced pore formation in total brain extract lipid (TBE) LUVs.

Similar articles

References

    1. Eisenberg DS, Sawaya MR, Structural studies of amyloid proteins at the molecular level, Annu. Rev. Biochem. 86 (2017) 69–95. - PubMed
    1. Nelson R, Eisenberg D, Structural models of amyloid-like fibrils, Adv. Protein Chem. 73 (2006) 235–282. - PubMed
    1. Chen SW, Drakulic S, Deas E, Ouberai M, Aprile FA, Arranz R, Ness S, Roodveldt C, Guilliams T, De-Genst EJ, Klenerman D, Wood NW, Knowles TP, Alfonso C, Rivas G, Abramov AY, Valpuesta JM, Dobson CM, Cremades N, Structural characterization of toxic oligomers that are kinetically trapped during alpha-synuclein fibril formation, Proc. Natl. Acad. Sci. U. S. A. 112 (2015) E1994–E2003. - PMC - PubMed
    1. Chiti F, Dobson CM, Protein Misfolding, amyloid formation, and human disease: a summary of Progress over the last decade, Annu. Rev. Biochem. 86 (2017) 27–68. - PubMed
    1. Knowles TP, Vendruscolo M, Dobson CM, The amyloid state and its association with protein misfolding diseases, Nat. Rev. 15 (2014) 384–396. - PubMed

Publication types