. 2024 Feb:251:103127.
doi: 10.1016/j.autneu.2023.103127. Epub 2023 Oct 21.

Distribution and morphology of calcitonin gene-related peptide (CGRP) innervation in flat mounts of whole rat atria and ventricles

Affiliations

Distribution and morphology of calcitonin gene-related peptide (CGRP) innervation in flat mounts of whole rat atria and ventricles

Jin Chen et al. Auton Neurosci. 2024 Feb.

Abstract

Calcitonin gene-related peptide (CGRP) is widely used as a marker for nociceptive afferent axons. However, the distribution of CGRP-IR axons has not been fully determined in the whole rat heart. Immunohistochemically labeled flat-mounts of the right and left atria and ventricles, and the interventricular septum (IVS) in rats for CGRP were assessed with a Zeiss imager to generate complete montages of the entire atria, ventricles, and septum, and a confocal microscope was used to acquire detailed images of selected regions. We found that 1) CGRP-IR axons extensively innervated all regions of the atrial walls including the sinoatrial node region, auricles, atrioventricular node region, superior/inferior vena cava, left pre-caval vein, and pulmonary veins. 2) CGRP-IR axons formed varicose terminals around individual neurons in some cardiac ganglia but passed through other ganglia without making appositions with cardiac neurons. 3) Varicose CGRP-IR axons innervated the walls of blood vessels. 4) CGRP-IR axons extensively innervated the right/left ventricular walls and IVS. Our data shows the rather ubiquitous distribution of CGRP-IR axons in the whole rat heart at single-cell/axon/varicosity resolution for the first time. This study lays the foundation for future studies to quantify the differences in CGRP-IR axon innervation between sexes, disease models, and species.

Keywords: Atria; Calcitonin gene-related peptide; Heart; Intrinsic cardiac ganglia; Vasculature; Ventricles.


Conflict of interest statement

Declaration of competing interest No potential conflicts of interest were disclosed.

Figures
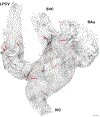
Figure 1.
Figure 1.
Distribution of CGRP-IR axons in the rat right atrium (RA). Hundreds of maximum-projection images taken using a Zeiss M2-Imager were stitched together to create a complete montage of the CGRP-IR axon innervation of the rat RA. CGRP-IR axons entered as large bundles near the left pre-caval vein (LPCV) and superior vena cava (SVC) (large arrows) then bifurcated into small bundles (small open arrows) and finally formed single axons and terminals, which distributed throughout the entire tissue. CGRP-IR axons innervated intrinsic cardiac ganglia (asterisks). Boxes A-C correspond to panels A-C in Figure 6. RAu: right auricle, SVC: superior vena cava, IVC: inferior vena cava, LPCV: left pre-caval vein; SANR: SA node region; AVNR: AV node region; Dotted ellipse: middle-atrium; Scale bar: 1 mm.
Figure 2.
Figure 2.
Distribution of CGRP-IR axons in a rat left atrium. Hundreds of maximum-projection images taken using a Zeiss M2-Imager were stitched together to create a complete montage of the CGRP-IR axon innervation of the rat LA. CGRP-IR axons entered as large bundles (large arrows) then bifurcated into small bundles (small arrows) and finally formed single axons and terminals, which distributed throughout the entire tissue. CGRP-IR axons innervated intrinsic cardiac ganglia (asterisks). Boxes A-C correspond to panels A-C in Figure 7. LAu: left auricle, PV: pulmonary vein; Dotted ellipse: middle-atrium; Scale bar: 1 mm.
Figure 3.
Figure 3.
Zoomed-in views of specific regions of the RA which show the details of CGRP-IR axon networks. A: Large CGRP-IR axon bundles entered along the LPCV and bifurcated into smaller bundles (arrows) towards the RA. Note: though large bundles were found along the LPCV, it is likely that many of these axons actually innervated the left atrium more than the right. Many small axon terminals ramified from these axon bundles and innervated the tissue of the LPCV. B & E-G: Various axon terminal networks innervated different regions of the RA. Dense CGRP-IR axon terminal networks were found in the LPCV (B), the IVC (E), the SVC (F), and the RAu (G). C: A medium-sized ICG innervated by a network of CGRP-IR axons near the SVC (asterisk). D: Three medium-sized ICG near the junction of the LPCV with the RA which were innervated by a network of CGRP-IR axons and formed dense CGRP-IR interconnectives. H: Large CGRP-IR axon bundles entered along the SVC and bifurcated into smaller axon bundles (arrows). Many of the fine terminal axons in the RA originated from these axon bundles. Scale bars: A&H: 500 μm, B-G: 100 μm.
Figure 4.
Figure 4.
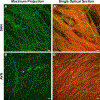
CGRP-IR innervation of the SA and AV node regions (please zoom into the boxes indicated in the whole montage presented in Figure 1 to see the precise location of each of the panels in this figure). A: A maximum projection image showing a dense network of CGRP-IR axons, which was observed in the SA node region of the right atrium. A’: A single optical section image from A showing varicose CGRP-IR axons, which were found within the myocardium. B: A maximum projection image showing a dense network of CGRP-IR axons, which was observed in the AV node region of the right atrium. B’: A single optical section image from B showing varicose CGRP-IR axons which were found within the myocardium. Green: CGRP-IR; Red: Autofluorescence; Scale bar: 20 μm
Figure 5.
Figure 5.
Zoomed-in views of specific regions of the LA which show the details of CGRP-IR axon networks. A: A very dense and complex network of CGRP-IR axons was observed in the SA node ganglionic plexus. Multiple large CGRP-IR axon bundles entered near this area and bifurcated into smaller bundles (arrows). Three large ganglia that were innervated by CGRP-IR axons were observed in this plexus. B-D: Two medium size (B&C) and one large (D) ganglia were innervated by CGRP-IR axons. E: A CGRP-IR axon bundle was oriented towards the LAu and bifurcated (arrows) into many small axon terminals which innervated much of the LAu tissue. F-H: A dense network of CGRP-IR axons innervated the pulmonary veins. Scale bars: A&E: 500 μm, B-D&F-H: 100 μm.
Figure 6.
Figure 6.
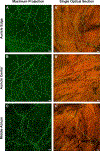
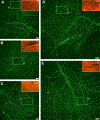
CGRP-IR axons in the wall of the right atrium (please zoom into the boxes indicated in the whole montage presented in Figure 1 to see the precise location of each of the panels in this figure). CGRP-IR axons innervated all areas of the right atrium. A-C: Maximum projection images of the auricle edge, auricle center, and middle atrium, respectively (the boxes indicated in Figure 1) taken with a Leica confocal microscope (40x objective lens; 1 μm z-step). A’-C’: Single optical section images of A-C. Green: CGRP-IR; Red: Autofluorescence; Scale bar: 20 μm.
Figure 7.
Figure 7.
CGRP-IR axons in the wall of the left atrium (please zoom into the boxes indicated in the whole montage presented in Figure 2 to see the precise location of each of the panels in this figure). CGRP-IR axons innervated all areas of the left atrium. A-C: Maximum projection images of the auricle edge, auricle center, and middle atrium, respectively (the boxes indicated in Figure 2) taken with a Leica confocal microscope (40x objective lens; 1 μm z-step). A’-C’: Single optical section images of A-C. Green: CGRP-IR; Red: Autofluorescence; Scale bar: 20 μm.
Figure 8.
Figure 8.
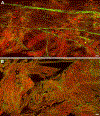
CGRP-IR axons in the epicardial and myocardial layers of the auricle. A: Stitched single optical section images of the epicardial layer near the edge of the right auricle shows that many CGRP-IR axon bundles bifurcated multiple times into individual axons. B: Stitched single optical section images of the myocardial layer near the edge of the right auricle in the same location as in A that shows a dense network of individual CGRP-IR axons. Note: The CGRP-IR axon network in the myocardial layer appears to be much less organized than the epicardial layer. Green: CGRP-IR; Red: Autofluorescence; Scale bar: 20 μm.
Figure 9.
Figure 9.
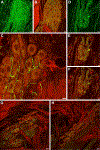
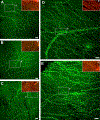
CGRP-IR axons innervated intrinsic cardiac ganglia (ICG). A: Maximum projection image of an ICG showing numerous CGRP-IR axons within the ganglion (40x objective lens; 1.5 μm). B: Single optical section image of the same ICG shown in A showing that the CGRP-IR axons move in between and surround individual ICG principal neurons. C: A single optical section image within the same ICG shown in A and B (2.5x zoom) showing that CGRP-IR axons formed varicosities around individual ICG principal neurons. D: Maximum projection image of a large CGRP-IR axon bundle within an ICG. E-F: Single optical section images of the same ganglion in D at different levels. In contrast to the ganglion shown in A-C numerous CGRP-IR axons passed through this ganglion without wrapping around or forming varicosities around individual ICG principal neurons. G-H: Single optical section images of another ICG. Within this ICG some CGRP-IR axons wrapped around and formed varicose appositions with individual principal neurons, while others passed through the ganglion without forming appositions. Green: CGRP-IR, Red: Autofluorescence. Scale bar: A&B, D-H: 20 μm; C: 10 μm.
Figure 10.
Figure 10.
CGRP-IR axons innervate blood vessels in the atria. A: A maximum projection montage of multiple images collected with a Zeiss M2 Imager (20x objective lens; 1.5 μm z-step) showing a small blood vessel along the surface of the IVC in the RA. B: Maximum projection image of a subset region of the same blood vessel in A taken with a confocal microscope (40x objective lens; 1.5 μm z-step) (20x objective lens; 1.5 μm z-step). Numerous CGRP-IR axons wrapped around the entire length of the blood vessel. B’: Single optical section image of the subset region shown in B taken with a confocal microscope (40x objective lens; 1.5 μm z-step). Green: CGRP-IR; Red: Autofluorescence; Scale bar: A: 200 μm; B and B’: 20 μm.
Figure 11.
Figure 11.
Distribution of CGRP-IR axons in the right ventricle of a rat heart. CGRP-IR axons entered as large bundles along the base of the right ventricle then bifurcated into small bundles and finally formed a network of delicate fibers. Two large axon bundles entered the RV near the dorsal side of the base (adjacent to the AV node in the RA) and two large bundles entered through the ventral side of the base (arrows). In addition, many smaller axon bundles entered the RV through the middle of the base. Scale bar: 1 mm.
Figure 12.
Figure 12.
CGRP-IR axons in the wall of the right ventricle (please zoom into the boxes indicated in the whole montage presented in Figure 11 to see the precise location of each of the panels in this figure). CGRP-IR axons in the muscle of the RV. A-C: Maximum projection images of CGRP-IR axons within the base, center, and apex of the RV, respectively. D&E: Maximum projection images of CGRP-IR axons within the dorsal and ventral sides of the base of the RV, respectively. A’-E’: Single optical sections of the subset regions (white dotted boxes) in A-E, respectively. Green: CGRP-IR; Red: Autofluorescence; Scale bar: 50 μm.
Figure 13.
Figure 13.
Distribution of CGRP-IR fibers in the wall of the left ventricle of a rat heart. CGRP-IR axons entered as large bundles through the aorta (top left) and left pre-caval vein (LPCV, top right) (arrows) on the base of the left ventricle then bifurcated into small bundles and finally formed a network of delicate fibers. Scale bar: 1 mm.
Figure 14.
Figure 14.
CGRP-IR axons in the wall of the left ventricle (please zoom into the boxes indicated in the whole montage presented in Figure 13 to see the precise location of each of the panels in this figure). CGRP-IR axons in the muscle of the LV. A-C: Maximum projection images of CGRP-IR axons within the base, center, and apex of the LV, respectively. D&E: Maximum projection images of CGRP-IR axons within the dorsal and ventral sides of the base of the LV, respectively. A’-E’: Single optical sections of the subset regions (white dotted boxes) in A-E, respectively. Green: CGRP-IR; Red: Autofluorescence; Scale bar: 50 μm.
Figure 15.
Figure 15.
CGRP-IR axons in the epicardium and myocardium of the RV and LV. A&B: Maximum projection images CGRP-IR axons in the epicardium of the RV and LV, respectively. A’&B’: Maximum projection images of the same locations as A&B showing CGRP-IR axons within the myocardium of the RV and LV, respectively. Scale bar: 50 μm.
Figure 16.
Figure 16.
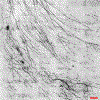
Distribution of CGRP-IR fibers in the interventricular septum. Stitched maximum projection images from the IVS showing a dense network of CGRP-IR axons. Scale bar: 250 μm.

Similar articles

Cited by

References

    1. Randhawa PK & Jaggi AS A review on potential involvement of TRPV1 channels in ischemia–reperfusion injury. J. Cardiovasc. Pharmacol. Ther 23, 38–45 (2018). - PubMed
    1. Tritthart HA et al. Membrane Actions of Calcitonin Gene-Related Peptide in Cardiac and Smooth Muscle Myocytesa. Ann. N. Y. Acad. Sci 657, 216–227 (1992). - PubMed
    1. Al-Rubaiee M. et al. Inotropic and lusitropic effects of calcitonin gene-related peptide in the heart. Am. J. Physiol.-Heart Circ. Physiol 304, H1525–H1537 (2013). - PMC - PubMed
    1. Kumar A, Potts JD & DiPette DJ Protective Role of α-Calcitonin Gene-Related Peptide in Cardiovascular Diseases. Front Physiol 10, 821 (2019). - PMC - PubMed
    1. Rubino A, Ralevic V. & Burnstock G. Calcitonin gene-related peptide (CGRP)-evoked inotropism during hyper- and hypo-sensory-motor innervation in rat atria. J. Auton. Pharmacol 17, 121–127 (1997). - PubMed

Publication types

Substances