Review
. 2024 Summer;26(1):100007.
doi: 10.1016/j.jocmr.2023.100007. Epub 2023 Dec 23.

Society for Cardiovascular Magnetic Resonance 2022 Cases of SCMR case series

Affiliations
Review

Society for Cardiovascular Magnetic Resonance 2022 Cases of SCMR case series

Jason N Johnson et al. J Cardiovasc Magn Reson. 2024 Summer.

Abstract

"Cases of SCMR" is a case series on the SCMR website (https://www.scmr.org) for the purpose of education. The cases reflect the clinical presentation, and the use of cardiovascular magnetic resonance (CMR) in the diagnosis and management of cardiovascular disease. The 2022 digital collection of cases are presented in this manuscript.

Keywords: Arrhythmogenic cardiomyopathy; COVID-19; Cardio-oncology; Congenital Heart disease; Coronary artery aneurysm; Hydatid disease; Hypertrophic cardiomyopathy; Metastatic disease; Myocardial. infarction; Myocarditis; Takotsubo; Vaccine associated myocarditis; Viability.


Conflict of interest statement

Competing interests There are no competing interests. Declaration of Competing Interest The authors declare that they have no known competing financial interests or personal relationships that could have appeared to influence the work reported in this paper.

Figures

Fig. 1
Fig. 1
Case 1. Fig. 1. T2-weighted (T2w) double inversion recovery four chamber view. There is evidence of myocardial edema in the lateral left ventricular (LV) wall.
Fig. 2
Fig. 2
Case 1. Fig. 2. Short axis stack (A-C) and four (D), three (E), two (F) chamber late gadolinium enhancement (LGE) imaging. Possible mid to epicardial hyperenhancement is seen in the basal anterior and inferolateral wall was evident.
Fig. 3
Fig. 3
Case 1. Fig. 3. Axial contrast-enhanced cardiac computed tomography (CT) angiography (CTA). Aneurysmal dilation of the left main coronary artery at 5 mm diameter, and multiple fusiform aneurysms in the left anterior descending (LAD) coronary artery with a giant aneurysm (10 mm diameter) at the proximal portion were depicted.
Fig. 4
Fig. 4
Case 2. Fig. 1. Chest CT without contrast in the axial plane. There are multiple lung masses present.
Fig. 5
Fig. 5
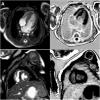
Case 2. Fig. 2. Transthoracic echocardiogram (TTE) apical three chamber view (A,B), parasternal short axis (C), and a modified parasternal short axis with contrast enhancement (D). There is a large mass attached to the interventricular septum.
Fig. 6
Fig. 6
Case 2. Fig. 3. T1 weighted (T1w; A,B) and T2w (C,D) spectral adiabatic inversion recovery (SPAIR) images in mid short axis (A,C) and four chamber (B,D) views. Multiple hyperlucent masses in the LV and right ventricle (RV) on both T1 and T2 weighted images are present.
Fig. 7
Fig. 7
Case 2. Fig. 4. LGE in the basal short axis (A), two chamber (B), and four chamber (C) views. Multiple myocardial masses (arrows) with hyperenhancement are present.
Fig. 8
Fig. 8
Case 2. Fig. 5. Native T1 (A) and T2 (B) parametric mapping images from the mid short axis view. The measured T1 times of the myocardial masses (arrow) are low and T2 mapping times are variable with the yellow arrow at 52 msec and red arrow at 75 msec.
Fig. 9
Fig. 9
Case 3. Fig. 1. Chest x-ray anteroposterior projection. There is cardiomegaly with mild central vascular congestion.
Fig. 10
Fig. 10
Case 3. Fig. 2. TTE parasternal short axis (A), subcostal sagittal (B), and apical four chamber (C,D) views. The RV is anterior to the presumed hypoplastic LV, and a large posterior aneurysm is present. There is flow into the presumed left atrial (LA) appendage aneurysm and presumed hypoplastic LV and mitral atresia (MA).
Fig. 11
Fig. 11
Case 3. Fig. 3. TTE apical five chamber view in 2D (A) and color Doppler (B) and subcostal oblique view in 2D (C) and color Doppler (D). The aorta (Ao) arises from the RV. The pulmonary valve (PV) arises from the RV as well.
Fig. 12
Fig. 12
Case 3. Fig. 4. Flow versus time of the mitral valve annulus inflow (A), gradient echo of the mitral valve annulus en face (B) with corresponding phases contrast (C) image. There is an E and A wave during mitral valve inflow in diastole with flow reversal during systole.
Fig. 13
Fig. 13
Case 3. Fig. 5. Four chamber LGE view. Myocardial fibrosis (arrows) in the lateral wall of the LV.
Fig. 14
Fig. 14
Case 4. Fig. 1. Coronal view CTA. There is a presumed LV pseudoaneurysm (arrow).
Fig. 15
Fig. 15
Case 4. Fig. 2. Parasternal short axis 2D TTE view. There is a LV diverticulum of the inferoseptal wall.
Fig. 16
Fig. 16
Case 4. Fig. 3. Two chamber cine balanced steady state free precession (bSSFP) at end-diastole. There is a diverticulum with a narrow neck involving basal to mid inferior LV segments.
Fig. 17
Fig. 17
Case 4. Fig. 4. Two chamber LGE view. There is no LGE present of the myocardium surrounding the diverticulum.
Fig. 18
Fig. 18
Case 5. Fig. 1. Short axis stack T2 short tau inversion recovery (STIR) images. There is no evidence of myocardial edema.
Fig. 19
Fig. 19
Case 5. Fig. 2. Native T1 (A), extracellular volume (ECV, B), and native T2 (C) maps mid short axis view. There is a regional increase in ECV along the LV lateral wall and normal T1 and T2 map values.
Fig. 20
Fig. 20
Case 5. Fig. 3. Short axis stack (A) and four chamber stack (B) LGE images. There is patchy subepicardial and midmyocardial enhancement in the mid-to basal LV lateral wall.
Fig. 21
Fig. 21
Case 6. Fig. 1. Twelve lead electrocardiogram (ECG) on admission. There is sinus tachycardia with diffuse low voltages present.
Fig. 22
Fig. 22
Case 6. Fig. 2. Coronal chest CTA. There are extensive bilateral lung opacities and atelectasis present.
Fig. 23
Fig. 23
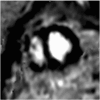
Case 6. Fig. 3. T2w triple inversion recovery short axis mid slice. There is increased signal intensity in the inferior LV wall.
Fig. 24
Fig. 24
Case 6. Fig. 4. Short axis (A) and four chamber (B) LGE images. There is enhancement of the pericardium (arrows) consistent with pericarditis.
Fig. 25
Fig. 25
Case 6. Fig. 5. Native T1 (A), ECV (B), and native T2 (C) mid short axis slices. Normal global native T1 value of 1210 msec (institutional normal < 1270 msec), increased global ECV of 33% (institutional normal < 29%) with patchy areas of further hyperintensity at the mid-inferoseptal (33.9%) and lateral wall (34.8%, arrows). The increased ECV values in the clinical context was interpreted to represent residual myocardial inflammation and edema. The global T2 value was normal at 33 msec and this slice was not the same slice on T2 short tau inversion recovery (STIR).
Fig. 26
Fig. 26
Case 7. Fig. 1. Mid short axis (A), two chamber (B), basal short axis (C), and four chamber (D) cine bSSFP at end-diastole. There is a 15 × 53 mm mass in the RV outflow tract. The LV and RV are mildly dilated.
Fig. 27
Fig. 27
Case 7. Fig. 2. Mid short axis cine bSSFP (A), phase sensitive inversion recovery (PSIR) with inversion time (TI) 600 msec (B), and PSIR with null TI (C), and ECV map (D). The RV outflow tract thrombus (arrows) is well seen.
Fig. 28
Fig. 28
Case 7. Fig. 3. Short axis stack PSIR LGE imaging with dark blood technique. There is significant basal-mid RV outflow tract (RVOT), anterosuperior free wall, and RV endocardial anteroseptal at the ventricular septal defect (VSD) patch site hyperenhancement with a large, laminated RVOT thrombus (yellow arrows). There is a punctate apical inferolateral transmural hyperenhancement from prior LV vent site (blue arrows).
Fig. 29
Fig. 29
Case 7. Fig. 4. Basal short axis PSIR LGE image. The RVOT thrombus is interposed between transannular patch and VSD patch. Dense hyperenhancement is seen at the anterior right ventricular free wall, infundibulum, and endocardial septum.
Fig. 30
Fig. 30
Case 7. Fig. 5. Off axis sagittal computed tomography angiogram. There is a thrombus (arrows) in the RVOT.
Fig. 31
Fig. 31
Case 7. Fig. 6. Mid short axis cine bSSFP follow-up. There is a 7 × 40 mm thrombus (arrow) along the RVOT patch.
Fig. 32
Fig. 32
Case 8. Fig. 1. Basal short axis LGE image. No hyperenhancement at the 2 week scan.
Fig. 33
Fig. 33
Case 8. Fig. 2. Magnitude and PSIR four chamber (A) and basal short axis (B) images. Sub-endocardial partial thickness LGE of the basal septal myocardium.
Fig. 34
Fig. 34
Case 9. Fig. 1. Twelve lead ECG. There is rightward axis with right bundle branch block and epsilon waves in leads V3 to V5 (arrows).
Fig. 35
Fig. 35
Case 9. Fig. 2. Anteroposterior (A) and lateral (B) projections during invasive coronary angiography. There is normal left sided and right coronary artery anatomy.
Fig. 36
Fig. 36
Case 9. Fig. 3. Two chamber (A) and four chamber (B) (LGE images. There is patchy mid myocardial LGE in the LV inferior wall often seen in hypertrophic cardiomyopathy. There is LV apical aneurysm without confluent myocardial scarring and presence of a thrombus confirmed by avascularity of the mass. There is subtle LGE in the sub-tricuspid region of the RV free wall often seen in arrhythmogenic cardiomyopathy (B).
Fig. 37
Fig. 37
Case 10. Fig. 1. PET CT images of the brain (A,B), mediastinum (C), and pelvis (D). There are metastatic lesions with interdigitating edema (A) with photopenia in the high right fronto-temporal lobes (B). Low level FDG uptake in the LA (C) and intensely FDG avid lesions involving the left pelvis (D) are present.
Fig. 38
Fig. 38
Case 10. Fig. 2. Chest CTA in the axial (A), coronal (B), and sagittal (C) planes. The LA mass (arrows) is extending into the right upper and middle pulmonary veins.
Fig. 39
Fig. 39
Case 10. Fig. 3. Four chamber (A-C) and coronal (D-F) views in T1 (A,D), T2 without fat saturation (B,E), and T2 with fat saturation (C,F) dark blood sequences. The LA mass was hypointense on T1 weighted images (A,D) and seen extending into the right pulmonary veins (arrows, A-C). The mass (arrows) was hyperintense on T2w sequences both with (C,F) and without (B,E) fat saturation.
Fig. 40
Fig. 40
Case 10. Fig. 4. Two chamber (A,B) and four chamber (C-E) magnitude (A,C,E) and PSIR (B,D) sequences. There is heterogenous LGE of the LA mass (arrows) on sequences that null the myocardium (A-D). The high inversion time (600 msec) sequence (E) suggests evidence of some thrombus adherent to the mass (arrow).
Fig. 41
Fig. 41
Case 11. Fig. 1. 12-lead ECG on admission. The ECG shows low voltage, R-wave reduction and ST-segment elevation in leads V2-V5 indicating acute myocardial injury.
Fig. 42
Fig. 42
Case 11. Fig. 2. Coronary angiogram anteroposterior projection. There is subtotal occlusion of the LAD (arrows).
Fig. 43
Fig. 43
Case 11. Fig. 3. Pre-contrast T2w turbo spin echo images in apical (A), mid (B), basal (C) short-axis orientation. Increased signal intensity of the myocardium in the apical and mid segments indicates myocardial edema, and the basal segments are unaffected.
Fig. 44
Fig. 44
Case 11. Fig. 4. Post-contrast PSIR images in two chamber (A), three chamber (B), four chamber (C), and mid short-axis (D) orientations. There is a mild sub-endocardial LGE of the distal septal and apical segments.
Fig. 45
Fig. 45
Case 11. Fig. 5. 12-lead ECG two days after presentation. Q-waves have developed in the anterior leads and ST-segment elevation has largely resolved.
Fig. 46
Fig. 46
Case 11. Fig. 6. Post-contrast PSIR image in four chamber orientation. Mild sub-endocardial LGE of the distal septal and apical segments persists.
Fig. 47
Fig. 47
Case 11. Fig. 7. 12-lead ECG three months after presentation. There is recovery of R-wave amplitude in the anterior leads.
Fig. 48
Fig. 48
Case 12. Fig. 1. Presenting 12-lead ECG. There is incomplete right bundle branch block with T-wave inversion in the anterior leads.
Fig. 49
Fig. 49
Case 12. Fig. 2. Coronary angiogram in anteroposterior projection. There is an abrupt tapering (arrow) of the obtuse marginal 1 branch of the left circumflex, concerning for spontaneous coronary artery dissection.
Fig. 50
Fig. 50
Case 12. Fig. 3. Four chamber (A) and three chamber (B) T2w double inversion recovery sequences. There is sub-endocardial hyperenhancement of the mid to distal anterolateral walls (arrows) indicating edema.
Fig. 51
Fig. 51
Case 12. Fig. 4. Apical short axis rest first pass perfusion. There is a sub-endocardial rest perfusion defect in the apical LV lateral wall (arrow).
Fig. 52
Fig. 52
Case 12. Fig. 5. Four chamber (A) and three chamber (B) LGE images. There is sub-endocardial LGE with pockets of microvascular obstruction (arrows) in the mid to apical anterolateral and inferolateral walls.
Fig. 53
Fig. 53
Case 13. Fig. 1. Chest x-ray anteroposterior projection. There is mediastinal widening concerning for a pericardial effusion.
Fig. 54
Fig. 54
Case 13. Fig. 2. Chest CTA with contrast in axial (A,B) and coronal (C) slices. There is a multiloculated cystic lesion with enhanced septations encasing the LAD and left circumflex coronary arteries (arrow).
Fig. 55
Fig. 55
Case 13. Fig. 3. Mid short axis cine balanced steady state free precession (bSSFP) (A), T1w (B), T2w (C), first pass perfusion (D), and PSIR post contrast (E) slices. The cyst (*) is isointense on bSSFP, T1w, hyperintense on T2w imaging, and hypointense on perfusion with contrast and PSIR LGE imaging.
Fig. 56
Fig. 56
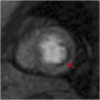
Case 13. Fig. 4. Mid short axis PSIR post contrast. There is near transmural LGE of the mid lateral LV wall (arrow).

References

    1. Dahiya A., Chao C., Younger J., Kar J., Baldwin B.M., Cohen M.V., et al. Society for Cardiovascular Magnetic Resonance 2019 case of the week series. J Cardiovasc Magn Reson. 2021;23(1) - PMC - PubMed
    1. Johnson J.N., Mandell J.G., Christopher A., Olivieri L.J., Loke Y.H., Campbell M.J., et al. Society for Cardiovascular Magnetic Resonance 2020 case of the week series. J Cardiovasc Magn Reson. 2021;23(1) - PMC - PubMed
    1. Johnson J.N., Loriaux D.B., Jenista E., Kim H.W., Baritussio A., De Garate Iparraguirre E., et al. Society for Cardiovascular Magnetic Resonance 2021 cases of SCMR and COVID-19 case collection series. J Cardiovasc Magn Reson. 2022;24(1) - PMC - PubMed
    1. Bellino S., Punzo O., Rota M.C., Del Manso M., Urdiales A.M., Andrianou X., et al. COVID-19 disease severity risk factors for pediatric patients in Italy. Pediatrics. 2020;146(4) - PubMed
    1. Molaei A., Sadeghi-Shabestari M., Khomahani A., Ghaffari S., Sadat-Ebrahimi S.-R. Cardiac Biomarkers for early detection of cardiac involvement in children with Kawasaki disease: A cross-sectional study. International Journal of Pediatrics. 2019;7(12):10573–10582.