. 2024 Feb 14;32(2):162-169.e3.
doi: 10.1016/j.chom.2023.12.003. Epub 2024 Jan 10.

Post-pandemic memory T cell response to SARS-CoV-2 is durable, broadly targeted, and cross-reactive to the hypermutated BA.2.86 variant

Affiliations

Post-pandemic memory T cell response to SARS-CoV-2 is durable, broadly targeted, and cross-reactive to the hypermutated BA.2.86 variant

Rofhiwa Nesamari et al. Cell Host Microbe. .

Abstract

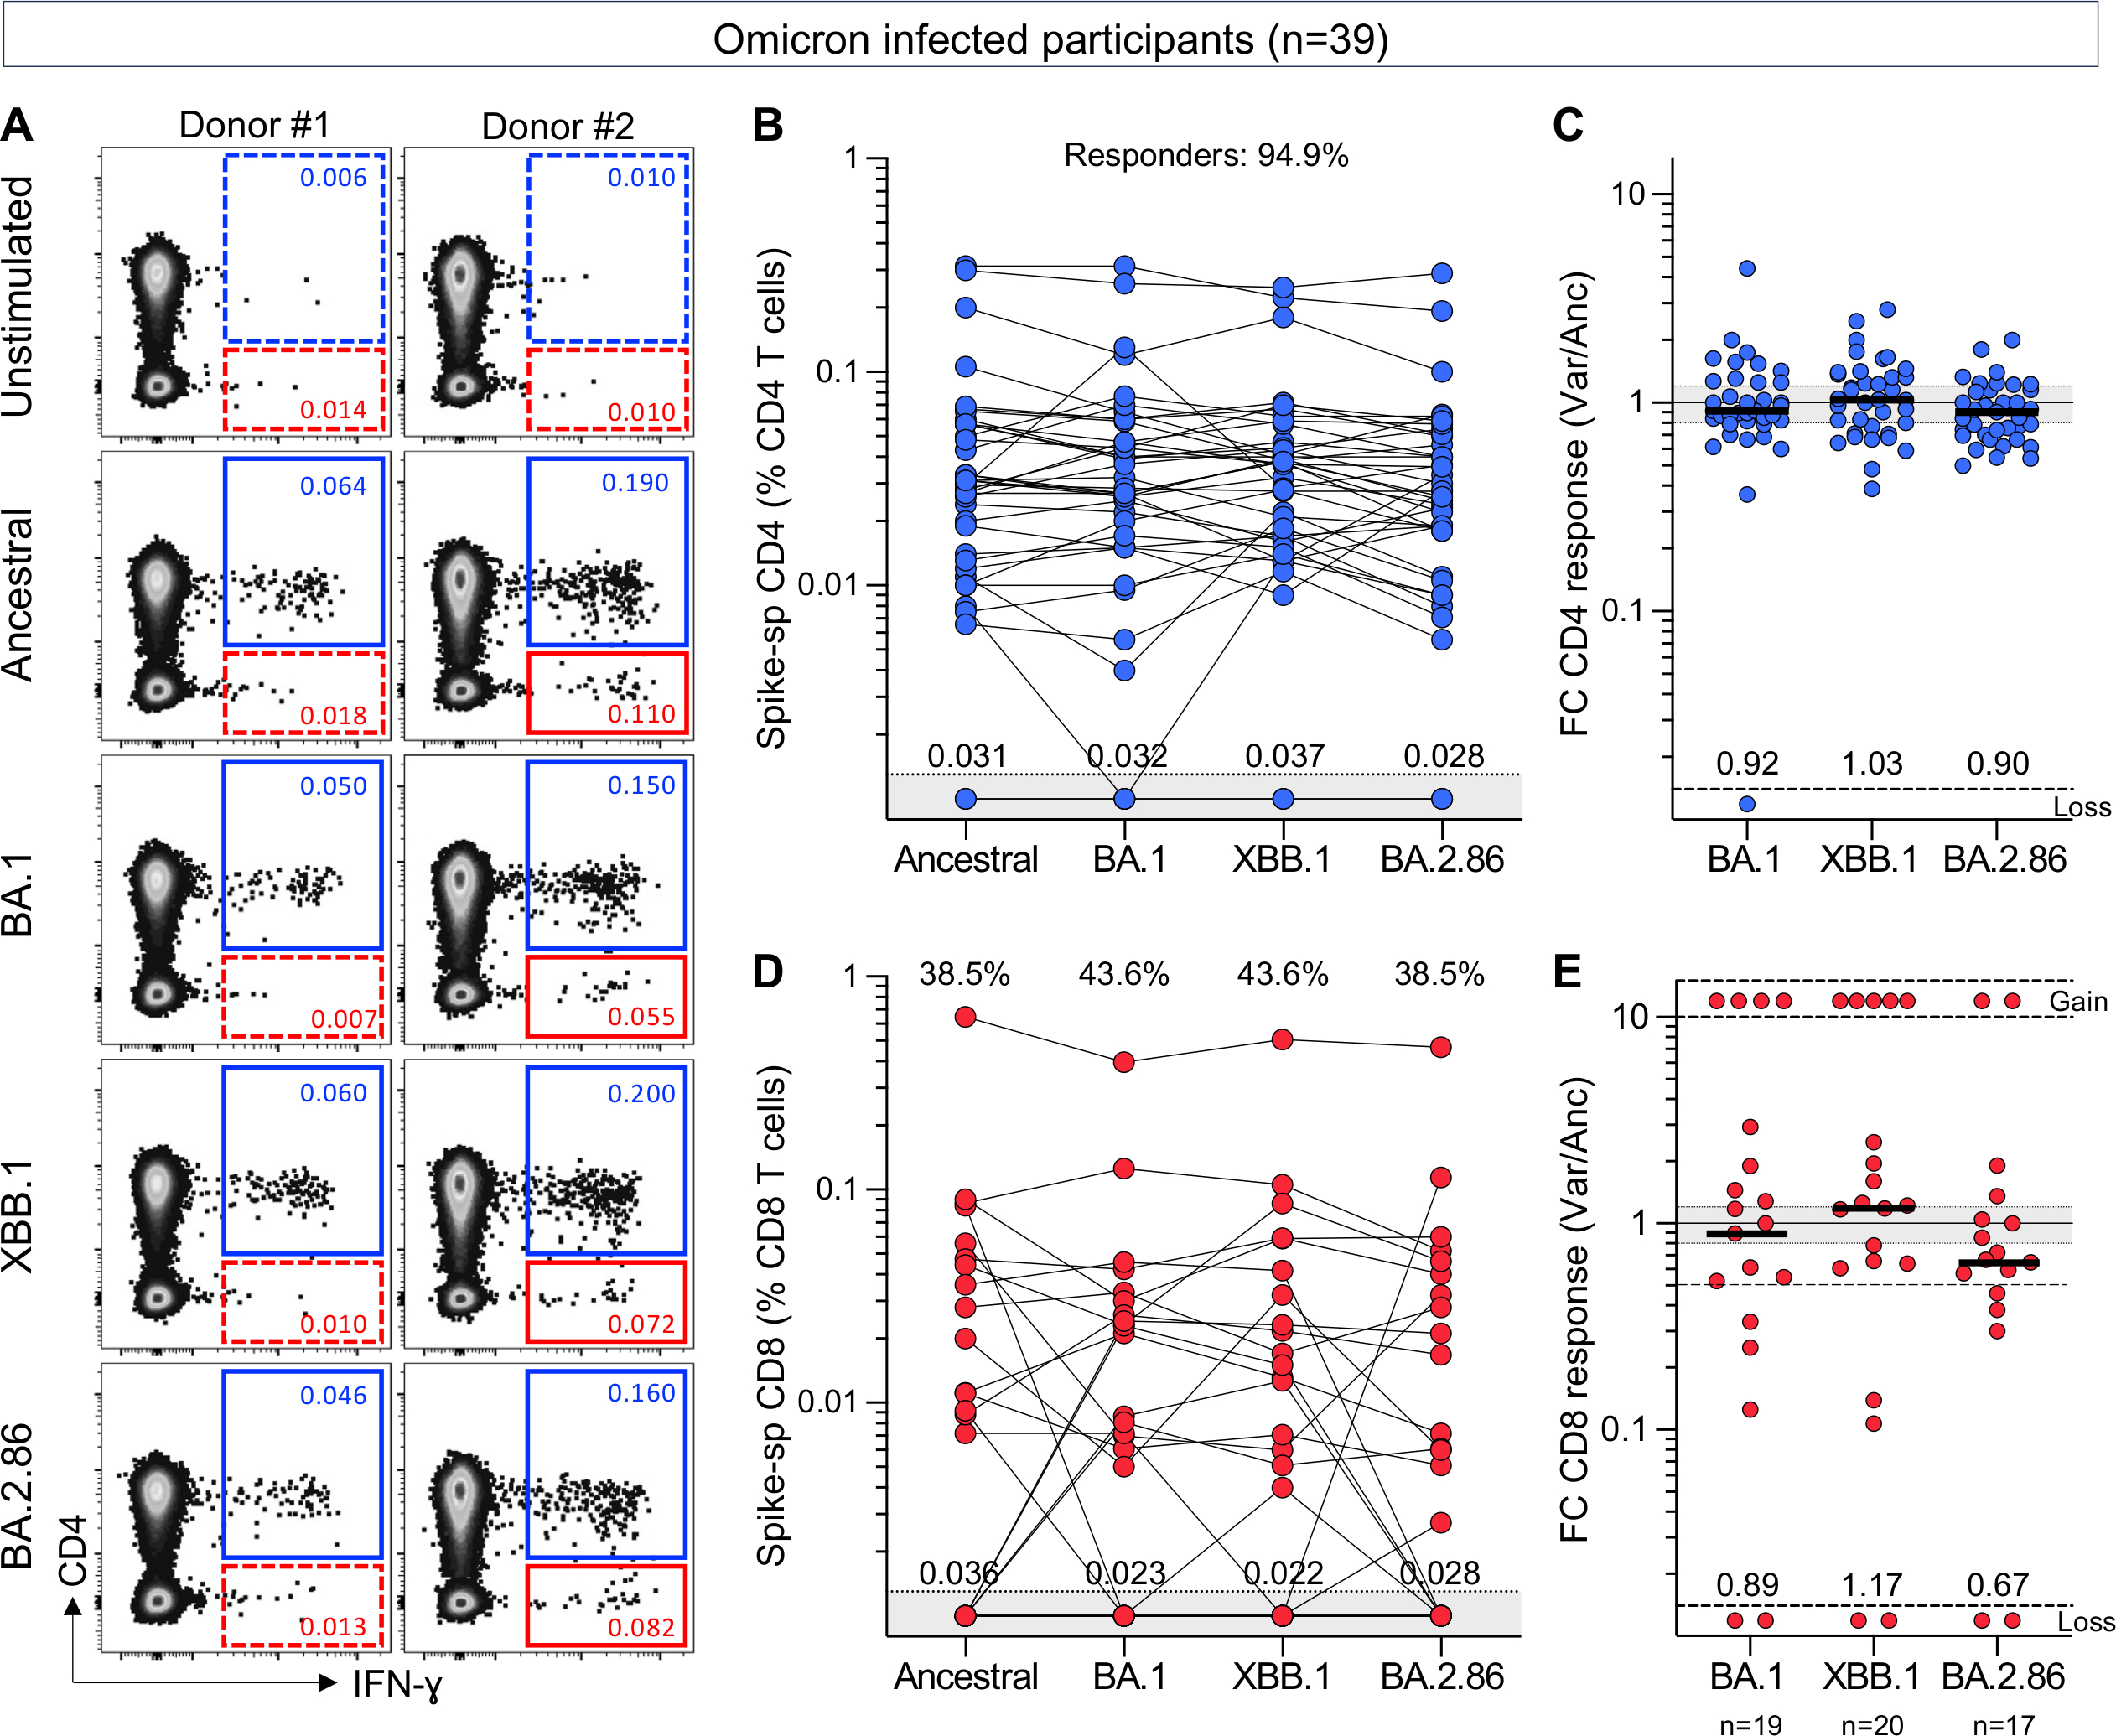
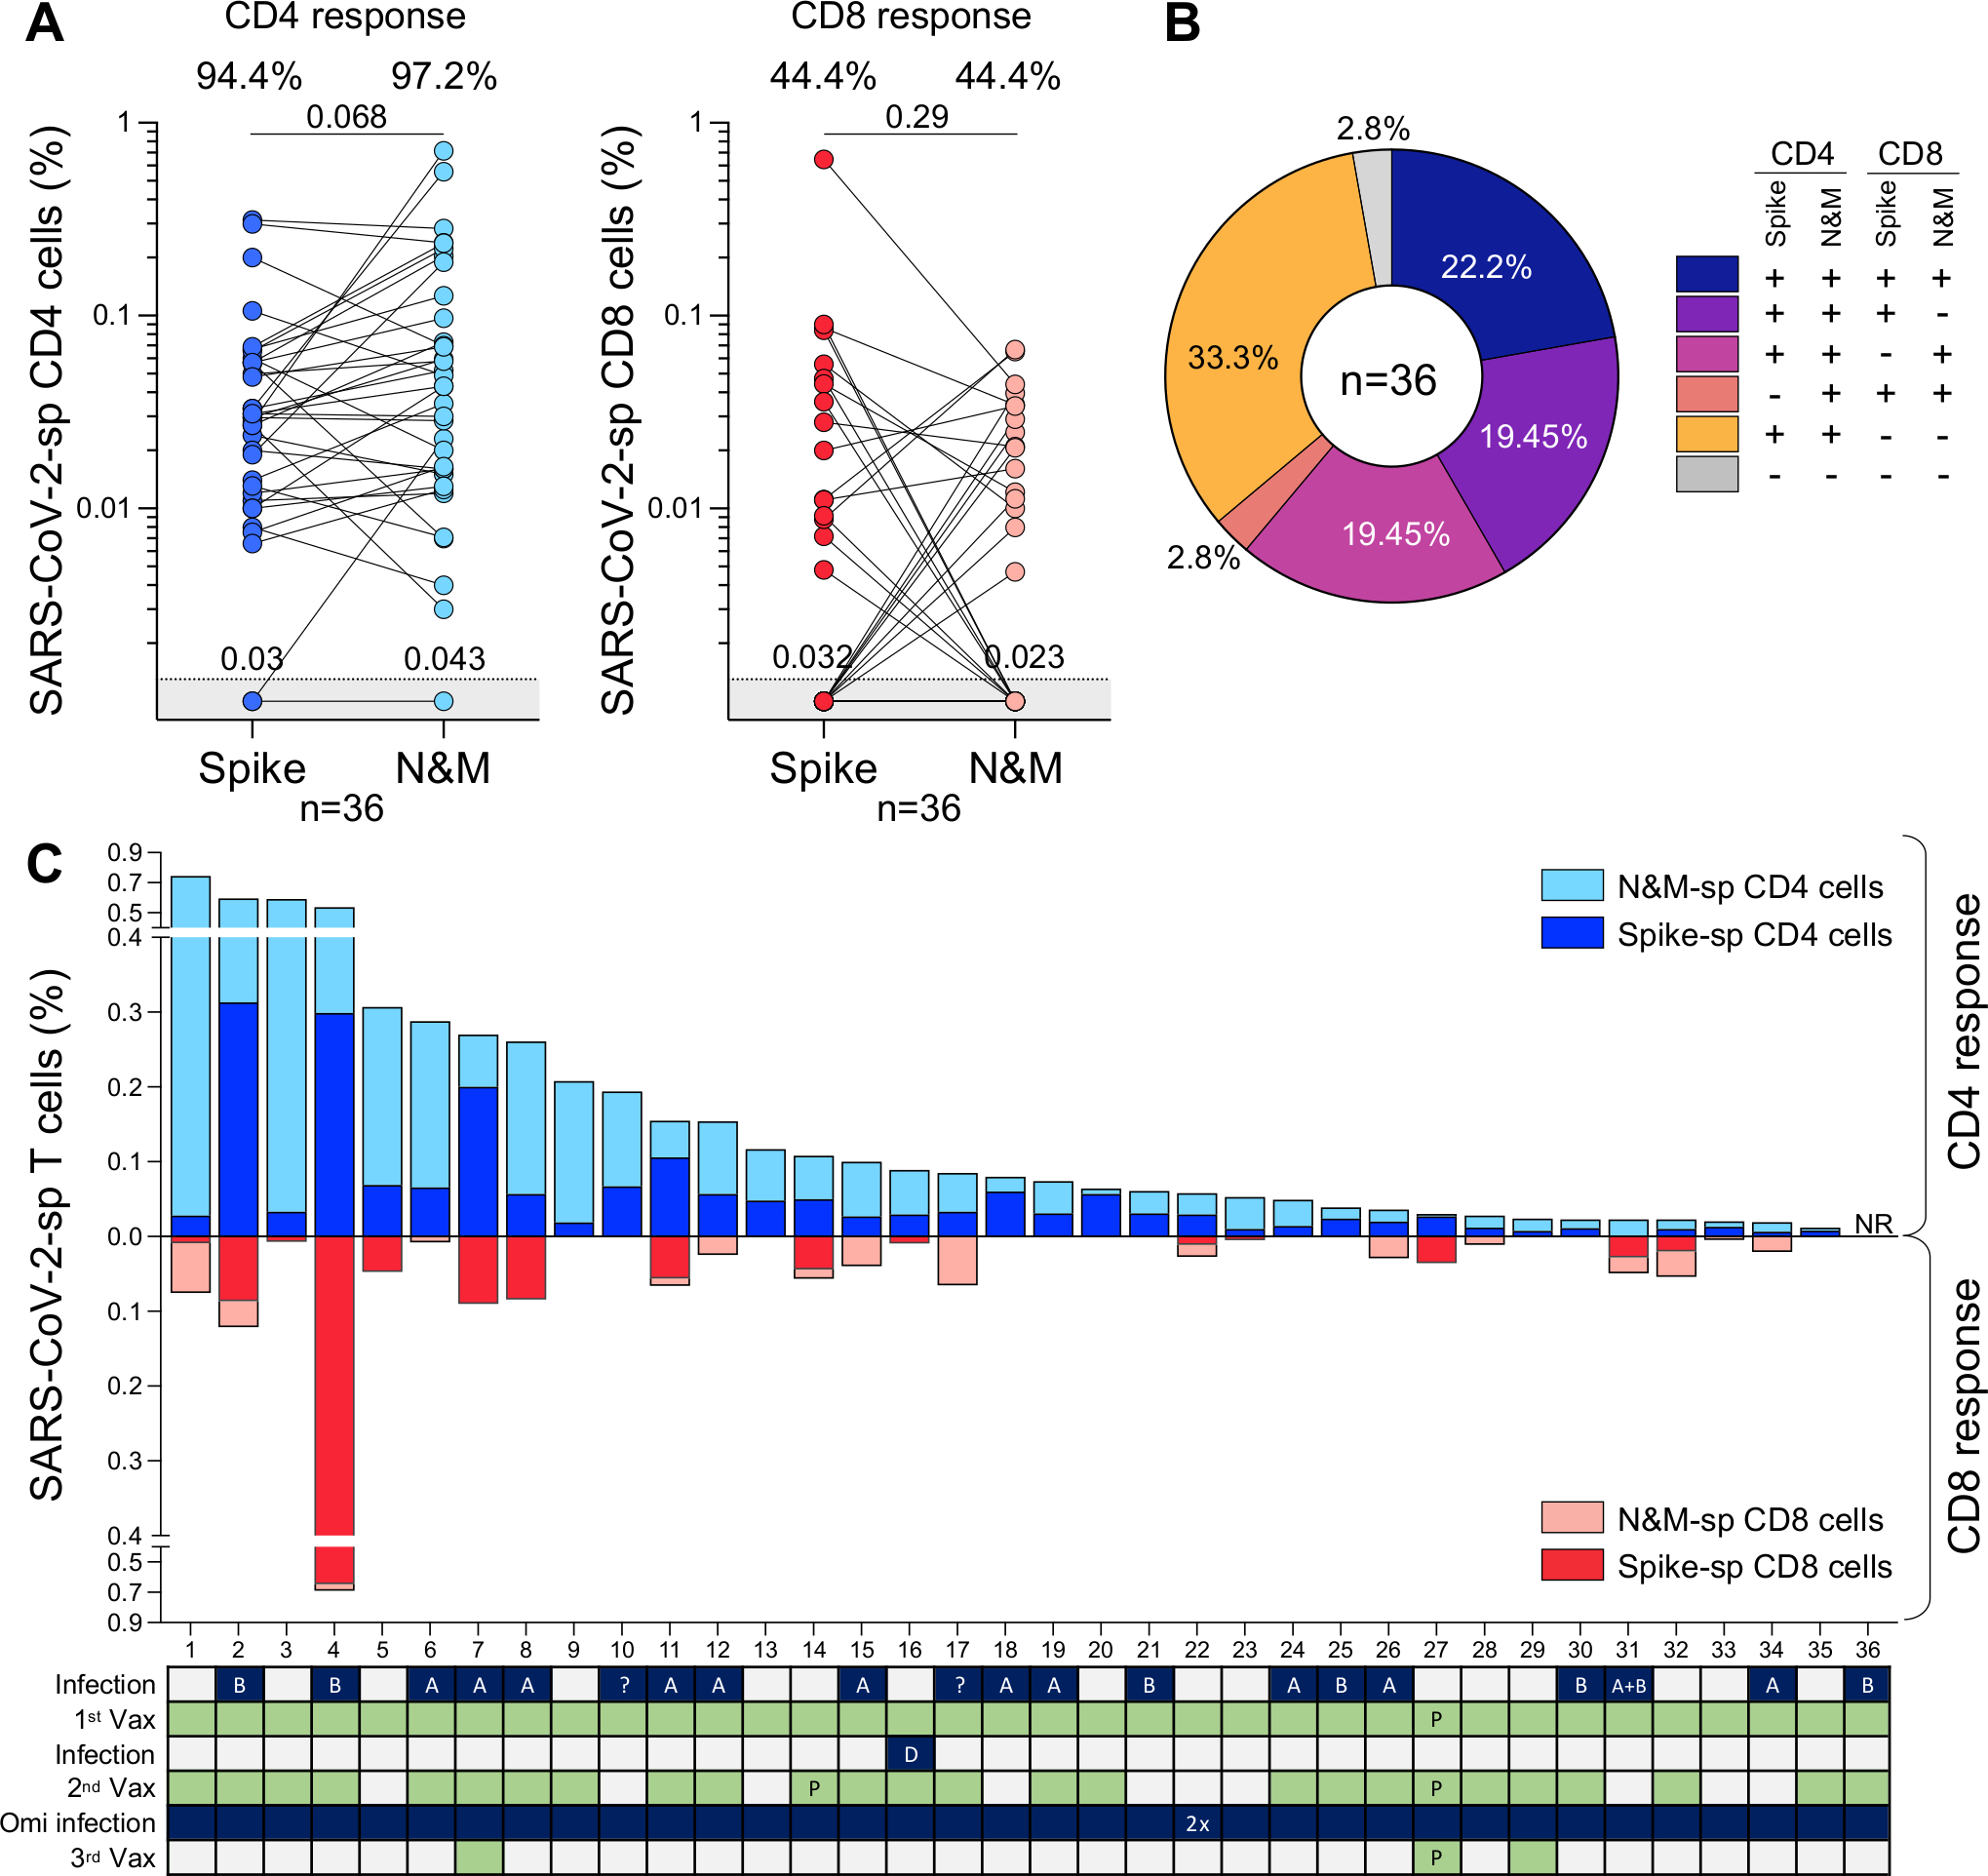
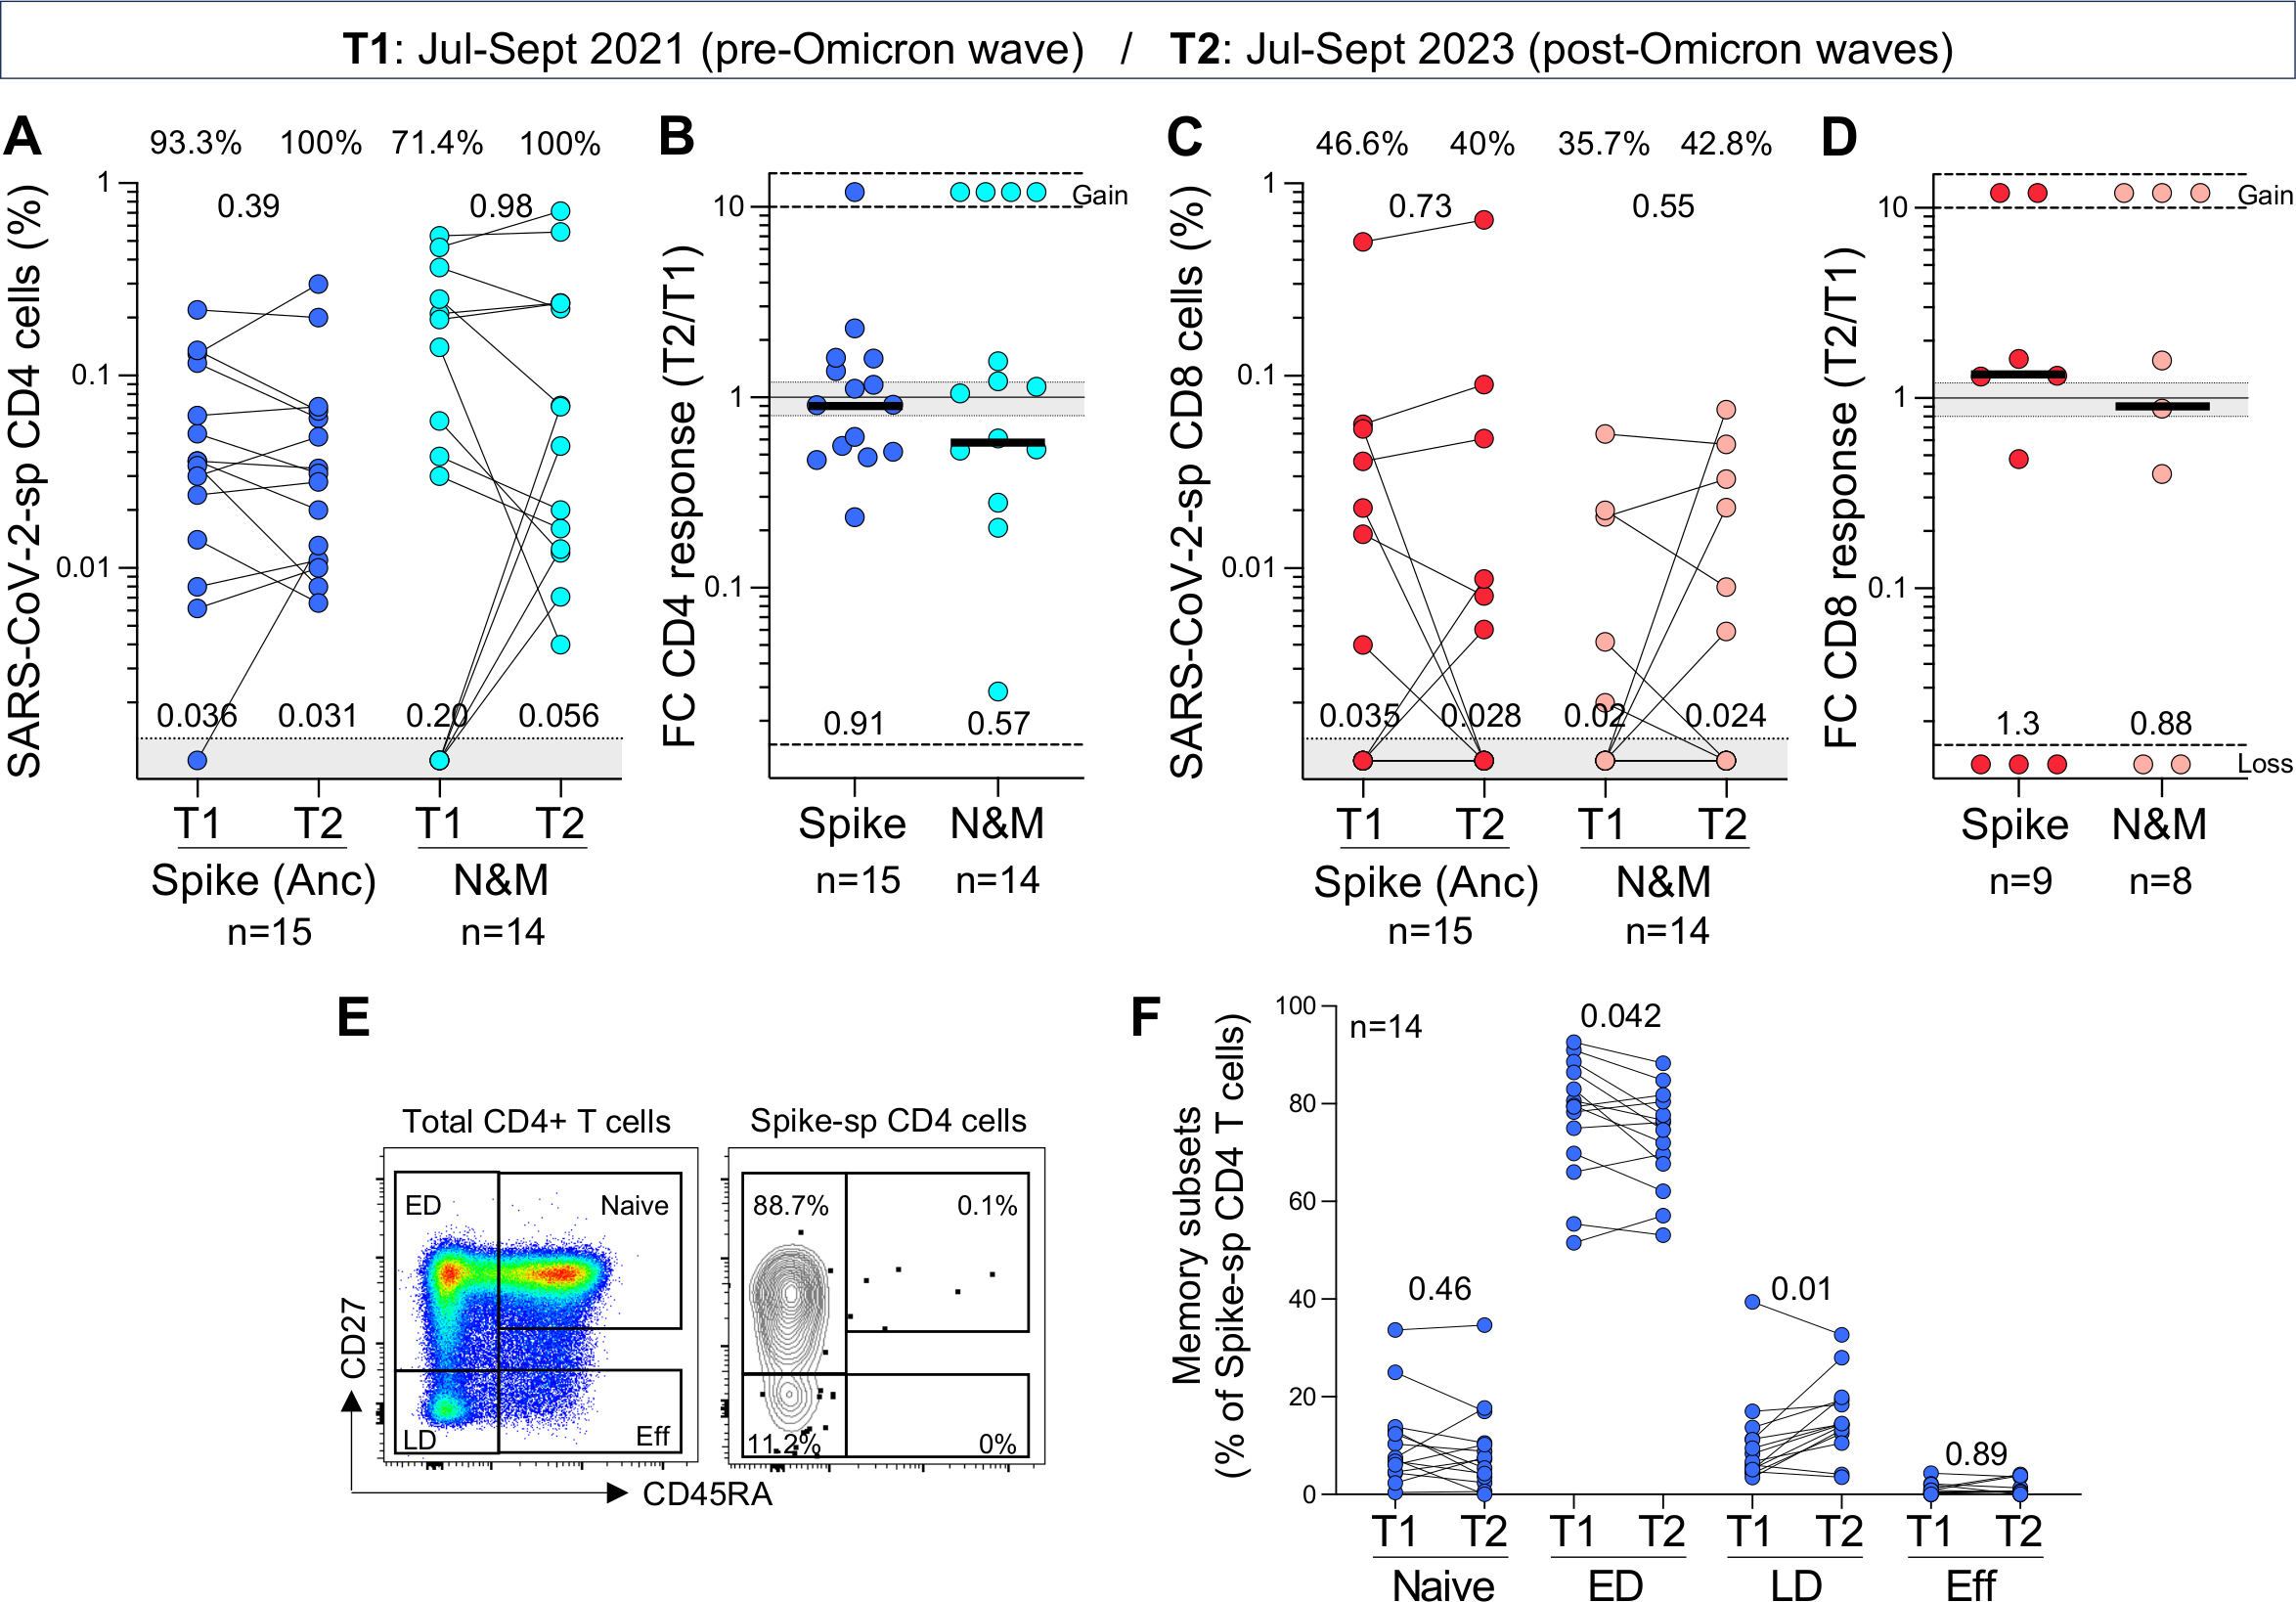
Ongoing severe acute respiratory syndrome coronavirus 2 (SARS-CoV-2) evolution has given rise to recombinant Omicron lineages that dominate globally (XBB.1), as well as the emergence of hypermutated variants (BA.2.86). In this context, durable and cross-reactive T cell immune memory is critical for continued protection against severe COVID-19. We examined T cell responses to SARS-CoV-2 approximately 1.5 years since Omicron first emerged. We describe sustained CD4+ and CD8+ spike-specific T cell memory responses in healthcare workers in South Africa (n = 39) who were vaccinated and experienced at least one SARS-CoV-2 infection. Spike-specific T cells are highly cross-reactive with all Omicron variants tested, including BA.2.86. Abundant nucleocapsid and membrane-specific T cells are detectable in most participants. The bulk of SARS-CoV-2-specific T cell responses have an early-differentiated phenotype, explaining their persistent nature. Overall, hybrid immunity leads to the accumulation of spike and non-spike T cells evident 3.5 years after the start of the pandemic, with preserved recognition of highly mutated SARS-CoV-2 variants.

Keywords: BA.2.86 sub-lineage; SARS-CoV-2; T cell response; T cell sustainability; cross-reactivity.


Conflict of interest statement

Declaration of interests A.S. is a consultant for AstraZeneca Pharmaceuticals, Calyptus Pharmaceuticals Inc, Darwin Health, EmerVax, EUROIMMUN, F. Hoffman-La Roche Ltd, Fortress Biotech, Gilead Sciences, Granite bio., Gritstone Oncology, Guggenheim Securities, Moderna, Pfizer, RiverVest Venture Partners, and Turnstone Biologics. A.G. is a consultant for Pfizer. L.J.I. has filed for patent protection for various aspects of T cell epitope and vaccine design work.

Figures

Figure 1.
Figure 1.. CD4+ and CD8+ T-cell responses to SARS-CoV-2 ancestral, BA.1, XBB.1 or BA.2.86 spike.
(A) Representative examples of IFN-γ production in response to ancestral, BA.1, XBB.1 or BA.2.86 spike in two individuals. The frequency of IFN-γ+ cells is expressed as a percentage of total CD4+ (blue) or CD8+ T cells (red). (B and D) Frequency of spike-specific CD4+ T cells (B) and CD8+ T cells (D) producing any cytokine (IFN-γ, IL-2 or TNF-α) in 39 participants with confirmed Omicron infection. The proportion of responders is indicated at the top and median frequencies of spike-specific T cells in responders are indicated at the bottom of the graph. (C and E) Fold change in frequency of spike-specific CD4+ T cells (C) and CD8+ T cells (E) between ancestral and SARS-CoV-2 variants in participants with confirmed Omicron infection. Medians are indicated. Gained responses are depicted on top and lost responses at the bottom. No significant differences were observed between variants using Friedman test with Dunn’s multiple comparisons post-test.
Figure 2.
Figure 2.. Profile of ancestral SARS-CoV-2 spike- and nucleocapsid and membrane-specific T-cell response ~3.5 years after the start of the COVID-19 pandemic.
(A) Frequency of spike- and nucleocapsid and membrane (N&M)-specific CD4+ (left) and CD8+ T cells (right) in 36 participants sampled between July and September 2023. Proportion of responders is indicated on top and median responses at the bottom of the graph. Statistical comparisons were assessed using Wilcoxon matched-pairs signed rank test. (B) Distribution of spike- and N&M-specific CD4+ and CD8+ T-cell responses. Each slice of pie represents a response pattern, as indicated. (C) Total magnitude of spike- and N&M-specific CD4+ and CD8+ T-cell responses. The SARS-CoV-2 infection and vaccination histories of each participant are indicated. A: ancestral SARS-CoV-2 infection, B: Beta variant, D: Delta variant, ?: unknown variant infection. All vaccinations were Ad26.COV2.S, unless indicated with “P” for Pfizer/BNT162b2.
Figure 3.
Figure 3.. Longitudinal assessment of the maintenance and memory profile of ancestral SARS-CoV-2-specific T-cell responses over 2 years.
(A and C) Frequency of ancestral spike- and nucleocapsid and membrane (N&M)-specific CD4+ (A) and CD8+ T cells (C) in paired samples (n=15 for Spike and n=14 for N&M). T1 and T2 samples were collected between July and September 2021 and July and September 2023, respectively. Medians frequencies of spike- and N&M-specific T cells in responders are indicated at the bottom of the graphs. Statistical comparisons were assessed using Wilcoxon matched-pairs signed rank test. (B and D) Fold change in frequency of SARS-CoV-2-specific CD4+ (B) and CD8+ T cells (D) between T2 and T1 in responders. Bars represent medians, and median fold change is indicated at the bottom of each graph. Gained responses are depicted on top and lost responses at the bottom. (E) Representative plots of the memory differentiation profile of total CD4+ T cells and ancestral spike-specific CD4+ T cells. ED: early differentiated cells, LD: late differentiated cells and Eff: Effector cells. (F) Comparison of the memory profile of spike-specific CD4+ T cells (n=14) at T1 and T2. Statistical comparisons were assessed using Wilcoxon matched-pairs signed rank test.

Similar articles

Cited by

References

    1. Roemer C, Sheward DJ, Hisner R, Gueli F, Sakaguchi H, Frohberg N, Schoenmakers J, Sato K, O’Toole A, Rambaut A, et al. (2023). SARS-CoV-2 evolution in the Omicron era. Nat Microbiol. 10.1038/s41564-023-01504-w. - DOI - PubMed
    1. Khan K, Lustig G, Reedoy K, Jule Z, Römer C, Karim F, Ganga Y, Bernstein M, Baig Z, Mahlangu B, et al. (2023). Evolution and neutralization escape of the SARS-CoV-2 BA.2.86 subvariant. Preprint in MedRxiv. 10.1101/2023.09.08.23295250. - DOI - PMC - PubMed
    1. Sheward DJ, Yang Y, Westerberg M, Oling S, Muschiol S, Sato K, Peacock TP, Hedestam GBK, Albert J, and Murrell B (2023). Sensitivity of the SARS-CoV-2 BA.2.86 variant to prevailing neutralising antibody responses. Lancet Infect Dis. 10.1016/S1473-3099(23)00588-1. - DOI - PubMed
    1. Yang S, Yu Y, Jian F, Song W, Yisimayi A, Chen X, Xu Y, Wang P, Wang J, Yu L, et al. (2023). Antigenicity and infectivity characterisation of SARS-CoV-2 BA.2.86. Lancet Infect Dis. 10.1016/S1473-3099(23)00573-X. - DOI - PubMed
    1. Lasrado N, Collier AY, Hachmann NP, Miller J, Rowe M, Schonberg ED, Rodrigues SL, LaPiana A, Patio RC, Anand T, et al. (2023). Neutralization escape by SARS-CoV-2 Omicron subvariant BA.2.86. Vaccine. 10.1016/j.vaccine.2023.10.051. - DOI - PMC - PubMed

Substances

Supplementary concepts