. 2024 Feb;300(2):105641.
doi: 10.1016/j.jbc.2024.105641. Epub 2024 Jan 9.

Disruption of lysosomal nutrient sensing scaffold contributes to pathogenesis of a fatal neurodegenerative lysosomal storage disease

Affiliations

Disruption of lysosomal nutrient sensing scaffold contributes to pathogenesis of a fatal neurodegenerative lysosomal storage disease

Maria B Bagh et al. J Biol Chem. 2024 Feb.

Abstract

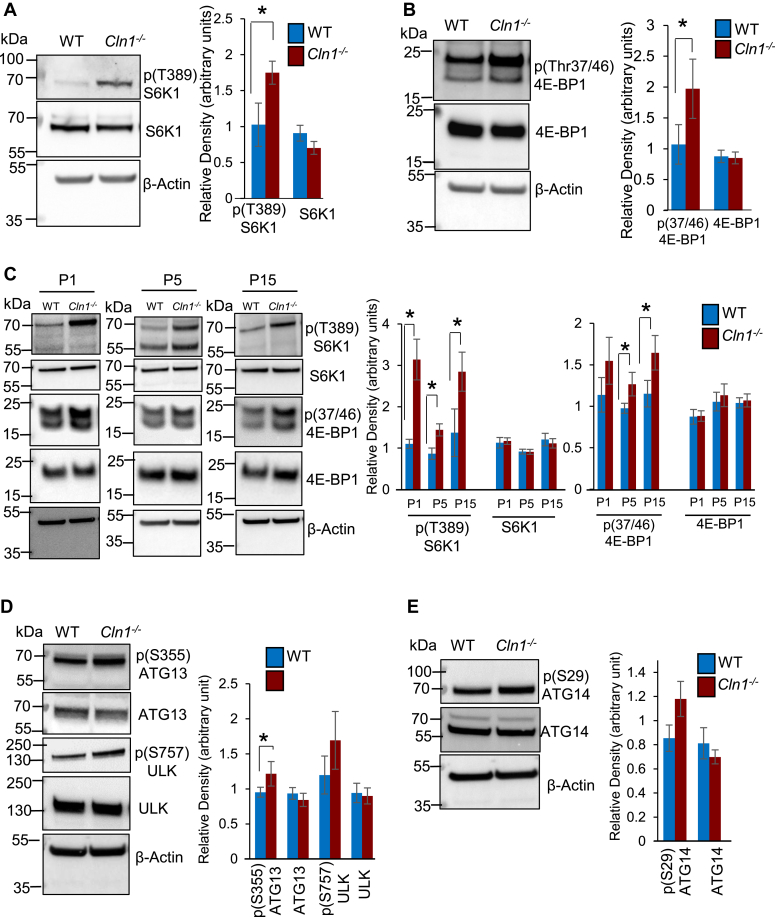
The ceroid lipofuscinosis neuronal 1 (CLN1) disease, formerly called infantile neuronal ceroid lipofuscinosis, is a fatal hereditary neurodegenerative lysosomal storage disorder. This disease is caused by loss-of-function mutations in the CLN1 gene, encoding palmitoyl-protein thioesterase-1 (PPT1). PPT1 catalyzes depalmitoylation of S-palmitoylated proteins for degradation and clearance by lysosomal hydrolases. Numerous proteins, especially in the brain, require dynamic S-palmitoylation (palmitoylation-depalmitoylation cycles) for endosomal trafficking to their destination. While 23 palmitoyl-acyl transferases in the mammalian genome catalyze S-palmitoylation, depalmitoylation is catalyzed by thioesterases such as PPT1. Despite these discoveries, the pathogenic mechanism of CLN1 disease has remained elusive. Here, we report that in the brain of Cln1-/- mice, which mimic CLN1 disease, the mechanistic target of rapamycin complex-1 (mTORC1) kinase is hyperactivated. The activation of mTORC1 by nutrients requires its anchorage to lysosomal limiting membrane by Rag GTPases and Ragulator complex. These proteins form the lysosomal nutrient sensing scaffold to which mTORC1 must attach to activate. We found that in Cln1-/- mice, two constituent proteins of the Ragulator complex (vacuolar (H+)-ATPase and Lamtor1) require dynamic S-palmitoylation for endosomal trafficking to the lysosomal limiting membrane. Intriguingly, Ppt1 deficiency in Cln1-/- mice misrouted these proteins to the plasma membrane disrupting the lysosomal nutrient sensing scaffold. Despite this defect, mTORC1 was hyperactivated via the IGF1/PI3K/Akt-signaling pathway, which suppressed autophagy contributing to neuropathology. Importantly, pharmacological inhibition of PI3K/Akt suppressed mTORC1 activation, restored autophagy, and ameliorated neurodegeneration in Cln1-/- mice. Our findings reveal a previously unrecognized role of Cln1/Ppt1 in regulating mTORC1 activation and suggest that IGF1/PI3K/Akt may be a targetable pathway for CLN1 disease.

Keywords: CLN1 disease; IGF1 signaling; S-palmitoylation; lysosomal storage disease; mTORC1 activation; neurodegeneration.


Conflict of interest statement

Conflict of interest The authors declare that they have no conflicts of interest with the contents of this article.

Figures

Figure 1
Figure 1
Aberrant mTORC1 activation and autophagy in WT and Cln1−/−mouse brain.A, Western blot analyses and densitometric quantitation of phosphorylated-S6K1 (pS6K1) and B) phosphorylated- 4E-BP1 (p4E-BP1), the two canonical substrates of mTORC1, in the cortical homogenate from WT and Cln1−/−mice (n = 4). C, Western blots and densitometric analyses of pS6K1 and p4E-BP1 in the cortical lysates from postnatal WT and Cln1−/− mice (n = 4). Also see Figs. S1A and S2C. D, levels of phospho- and nonphospho-ATG13 and ULK in the brain of WT and Cln1−/− mice (n = 4). E, levels of phospho- and nonphospho-ATG14 in cortical tissue-lysates from WT and Cln1−/− mice (n = 4). Also see Fig. S1, D and E.Two-sample permutation t test with complete enumeration was used to calculate the p-values. Data presented as the mean ± SD and the p values (∗p < 0.05) represent WT versus Cln1−/− mice. CLN, ceroid lipofuscinosis neuronal; mTORC, mechanistic/mammalian target of rapamycin complex; pS6K1, phosphorylated 70/S6 kinase-1; p4E-BP1, eukaryotic translation initiation factor 4E-binding protein-1.
Figure 2
Figure 2
Levels of Rag/Ragulator complex proteins in lysosomes from WT and Cln1−/−mouse brain.A, schematic explaining how the RagGTPase/Ragulator complex facilitates mTORC1 activation. The Rag/Ragulator complex senses the presence of lysosomal amino acids and activates the Rag-GTPase tethered to lysosomal membrane by Ragulator, followed by docking of mTORC1 on lysosomal surface for activation. B, Western blot analysis and densitometric quantitation showing the total level of RAG-GTPase (RagA and RagC) in the cortical section of WT and Cln1−/− mice (n = 4). C, Western blot analysis of total level of RagC and RagD in the cortical section of WT and Cln1−/− mice (n = 4). D, levels of Rag GTPase (i.e., RagA, RagB, RagC, and RagD) in purified lysosomal fractions from the cortical homogenate of WT and Cln1−/− mice (n = 4). Also see Fig. S2A. E, Western blot analysis of Ragulator complex (Lamtor1, Lamtor2, Lamtor3, Lamtor4, and Lamtor5) in the cortical homogenate of WT and Cln1−/− mice (n = 4). F, the levels of Ragulator complex proteins (Lamtor1–Lamtor5) in lysosomal fractions from cortical tissues of WT and Cln1−/− mice (n = 4). Also see Fig. S2B. G, Western blot analysis of SLC38A9 in the cortical homogenates of WT and Cln1−/− mice (n = 4). H, Western blot analysis of lysosomal level of SLC38A9 in the cortical homogenates of WT and Cln1−/−mice (n = 4). Two-sample permutation t test with complete enumeration was used to calculate the p values. Data presented as the mean ± SD and p values (∗p < 0.05) represent WT versus Cln1−/− mice, respectively. CLN, ceroid lipofuscinosis neuronal;mTORC, mechanistic/mammalian target of rapamycin complex.
Figure 3
Figure 3
Lamtor 1 requires dynamic S-palmitoylation for lysosomal localization and is misrouted in Cln1−/−mice.A, potential S-palmitoylation sites in Lamtor 1 as predicted by CSS-palm-4 analysis. B, amino acid sequence similarity among various species across phyla showing Cys3 and Cys4 in Lamtor 1 are evolutionarily conserved. C, acyl-RAC assay and Western blot analysis, respectively, of total lysates of HEK-293T cells transfected with Myc-Lamtor1, Myc-Lamtor1-mutant (Cys 3 Ala), and Myc-Lamtor1-mutant (Cys 4 Ala) constructs to confirm that Cys 3 and Cys 4 in Lamtor 1 are the residues that undergo S-palmitoylation. D, acyl-RAC assay and Western blot analysis to detect the endogenous level of S-palmitoylated Lamtor1in the brain cortical homogenate from WT and Cln1−/− mice (n = 4). E, confocal imaging showing colocalization of Lamtor1 with lysosomal marker, Lamp2, in Cln1−/− mouse neurons (n = 22) and WT mouse neurons (n = 18). Data were pooled from four independent experiments. F, Western blot analysis and densitometric quantitation showing the level of Lamtor1 in plasma membrane fractions from the cortical homogenate of WT and Cln1−/− mice (n = 4). Two-sample permutation t test with complete enumeration was used to calculate the p values. Data presented as the mean ± SD and p values (∗p < 0.05 and ∗∗p < 0.01) represent WT versus Cln1−/− mice, respectively. CLN, ceroid lipofuscinosis neuronal.
Figure 4
Figure 4
Growth factor–mediated pathway of mTORC1 activation in Cln1−/−mouse brain.A, schematic representation of AKT/TSC pathway activating mTORC1 signaling. AKT inhibits the TSC complex by phosphorylation of TSC2. This promotes the activation of Rheb GTPase by conversion of Rheb-GDP to Rheb-GTP essential for mTORC1 activation on lysosomal membrane. B, determination of the phosphorylation status of TSC2 in total cortical lysates from WT and Cln1−/− mice (n = 4). Also see Fig. S4A. C, immunoprecipitation and Western blot analysis showing the level of GTP-Rheb in the cortical homogenate of WT and Cln1−/− mice (n = 4). D, Western blot analysis of total cortical lysates from WT and Cln1−/− mice to determine the level of phosphorylated PRAS-40 (n = 4). E, Western blot analysis of cortical homogenate showing the levels of phosphorylated AKT in WT and Cln1−/− mice (n = 4). Also see Fig. S4, B and C. F, level of IGF1 by ELISA in cortical lysates from WT and Cln1−/− mice (n = 4). Also see Fig. S4, DF. G, Western blot analysis of cortical homogenate from WT and Cln1−/− mice (n = 4) showing the phosphorylation status of P13K kinase. Also see Fig. S4G. Two-sample permutation test with complete enumeration was used to calculate the p values. Data presented as the mean ± SD. The p values (∗p < 0.05 and ∗∗p < 0.01) represent WT versus Cln1−/− mice, respectively. CLN, ceroid lipofuscinosis neuronal; IGF1, insulin-like growth factor-1; mTORC, mechanistic/mammalian target of rapamycin complex; PRAS40, proline-rich Akt-substrate-40; Rheb, Ras homolog enriched in brain; TSC, tuberous sclerosis complex.
Figure 5
Figure 5
AKT inhibitors suppress mTORC1 activation in CLN1 patient lymphoblasts and Cln1−/−mice.A, detection and quantitation of pS6K1, p4E-BP1, and pGSK3β in lymphoblasts from normal individuals (NL) (1) and patient with CLN1 disease lymphoblast without (2) or treated with AKT inhibitors, Afuresertib [10 μM (3) and 30 μM (4)] and Uprosertib [10 μM (5) and 30 μM (6)] (n = 3). B, the levels of pS6K1, p4E-BP1, and pGSK3β in the brain cortical homogenate of untreated or AKT inhibitor, Afuresertib (Afu)-treated WT and Cln1−/− mice (n = 5). AKT inhibitors, Afuresertib (Afu 50 mg/kg body weight and Uprosertib (Upr 50 mg/kg body weight) for 2 weeks. C, the levels of S6K1, p4E-BP1, and pGSK3β in untreated or Afuresertib (Afu)-treated (50 mg/kg body weight for 5 months) WT and Cln1−/− mice (n = 4). Two-sample permutation t test with complete enumeration was used to calculate the p values (∗p < 0.05 and ∗∗p < 0.01). Data presented as the mean ± SD. CLN, ceroid lipofuscinosis neuronal; mTORC1, mechanistic target of rapamycin complex-1; pS6K1, phosphorylated 70/S6 kinase-1; p4E-BP1, eukaryotic translation initiation factor 4E-binding protein-1.
Figure 6
Figure 6
Treatment with AKT inhibitor suppresses glial cell levels in Cln1−/−mice.A, level of astrocyte marker, GFAP, in WT, untreated (Un), and Afuresertib (Afu) (50 mg/kg body weight for 5 months) Cln1−/− mice (n = 4). B, detection of microglia marker, CD68, in WT, untreated (Un)- or Afuresertib (Afu) (50 mg/kg body weight)-treated Cln1−/− mice (n = 4). Mice were treated for 5 months. C, Western blot analysis of microglia marker, IBA1, in WT, untreated (Un)- or Afuresertib (Afu)- treated (for 5 months) Cln1−/− mice (n = 4). Also see Fig. S6E. D, fluorescence imaging of GFAP in WT, untreated (Un)- and Afuresertib (Afu)-treated (for 5 months) Cln1−/− mouse cortical sections of untreated (Un) or treated with Afuresertib (Afu) for 5 months, (n = 12). The scale bar represents 50 μm. E, fluorescence imaging of CD68 in WT & Cln1−/− mouse brain cortical sections of untreated (Un) or treated with Afuresertib (Afu) for 5 months, (n = 12). The scale bar represents 50 μm. Two-sample permutation t test with complete enumeration was used to calculate the p values (∗p < 0.05 and ∗∗∗p < 0.001). Data are presented as the mean ± SD. CLN, ceroid lipofuscinosis neuronal.
Figure 7
Figure 7
Suppression of brain atrophy and improved motor function in Cln1−/−mice treated with AKT inhibitor.A, representative images of Nissl-stained neurons in the cerebral cortex of WT and Cln1−/− mice (n = 4). Mice were either untreated (Un) or treated with Afuresertib (Afu) for 5 months. Two-sample permutation t test with complete enumeration was used to calculate the p values (∗p < 0.05). Data are presented as the mean ± SD. B, detection of NeuN-positive cells in the cortical section of WT and Cln1−/− mouse (n = 4), which were either untreated (Un) or treated with Afuresertib (Afu) (50 mg/kg body weight for 5 months). Two-sample permutation t test with complete enumeration was used to calculate the p-values (∗p < 0.05). Data are presented as the mean ± SD. Also see Fig. S7. C, Rotarod test of untreated (Un) or Afuresertib (Afu)-treated WT and Cln1−/− mice (n = 7) for 5 months, and 7 months (n = 7 in each group). Two-sample permutation t test with complete enumeration was used to calculate the p values (∗∗p < 0.01). Data presented are the mean ± SD. D, schematic showing mTORC1 activation in WT (left panel) and Cln1−/− (right panel) mouse brain. mTORC1 integrates signals from growth factors, nutrition, energy, and stress-regulating cell growth and proliferation through phosphorylation of substrates that activate various anabolic processes like protein, lipid, and nucleotide synthesis and inhibit catabolic processes like autophagy. The lysosomal nutrition sensing scaffold (LNSS) (consisting of V-ATPase and Rag–Ragulator complex), plays critical roles in amino acid sensing and mTORC1 activation. The growth factor pathway consisting of the PI3K and AKT also regulates mTORC1 activation through the TSC complex (TSC1, TSC2, TBCD17) and RheB. Upon activation, AKT phosphorylates TSC2 and inhibits it promoting the conversion of Rheb-GDP (inactive) to Rheb-GTP (active), which can then activate mTORC1 on the lysosomal surface. Despite misvocalization of the components of the LNSS complex in Cln1−/− cells the mTORC1 is activated via the growth factor–mediated pathway. Constitutive activation of mTORC1 in Cln1−/− cells contributes to the suppression of autophagy and increased cell proliferation contributing to neurodegeneration in CLN1 disease. CLN, ceroid lipofuscinosis neuronal; AKT, protein kinase B; TSC, tuberous sclerosis complex; IGFR, insulin-like growth factor receptor; IGF1, insulin-like growth factor-1; mTORC1, mechanistic target of rapamycin complex-1; Rheb, Ras homolog enriched in brain.

References

    1. Laplante M., Sabatini D.M. mTOR signaling in growth control and disease. Cell. 2012;149:274–293. - PMC - PubMed
    1. Platt F.M. Emptying the stores: lysosomal diseases and therapeutic strategies. Nat. Rev. Drug Discov. 2018;17:133–150. - PubMed
    1. Fraldi A., Klein A.D., Medina D.L., Settembre C. Brain disorders due to lysosomal dysfunction. Annu. Rev. Neurosci. 2016;39:277–295. - PubMed
    1. Seranova E., Connolly K.J., Zatyka M., Rosenstock T.R., Barrett T., Tuxworth R.I., et al. Dysregulation of autophagy as a common mechanism in lysosomal storage diseases. Essays Biochem. 2017;61:733–749. - PMC - PubMed
    1. de Duve C. The lysosome turns fifty. Nat. Cell Biol. 2005;7:847–849. - PubMed

Publication types

MeSH terms

Substances

Supplementary concepts