. 2024 Feb 8;63(2):2301326.
doi: 10.1183/13993003.01326-2023. Print 2024 Feb.

Sfrp1 inhibits lung fibroblast invasion during transition to injury-induced myofibroblasts

Affiliations

Sfrp1 inhibits lung fibroblast invasion during transition to injury-induced myofibroblasts

Christoph H Mayr et al. Eur Respir J. .

Abstract

Background: Fibroblast-to-myofibroblast conversion is a major driver of tissue remodelling in organ fibrosis. Distinct lineages of fibroblasts support homeostatic tissue niche functions, yet their specific activation states and phenotypic trajectories during injury and repair have remained unclear.

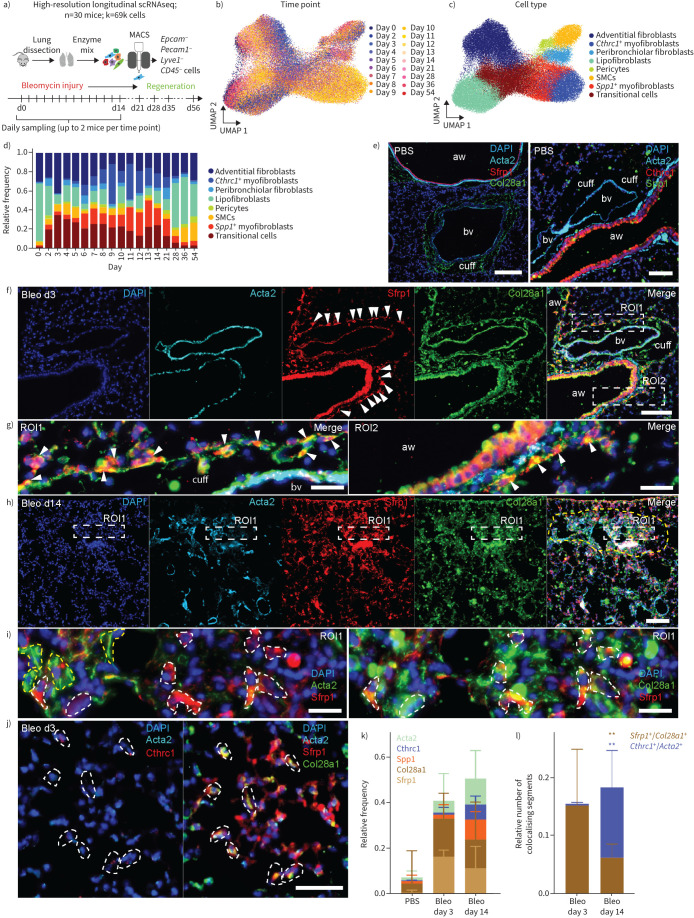
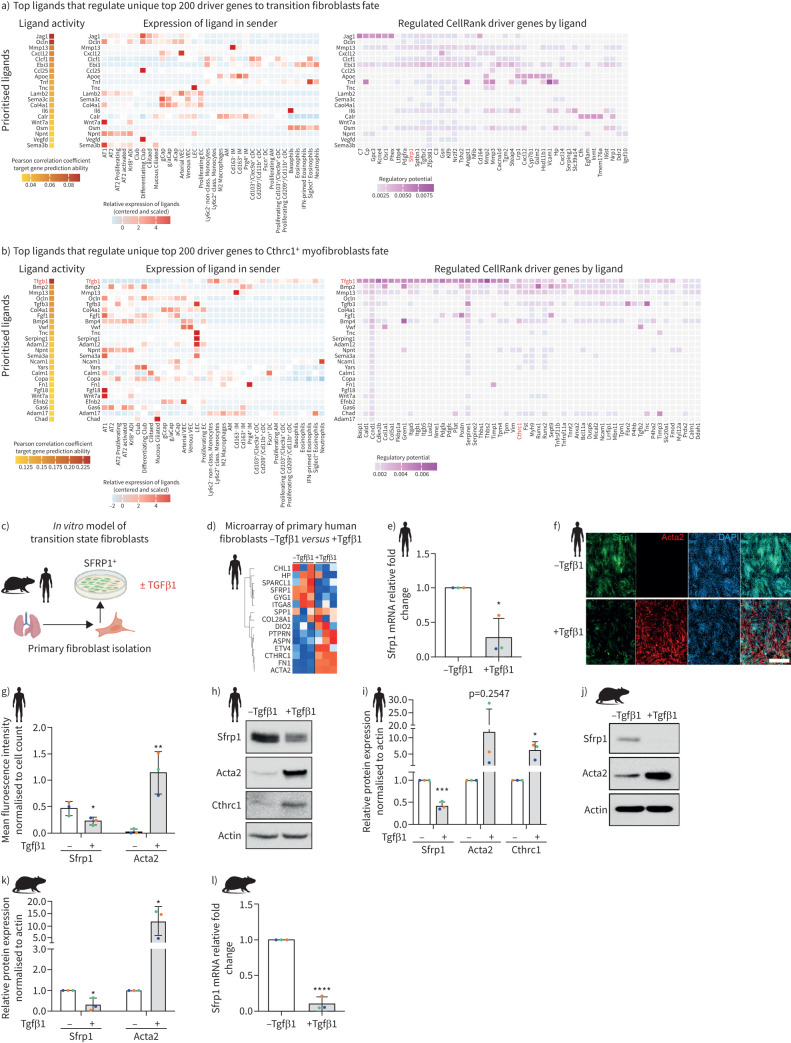
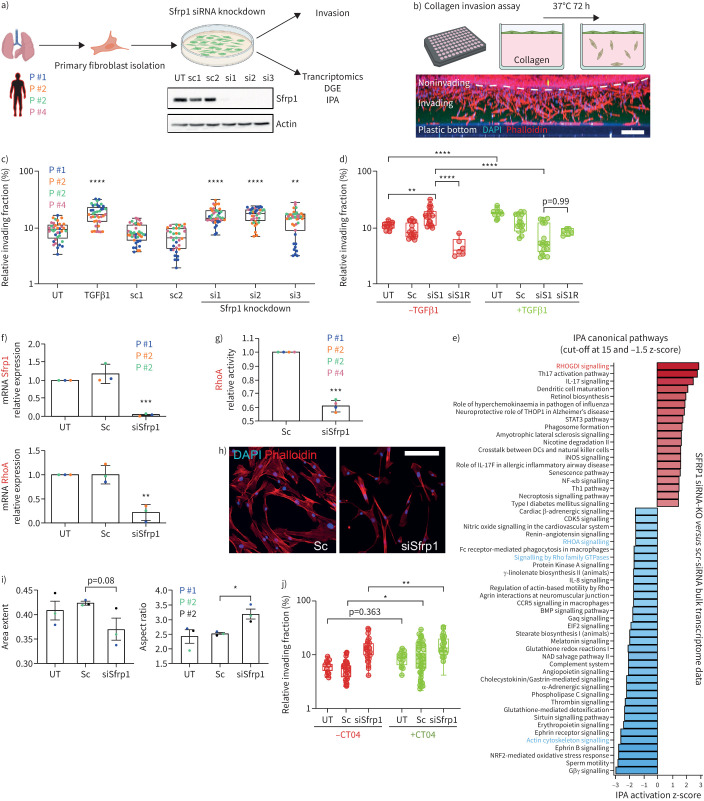
Methods: We combined spatial transcriptomics, multiplexed immunostainings, longitudinal single-cell RNA-sequencing and genetic lineage tracing to study fibroblast fates during mouse lung regeneration. Our findings were validated in idiopathic pulmonary fibrosis patient tissues in situ as well as in cell differentiation and invasion assays using patient lung fibroblasts. Cell differentiation and invasion assays established a function of SFRP1 in regulating human lung fibroblast invasion in response to transforming growth factor (TGF)β1.

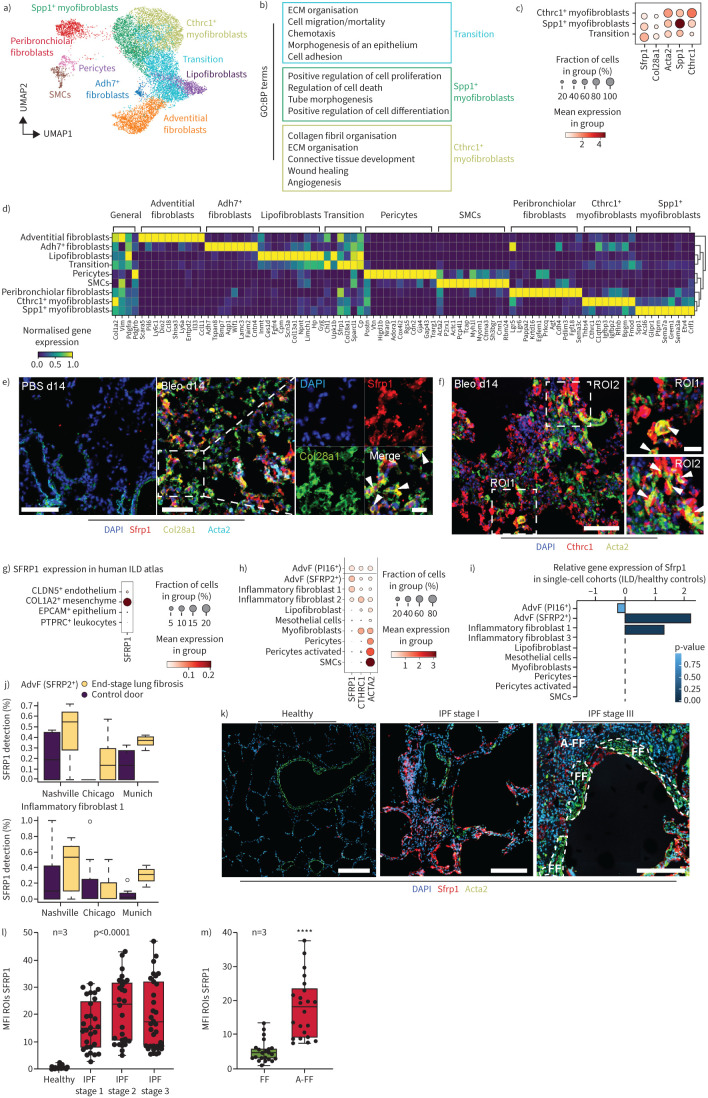
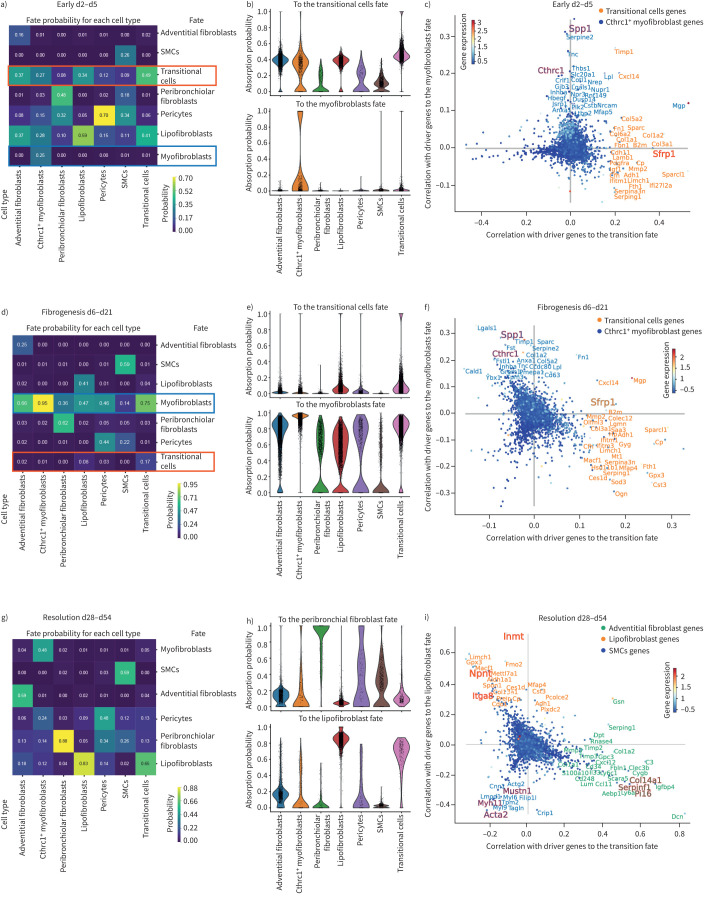
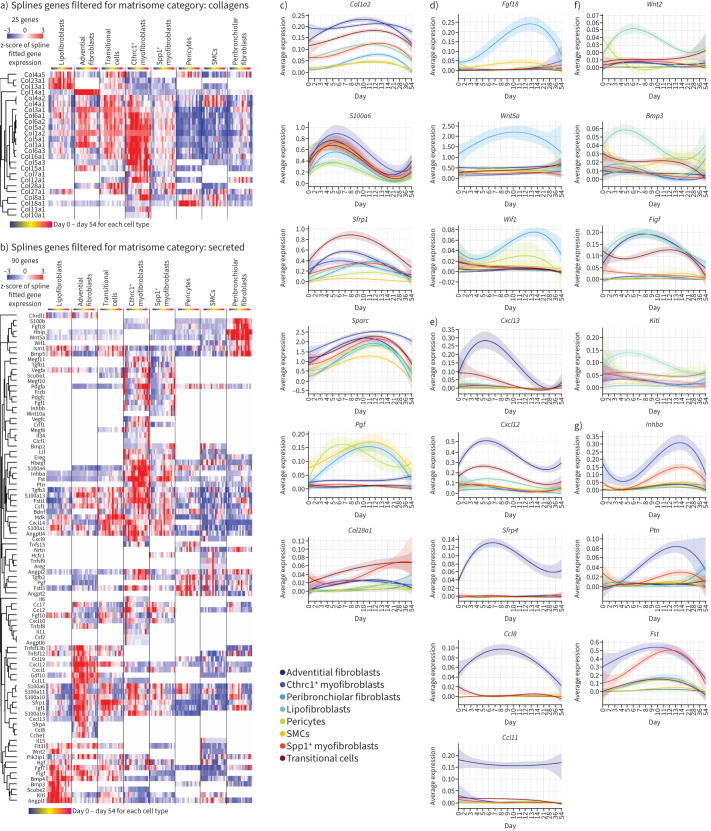
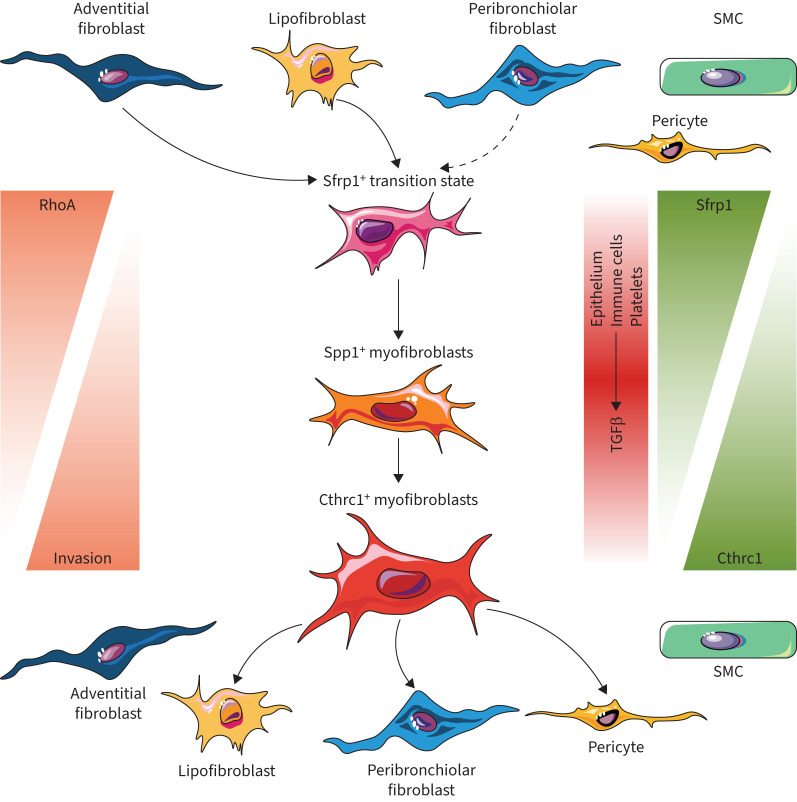
Measurements and main results: We discovered a transitional fibroblast state characterised by high Sfrp1 expression, derived from both Tcf21-Cre lineage positive and negative cells. Sfrp1 + cells appeared early after injury in peribronchiolar, adventitial and alveolar locations and preceded the emergence of myofibroblasts. We identified lineage-specific paracrine signals and inferred converging transcriptional trajectories towards Sfrp1 + transitional fibroblasts and Cthrc1 + myofibroblasts. TGFβ1 downregulated SFRP1 in noninvasive transitional cells and induced their switch to an invasive CTHRC1+ myofibroblast identity. Finally, using loss-of-function studies we showed that SFRP1 modulates TGFβ1-induced fibroblast invasion and RHOA pathway activity.

Conclusions: Our study reveals the convergence of spatially and transcriptionally distinct fibroblast lineages into transcriptionally uniform myofibroblasts and identifies SFRP1 as a modulator of TGFβ1-driven fibroblast phenotypes in fibrogenesis. These findings are relevant in the context of therapeutic interventions that aim at limiting or reversing fibroblast foci formation.


Conflict of interest statement

Conflict of interest: M. Gerckens reports grants from Stiftung Atemweg e.V. and a patent pending EP21178481 “Novel anti-fibrotic drugs”, outside the submitted work. M. Tallquist reports support for the present manuscript from NIH (5R21HL156112). J. Beckers reports funding for the current manuscript, as well as funding for consumables outside the submitted work, from Helmholtz Zentrum München GmbH. O. Eickelberg reports support for the present manuscript from R01 HL146519; in addition, O. Eickelberg reports consulting fees from Blade Therapeutics, Yap Therapeutics and Pieris Pharmaceuticals, stock or stock options from Blade Therapeutics, outside the submitted work. J. Behr reports a leadership role as Chair of Guideline Committee of the German Respiratory Society (DGP), outside the submitted work. W.A. Wuyts reports grants, consulting fees, lecture honoraria and advisory board participation from Roche, Pliant, Boehringer Ingelheim, Alentis and Galapagos. K. Ahlbrecht reports support for the present manuscript from Max Planck Society, German Center for Lung Research (Deutsches Zentrum für Lungenforschung; DZL), Federal Ministry of Higher Education, Research and the Arts of the State of Hessen LOEWE, Programme through grant UGMLC; in addition, K. Ahlbrecht reports grants from Rhon Klinikum AG (grant FI_71), outside the submitted work. R.E. Morty reports leadership roles as Editor-in-Chief, American Journal of Physiology – Lung Cellular and Molecular Physiology and Group Chair, Group 07.08 Lung and Airway Development, at the European Respiratory Society, outside the submitted work. C. Samakovlis reports grants from Swedish Research Council, Swedish Cancer Society, DFG, Stockholm University, Stockholm, Sweden, Justus-Liebig University, Giessen, Germany, DiscovAir, EU, payment for expert testimony from Swedish Cancer Society and Wallengberg Foundation, and a leadership role with Royal Academy of Science, Sweden, outside the submitted work. F.J. Theis reports support for the present manuscript from the Chan Zuckerburg Foundation (grant number 2019- 002438), as well as consulting fees from Roche, Immunai, Singularity, Omniscope and CytoReason, lecture honoraria from Genentech Research Organisation, AMGEN GmbH, Munich, Roche Germany, Roche, Basel, ETH Zurich, Vizgen, ThirdRockVentures and Pfizer, advisory board participation with Max Planck Institute for Intelligent Systems, Berlin Institute of Health and EMBL, and stock or stock options from Cellarity, outside the submitted work. H.B. Schiller reports support for the present manuscript from Helmholtz Association, Deutsches Zentrum für Lungenforschung (DZL) and CZI/H2020 (discovair). The remaining authors have no potential conflicts of interest to disclose.

Figures

FIGURE 1
FIGURE 1
Stromal cell heterogeneity in the adult lung is associated with distinct spatial locations. a) Uniform manifold approximation and projection (UMAP) clustering depicts the seven distinct mesenchymal cell types (12 068 cells) identified in the healthy adult mouse lung. Circles mark Pdgfra- and Pdgfrb-expressing cells. b) The seven mesenchymal cell types are characterised with distinct gene expression profiles, as depicted in the matrixplot. c) Marker genes of the indicated mesenchymal subtypes are enriched for characteristic gene ontology (GO):biological process (BP) terms. False discovery rate <10%. Top 500 marker genes considered. d) Single mRNA multiplexed fluorescence in situ hybridisation (SCRINSHOT) with two cell type specific marker genes per cell type, as well as general markers allowed to identify preferential spatial locations of the mesenchymal cell types in the mouse lung. Scale bars=50 μm (overviews); 10 µm (insets). e) Localisation analysis shows stereotypic localisation of the mesenchymal cell types to peribronchiolar, adventitial and alveolar regions. The spatial location of 976 cells was quantified over five regions with 508 pericytes, 70 peribronchiolar cells, 206 lipofibroblasts, 41 adventitial fibroblasts and 151 smooth muscle cells (SMCs) counted. Graphs show cell density as percentage of cell type specific cells compared to all the cells (4′,6-diamidino-2-phenylindole (DAPI) stain-positive nuclei) in the area. Error bars represent sem. f) Colocalisation analysis of 1269 alveolar type 2 (AT2) cells revealed preferred interaction partners among the mesenchymal cell types. A total of 291 AT2 interactions with mesenchymal cell types in the alveolar space were found: 167 pericytes; 93 lipofibroblasts, 15 peribronchiolar fibroblasts; three adventitial fibroblasts; 13 SMCs. g) SCRINSHOT pictures exemplifying the colocalisation of AT2 cells with distinct mesenchymal subtypes. Scale bars=10 μm. ECM: extracellular matrix.
FIGURE 2
FIGURE 2
Three distinct activated mesenchymal cell types emerge after bleomycin (bleo)-induced mouse lung injury. a) Uniform manifold approximation and projection (UMAP) depicts mesenchymal cell types (n=12 254 cells) identified at day 14 (d14) after bleomycin injury. b) The marker genes of activated mesenchymal subtypes are enriched for characteristic gene ontology (GO):biological process (BP) terms. False discovery rate <10%. Top 500 marker genes considered. c) The dotplot depicts a gradient of marker gene expression across the activated cell types. d) The mesenchymal cell types are characterised with distinct gene expression profiles, as depicted in the matrixplot. e, f) Immunofluorescence analysis of lung tissue sections from bleomycin-treated mice demonstrates colocalisation of SFRP1 (red) and COL28A1 (green) 14 days after injury. Arrowheads in the magnified insets indicate SFRP1/COL28A1 double-positive cells. SFRP1/COL28A1 double-positive cells did not colocalise with α-smooth muscle actin (ACTA)2 (cyan). No expression of SFRP1 was detected in PBS controls. Scale bars=100 µm (PBS), 100 µm (Bleo d14) and 50 µm (inset). f) At d14 after injury, ACTA2 (green) and CTHRC1 (red) double-positive cells were found (indicated by arrowheads in the magnified insets for ROI1 and ROI2 in the very right panel). Nuclei in blue colour (4′,6-diamidino-2-phenylindole DAPI). Scale bars=100 µm and 20 µm (inset). g, j) Distinct markers from the bleomycin mouse model were analysed in a recently published integrated atlas of human lung fibrosis at single-cell resolution [20]. g) SFRP1 showed specific expression on human COL1A2+ positive mesenchymal cells. h) Marker gene expression across all mesenchymal cell types identified in the human lung. i, j) Differential gene expression analysis between interstitial lung disease (ILD) patient samples and healthy control samples: i) reveals significant regulation of SFRP1 in adventitial fibroblasts (AdvF) and inflammatory fibroblasts cluster 2; j) this regulation is consistent across all three cohorts in the atlas. k) Immunofluorescence analysis of micro-CT staged idiopathic pulmonary fibrosis (IPF)-patient tissues demonstrating an increase of SFRP1 (red) in regions of mild fibrosis (IPF stage I) compared to healthy controls. In regions of severe fibrosis (IPF stage III) and tissue remodelling, fibroblastic foci (white dashed lines, FF) stained positive for α-smooth muscle actin (ACTA2) (green), but mostly not for SFRP1. Adjacent to fibroblastic foci (A-FF) SFRP1 expressing fibroblasts were still present. Scale bars=200 µm. Representative images are shown. l) Quantification of SFRP1's mean fluorescence intensity (MFI) of various regions-of-interest (ROIs) from three different patients (n=3). Statistics: one-way ANOVA. m) Quantification of SFRP1 MFI in late-stage IPF comparing SFRP1 expression within fibroblastic foci (FF) and adjacent to fibroblastic foci (A-FF) from three different patients (n=3). Statistics: unpaired t-test. ****: p<0.0001. SMC: smooth muscle cell; ECM: extracellular matrix.
FIGURE 3
FIGURE 3
Sfrp1+ transitional fibroblasts emerge in adventitial and alveolar space upon injury preceding the emergence of Cthrc1+ myofibroblasts. a) A high-resolution longitudinal dataset was generated by subjecting magnetic-activated cell-sorting (MACS)-sorted cells from the mesenchymal compartment to single-cell RNA-sequencing (scRNAseq) at the 18 indicated time points. Uniform manifold approximation and projection (UMAP) embedding displays cells coloured by b) time point and c) cell type identity. d) The distribution of cell type frequencies across time points. e) Immunofluorescence analysis of lung tissue sections from PBS control mice. In the left panel, cell nuclei were immunostained with 4′,6-diamidino-2-phenylindole DAPI (blue) and smooth muscle cells (SMCs) with α-smooth muscle actin (ACTA)2 (cyan). SFRP1 (red) staining was absent apart from nonspecific signals in bronchial epithelial cells. COL28A1 (green) was mostly found as a filamentous staining in “cuffs” surrounding blood vessels (bv). In the right panel, cell nuclei were stained with DAPI (blue) and SMCs with ACTA2 (cyan). CTHRC1 (red) staining was absent apart from nonspecific signals in bronchial epithelial cells. SPP1 is depicted in green. Scale bars=100 µm. f) Immunofluorescence analysis of lung tissue sections from bleomycin-treated mice at day 3 after injury (Bleo d3) demonstrating appearance of SFRP1 (red) positive cells surrounding blood vessels and airways (aw) (arrowheads). Scale bar=100 µm. g) Arrowheads in the magnified insets taken from region of interest (ROI)1 and ROI2 of figure 4f indicate SFRP1/COL28A1 double-positive cells surrounding blood vessels in ROI1 reminiscent of adventitial fibroblasts, as well as surrounding airways (aw) in ROI2 reminiscent of peribronchiolar fibroblasts. Scale bars=20 µm. h) Yellow dashed line indicates a fibrotic region of lung tissue after 14 days of bleomycin treatment. ACTA2 staining in cyan exhibits the appearance of myofibroblasts, and concomitant expression of SFRP1 (red) and COL28A1 (green) in this fibrotic region. Cell nuclei are stained with DAPI in blue. Scale bar=100 µm. A magnified view of fibrotic ROI1 is displayed in (i), in the left panel demonstrating mutually exclusive appearance of SFRP1+ (red and dashed white lines) and ACTA2+ (green and dashed yellow lines) cells. Here, for better detection of colocalisation signals between ACTA2 and SFRP1, we switched colours of ACTA2 from cyan as depicted in (h) to green. The right panel denotes SFRP1 (red) and COL28A1 (green) double-positive cells encircled with white dashed lines. Cell nuclei stained with DAPI in blue. Scale bars=20 µm. j) Iterative immunofluorescence staining of parenchymal lung tissue (4i-FFPE) at day 3 after injury indicating COL28A1 (green)/SFRP1 (red) double-positive cells in the left image. The same cells, as indicated by white dashed lines, were found to be CTHRC1- (red) and ACTA2- (cyan) negative. Scale bar=50 µm. A larger overview image can be found in supplementary figure S7a. k) Stacked bar-plot denoting relative frequencies of ACTA2-, CTHRC1-, SPP1-, COL28A1- and SFRP1-positive tissue segments at day 3 and day 14 after bleomycin treatment and compared to PBS controls from software-based segmented images as exemplified in supplementary figure S7c. Three different ROIs (each 1.1 mm2 in size) from two different mice for each condition were analysed. l) Quantification of double-positive SFRP1+/COL28A1+ and CTHRC1+/ACTA2+ tissue segments were analysed by fluorescent-signal colocalisation (supplementary figure S7d), its segmentation and software-based quantification. The number of colocalising tissue segments relative to the total cell count (20 691 cells) is shown. 10–20 different 0.1–0.25-mm2 ROIs (peribronchial/perivascular/parenchymal on day 3 compared to fibrotic on day 14) from two different mice per condition were analysed. Statistics: two-way ANOVA with Tukey's multiple comparison: **: p<0.01.
FIGURE 4
FIGURE 4
Lineage convergence and two-way conversion of fibroblasts in lung regeneration. a, d, g) CellRank's coarse-grained and directed transition matrix was calculated for the given three phases of the bleomycin lung injury time course, of early phase (day 2 to day 5), fibrogenesis phase (day 6 to day 21) and resolution phase (day 28 to day 54). Terminal macrostates were set manually and annotated according to their overlap with the underlying gene expression clusters. The heatmap represents the mean absorption probabilities of every cell in the given cell types to the terminal fates. b, e, h) Violin plots indicating the absorption probability towards the specified fate for every cell in all the cell types. c, f, i) Scatter plots show top driver genes, predicted to facilitate transition to the given terminal fate, visualised as gene-correlations between two terminal fate lineages. The top genes of a third lineage are visible by the third colour of the gene names. Dots are coloured according to their mean gene expression. SMC: smooth muscle cell.
FIGURE 5
FIGURE 5
Highly specific expression changes in distinct fibroblast lineages. a, b) Heatmaps display genes that showed differential expression along the time-course in at least one cell type using a spline regression model for a) 25 different collagens and b) 90 secreted matrisome [22] genes. c–g) Line plots show average expression of indicated genes for each cell type along the bleomycin time course, for c) general mesenchymal marker genes, d) genes regulated over time in peribronchial fibroblasts, e) adventitial fibroblast, f) lipofibroblasts and g) Cthrc1+ myofibroblasts. SMC: smooth muscle cell.
FIGURE 6
FIGURE 6
Tgfβ1 drives conversion of Sfrp1+ transitional cells to Cthrc1+ myofibroblasts. a, b) NicheNet analysis based prediction of regulatory ligands upstream of fibroblast states. Heatmaps show top ranked ligands with highest potential of regulating the top 200 driver genes towards the fate of a) Sfrp1+ transitional fibroblasts and b) Cthrc1+ myofibroblasts. The left panel shows scaled expression of those ligands across cell types of the whole lung, while the right panel shows the top downstream target genes of each ligand. c) Experimental design. d) Heatmap shows z-scored gene expression from bulk transcriptomics after transforming growth factor (TGF)β1 treatment of primary human fibroblasts grown in vitro. e) mRNA (quantitative (q)PCR) expression of SFRP1 48 h after TGFβ1-treatment of primary human lung fibroblasts grown in vitro. f) Immunofluorescence staining and g) quantification thereof of primary human lung fibroblasts showing the expression of SFRP1 and ACTA2 with and without 48 h of TGFβ1-treatment. Scale bar=250 µm. h) Protein expression of SFRP1, ACTA2 and CTHRC1 by Western blotting and i) its quantification using human lung fibroblasts cultured in vitro for 48 h with and without TGFβ1. Representative of n=3. j) Protein expression of SFRP1 and ACTA2 by Western blotting and k) its quantification using mouse lung fibroblasts cultured in vitro for 48 h with and without TGFβ1. Representative of n=3. l) mRNA (qPCR) expression of Sfrp1 48 h after TGFβ1-treatment of primary mouse lung fibroblasts grown in vitro. All data are shown as mean±sd with n=3 from different mice or human donors. *: p<0.05, **: p<0.01, ***: p<0.001, ****: p<0.0001 by unpaired two-tailed t-tests.
FIGURE 7
FIGURE 7
SFRP1 in transition state fibroblasts regulates invasion, RHOA activity and cell shape. a) Primary human fibroblasts were isolated from lungs of human patients and cultured on rigid two-dimensional surfaces. SFRP1 expression was diminished in these cells by application of three different siRNAs targeting various exons. The successful knockdown of SFRP1 protein was confirmed by Western blot analysis. b) Primary human fibroblasts were applied on top of a collagen extracellular matrix (ECM) and left to invade for 72–96 h. Cells were stained for nuclei (4′,6-diamidino-2-phenylindole (DAPI), blue) and filamentous actin (phalloidin, red). A maximum intensity projection of a z-stack from one entire well is depicted as xz-view. Scale bar=200 µm. c) Transforming growth factor (TGF)β1-treatment as well as SFRP1-depletion augmented the ECM invasion capacity of primary human lung fibroblasts. Data are presented as mean±sd. One-way ANOVA with Tukey's multiple comparison test, n=4 (fibroblasts from four different patients displayed as distinct colours). Logarithmic (log10) y-axis. d) Addition of recombinant SFRP1 (R) rescued the increased invasion of SFRP1-depleted human lung fibroblasts (siS1RTGFβ1) as well as partially the reduced invasion of TGFβ1-treated and SFRP1-depleted fibroblasts (siS1R+TGFβ1). Sc shows pooled data from Sc1-2. SiRNA shows pooled data from siRNA1-3. One-way ANOVA with Tukey's multiple comparison test, n=1–3 (fibroblasts from up to three different patients). Logarithmic (log10) y-axis. e) Ingenuity pathway analysis (IPA) canonical pathway analysis based on bulk transcriptome data analysis of SFRP1-siRNA-depleted compared to SFRP1-expressing primary human lung fibroblasts. IPA identified RHOA-signalling as a highly affected pathway in SFRP1-siRNA-depleted fibroblasts. f) Transcript analysis by quantitative PCR confirmed the successful reduction of Sfrp1 mRNA in Sfrp1-siRNA-treated primary human lung fibroblasts. RHOA mRNA was found to be considerably reduced in SFRP1-depleted fibroblasts. Data are presented as mean±sd. Unpaired two-tailed t-test. n=3 (fibroblasts from three different patients). g) Consistent with IPA analysis shown in (e) as well as reduction of RHOA mRNA displayed in (f), RHOA-GTPase activity was significantly reduced in SFRP1-depleted primary human lung fibroblasts. Data are presented as mean±sd. Unpaired two-tailed t-test. n=4 (fibroblasts from four different patients). h) Immunofluorescence labelling of filamentous actin cytoskeleton (phalloidin in red) indicated a morphological switch towards smaller and elongated cell shapes in SFRP1-depleted primary human lung fibroblasts. Scale bar=100 µm. i) Detailed cell morphological analysis using an automatised workflow in CellProfiler software. The unbiased quantification of 1000 cells from untreated (UT), scrambled-siRNA-treated (Sc) and SFRP1-siRNA-treated (siSfrp1) human lung fibroblasts confirmed a substantial switch towards more elongated (smaller area extent, higher aspect ratio) cell morphologies in SFRP1-depleted primary human lung fibroblasts. In total we analysed up to 15 000 single cells from each condition and patient. Data are presented as mean±sd. Unpaired t-test. p=0.08, n=3 (fibroblasts from three different patients). j) RHOA-GTPase inhibition by CT04 (C3 transferase) triggered an increase in the invasive capacity of primary human lung fibroblasts. Sc shows pooled data from Sc1-2. SiRNA shows pooled data from siRNA1-3. One-way ANOVA with Tukey's multiple comparison test, n=4 (fibroblasts from four different patients). Logarithmic (log10) y-axis. *: p<0.05, **: p<0.01, ***: p<0.001, ****: p<0.0001.
FIGURE 8
FIGURE 8
Model illustrating fibroblast phenotypic trajectories in lung repair and regeneration. Based on our data we propose the following model of the spatiotemporal evolution of distinct fibroblast states after lung injury. We discovered a novel transitional fibroblast state which is characterised by the expression of Sfrp1, as well as its emergence from adventitial, peribronchial and lipofibroblasts early after injury. Expression of Sfrp1 initially prevents transforming growth factor (TGF)β1 induced fibroblast invasion and RhoA activity. Prolonged exposure to TGFβ1 will in turn lead to increased RhoA activity, cell invasion, downregulation of Sfrp1 expression, and finally induction of the myofibroblast programme, including genes such as ACTA2, SPP1 and CTHRC1. Upon completion of epithelial regeneration, the Cthrc1+ myofibroblasts can resolve by differentiation back to a normal homeostatic phenotype. SMC: smooth muscle cell.

Comment in

Similar articles

Cited by

References

    1. Tsukui T, Sun K-H, Wetter JB, et al. . Collagen-producing lung cell atlas identifies multiple subsets with distinct localization and relevance to fibrosis. Nat Commun 2020; 11: 1920. doi:10.1038/s41467-020-15647-5 - DOI - PMC - PubMed
    1. Zepp JA, Zacharias WJ, Frank DB, et al. . Distinct mesenchymal lineages and niches promote epithelial self-renewal and myofibrogenesis in the lung. Cell 2017; 170: 1134–1148. doi:10.1016/j.cell.2017.07.034 - DOI - PMC - PubMed
    1. Xie T, Wang Y, Deng N, et al. . Single-cell deconvolution of fibroblast heterogeneity in mouse pulmonary fibrosis. Cell Rep 2018; 22: 3625–3640. doi:10.1016/j.celrep.2018.03.010 - DOI - PMC - PubMed
    1. Lee J-H, Tammela T, Hofree M, et al. . Anatomically and functionally distinct lung mesenchymal populations marked by Lgr5 and Lgr6. Cell 2017; 170: 1149–1163. doi:10.1016/j.cell.2017.07.028 - DOI - PMC - PubMed
    1. Riccetti M, Gokey JJ, Aronow B, et al. . The elephant in the lung: integrating lineage-tracing, molecular markers, and single cell sequencing data to identify distinct fibroblast populations during lung development and regeneration. Matrix Biol 2020; 91–92: 51–74. doi:10.1016/j.matbio.2020.05.002 - DOI - PMC - PubMed