. 2024 Jan 12;9(1):16.
doi: 10.1038/s41392-023-01702-2.

Fc receptor-like 5 (FCRL5)-directed CAR-T cells exhibit antitumor activity against multiple myeloma

Affiliations

Fc receptor-like 5 (FCRL5)-directed CAR-T cells exhibit antitumor activity against multiple myeloma

Zhengyu Yu et al. Signal Transduct Target Ther. .

Abstract

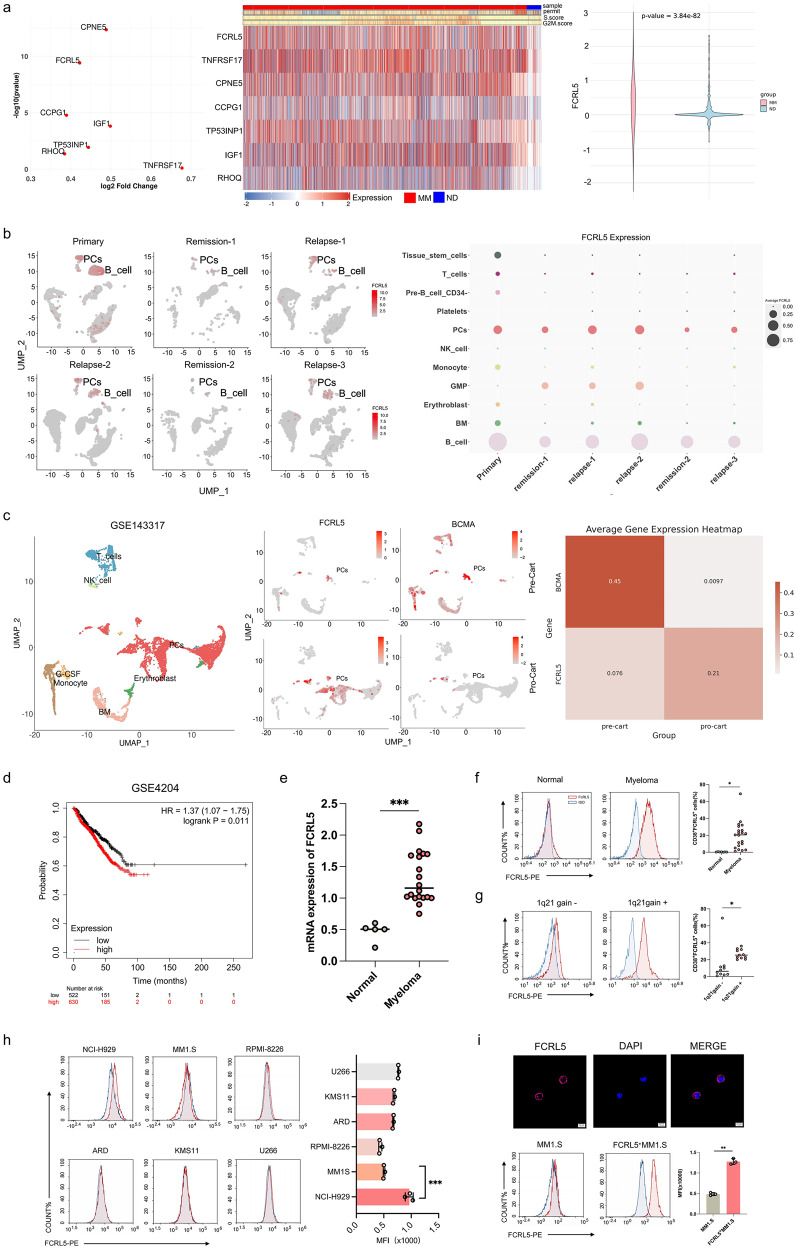
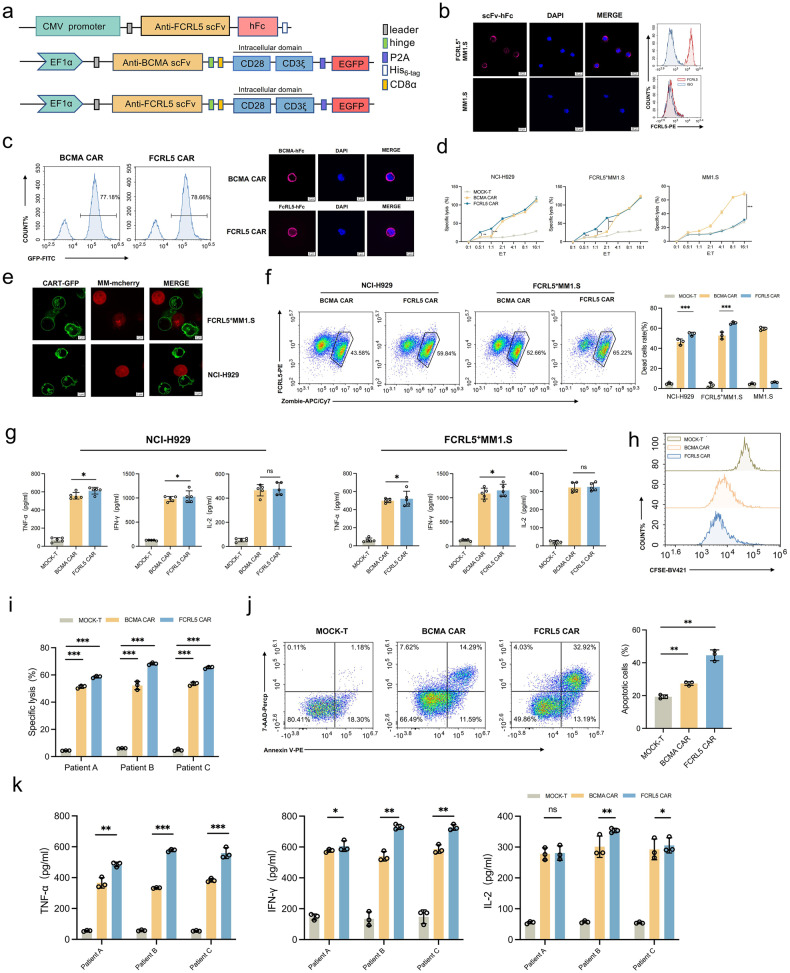
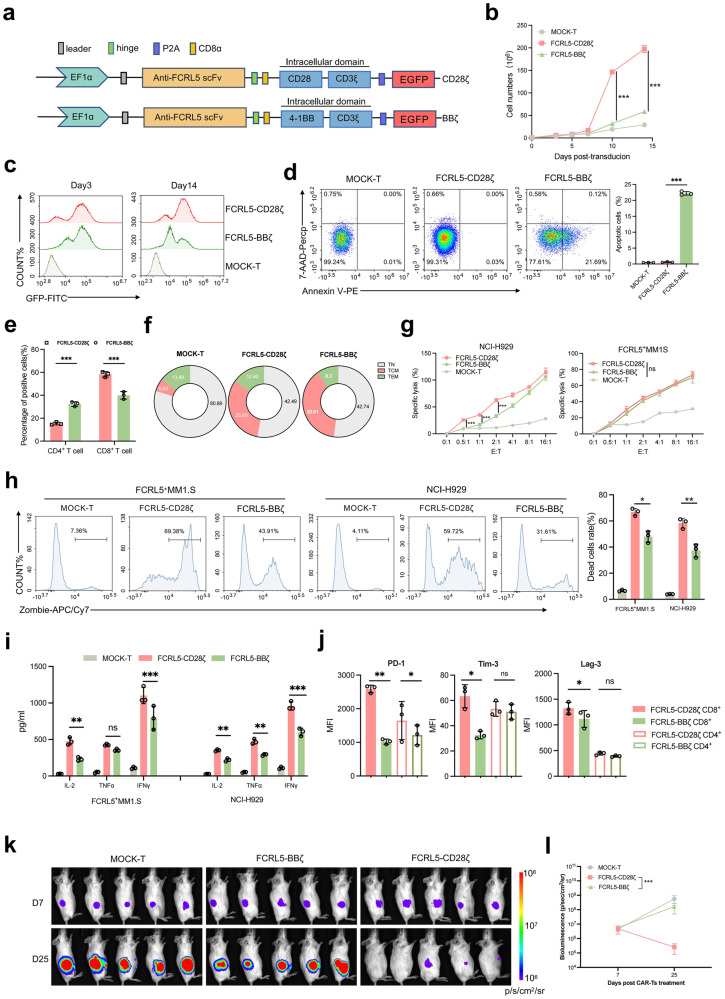
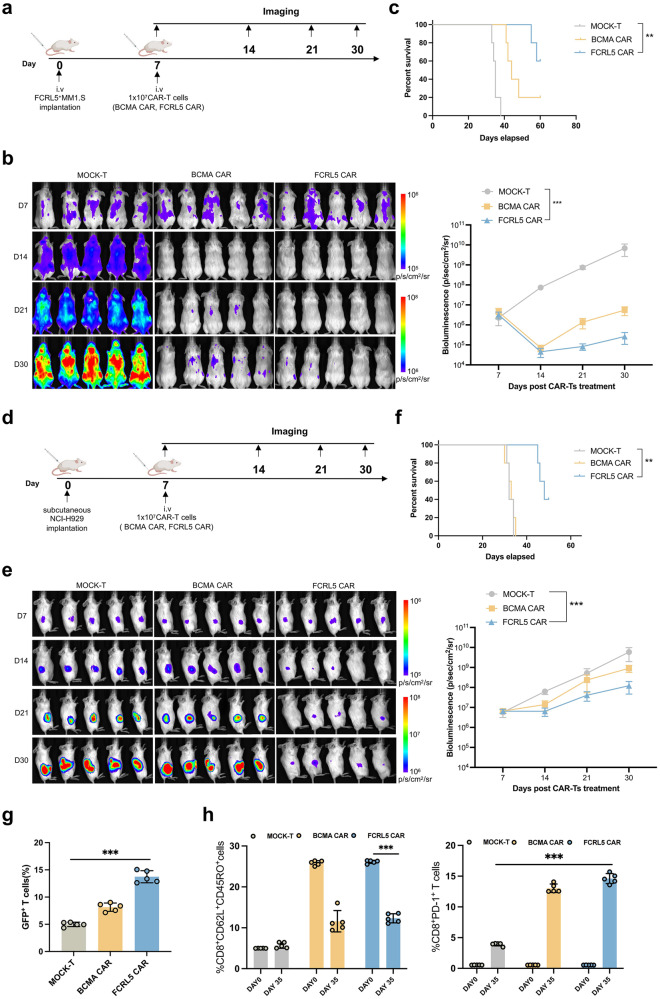
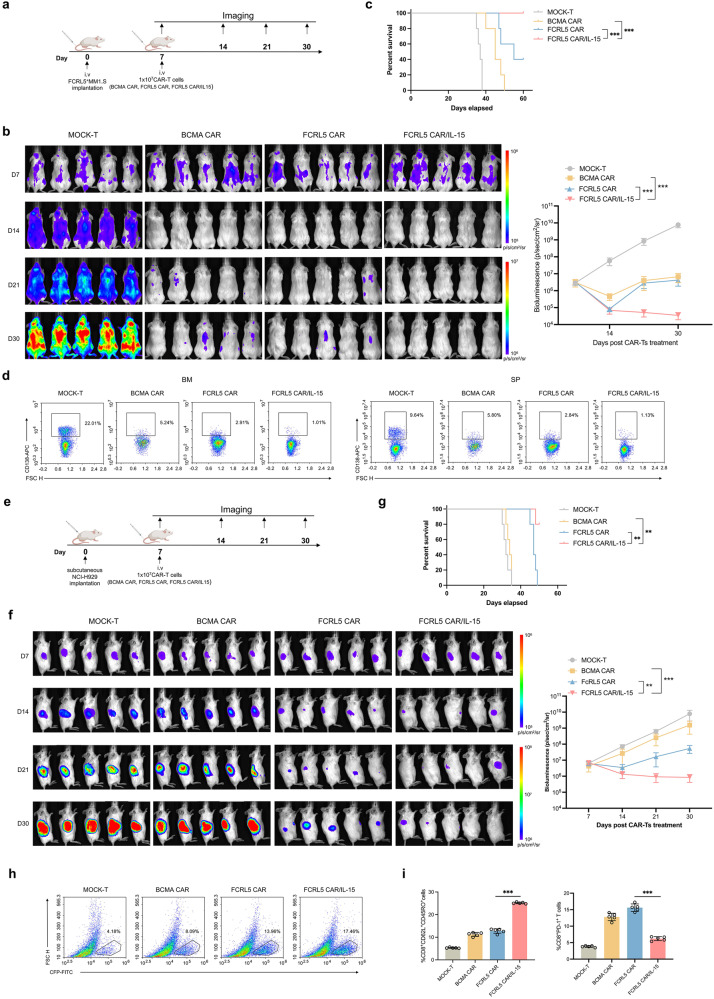
Multiple myeloma (MM) remains a challenging hematologic malignancy despite advancements in chimeric antigen receptor T-cell (CAR-T) therapy. Current targets of CAR-T cells used in MM immunotherapy have limitations, with a subset of patients experiencing antigen loss resulting in relapse. Therefore, novel targets for enhancing CAR-T cell therapy in MM remain needed. Fc receptor-like 5 (FCRL5) is a protein marker with considerably upregulated expression in MM and has emerged as a promising target for CAR-T cell therapeutic interventions, offering an alternative treatment for MM. To further explore this option, we designed FCRL5-directed CAR-T cells and assessed their cytotoxicity in vitro using a co-culture system and in vivo using MM cell-derived xenograft models, specifically focusing on MM with gain of chromosome 1q21. Given the challenges in CAR-T therapies arising from limited T cell persistence, our approach incorporates interleukin-15 (IL-15), which enhances the functionality of central memory T (TCM) cells, into the design of FCRL5-directed CAR-T cells, to improve cytotoxicity and reduce T-cell dysfunction, thereby promoting greater CAR-T cell survival and efficacy. Both in vitro and xenograft models displayed that FCRL5 CAR-T cells incorporating IL-15 exhibited potent antitumor efficacy, effectively inhibiting the proliferation of MM cells and leading to remarkable tumor suppression. Our results highlight the capacity of FCRL5-specific CAR-T cells with the integration of IL-15 to improve the therapeutic potency, suggesting a potential novel immunotherapeutic strategy for MM treatment.


Conflict of interest statement

The authors declare no competing interests.

Figures

Fig. 1
Fig. 1
Expression of FCRL5 in multiple myeloma (MM). a Volcano and heatmap plots displaying differential gene expression profiles across plasma clusters in six healthy donors and six patients with MM. Log2(fold change) > 1 and Padj < 0.05 are considered significant differentially expressed genes. Violin plots of FCRL5 levels from the GSE223060 dataset were generated using two-sided unpaired Wilcoxon signed-rank tests. b UMAP of the plasma cells from Patient 27522 at six stages.The UMAP plot illustrates the FCRL5 expression patterns, with color intensity indicating expression levels. The scatter plot illustrates dynamic FCRL5 expression alterations across disease stages, with node size indicating the cluster magnitude. c UMAP of bone marrow in patients with MM treated with BCMA CAR-T-cells at pre- and post-CAR-T cell stages, colored by cell type, showing FCRL5 and BCMA expression. d Kaplan‒Meier analysis of the GSE4204 dataset; subjects are classified by median module scores, with P-values calculated via the log-rank test. e Relative mRNA expression of FCRL5 relative to that of GAPDH in normal (n = 5) and MM (n = 20) samples. f, g Flow cytometry of FCRL5 expression using an FCRL5-specific monoclonal antibody with gating for FSc/SSc, CD38, and CD45 markers. The results from a representative MM patient and healthy controls are shown (*P < 0.05 vs. normal or 1q21gain- samples). h FCRL5 expression in myeloma cell lines assessed by flow cytometry. i Immunofluorescence and flow cytometry indicating FCRL5 overexpression in myeloma cells; scale bars = 10 μm (** P < 0.01 vs. MM1.S)
Fig. 2
Fig. 2
Targeting of FCRL5+ multiple myeloma (MM) cells by CAR-T cells. a Schematic illustration of FCRL5 scFv-hFc and FCRL5 CAR-T cell structures. b Validation of FCRL5 scFv-hFc as a primary antibody against FCRL5+MM1.S; MM1.S cells served as a control. Scale bar: 10 μm. c BCMA and FCRL5 CAR expression post-transfection analyzed using flow cytometry and immunofluorescence. Scale bar: 5 μm. d Cytotoxic capabilities of FCRL5 and BCMA CAR-T cells against NCI-H929 and FcRL5+MM1.S cells evaluated at various effector-to-target (E:T) ratios following a 24-h incubation. **P < 0.01; ***P < 0.001 compared with BCMA CAR-T. e Recognition capabilities of FCRL5 CAR-T cells for NCI-H929 and FcRL5+MM1.S cells. Scale bar: 5 μm. f Ratio of zombie + dead cells ascertained using flow cytometry, indicating a statistically significant increase in cell death compared to Mock T cells (*** P < 0.001 vs. Mock T). g Levels of cytokines IL-2, IFN-γ, and TNF-α in the culture medium quantified using enzyme-linked immunosorbent assay (ELISA). * P < 0.05 compared with BCMA CAR; ns indicates no statistically significant difference. h CFSE dilution analyzed in co-cultured Mock T, BCMA CAR-T, and FCRL5 CAR-T cells. The analysis was specifically gated on CD8+ CAR-T cells at an E:T ratio of 4:1 using bone marrow mononuclear cells (BMMCs) from patients with MM with 1q21 gain (n = 3). i, j Cytotoxicity and apoptosis rates in cells from patients with MM evaluated over a 24-h period. k Cytokine levels in the culture medium quantified using ELISA. The results are presented as the mean ± standard deviation (n = 3). Statistical analysis is based on one-way analysis of variance (* P < 0.05; ** P < 0.01; ***P < 0.001 compared with BCMA CAR-T; ns indicates no statistically significant difference)
Fig. 3
Fig. 3
FCRL5 CARs with CD28 co-stimulatory domains are more effective against multiple myeloma (MM). a Schematic diagram depicting the expression systems utilized for CAR transduction into T cells. b Proliferation metrics for FCRL5-specific CAR-T cells (***P < 0.001 vs. BBζ CARs CAR-T group). c Surface expression of CD28ζ- and BBζ-specific CARs on T cells assessed 3- and 14- days post-transduction. d Apoptotic rates compared between CD28ζ and BBζ CAR-T populations (***P < 0.001 vs. CD28ζ CAR-T group). e CD4+/CD8+ T-cell ratios in CD28ζ and BBζ groups post-transduction examined via flow cytometry. f T-cell subtypes, classified as CD62L and CD45RO, assessed two weeks post-transduction. g Cytotoxicity of CAR-T cells against target cell lines evaluated using various effector:target (E:T) ratios (***P < 0.001 vs. the BBζ-CARs group; ns, no statistically significant difference). h Flow cytometry to quantify zombie+ dead cells; *P < 0.05; **P < 0.01 vs. BBζ CARs group. i Enzyme-linked immunosorbent assay to quantify cytokine concentrations, including IL-2, IFN-γ, and TNF-α; statistical analysis is based on one-way analysis of variance (ANOVA) and Dunnett’s test (*P < 0.05; **P < 0.01; ***P < 0.001 vs. BBζ CARs group; ns, no statistically significant difference). j Changes in expression of immune checkpoint markers PD-1, TIM-3, and LAG-3 in response to CD8+ T cells. k Representative bioluminescence images documenting xenograft progression after various treatments over time (n = 5 mice per group; N = 30 for all groups). Tumor flux (photons/s) was quantified using Living Image software. For the Mock T group, measurements on day +25 were excluded from the analysis due to either mortality prior to imaging or a compromised physiological state, resulting in unreliable imaging data. Statistical evaluations were conducted using repeated-measures ANOVA and log-rank tests. Data in k and l illustrate three independent experiments, each employing T cells from three different donors (n = 5 mice per experimental group)
Fig. 4
Fig. 4
Antitumor effects of FCRL5-redirected CAR-T cells in cell line-derived xenograft models. a Schematic illustration of the treatment protocol for NSG mouse models with FCRL5-specific engineered T cells. b Representative bioluminescent images illustrating xenograft progression following different treatments over time (n = 5 mice per group; N = 60 for all groups). Tumor flux (photons/s) was quantified using the Living Image software (right panel). c Comparative analysis of overall survival rates in tumor-bearing mice using the log-rank statistical test (*P < 0.05; **P < 0.01; ***P < 0.001 vs. Mock T group) d Schematic representation of the protocol for administering FCRL5-engineered T cells in NSG mouse models. e Representative bioluminescence images documenting xenograft progression after various treatments over time (n = 5 mice per group; N = 60 for all groups). Tumor flux (photons/s) was quantified using the Living Image software (right panel). f Comparative analysis of overall survival rates for tumor-affected mice, determined via the log-rank test (*P < 0.05; **P < 0.01; ***P < 0.001 relative to the Mock T group). g Quantitative assessment of CAR-T-positive cellular proportions within tumor nodules (*P < 0.05, **P < 0.01, ***P < 0.001 relative to the Mock T group). h Rate of tumor-infiltrating CAR-T cells, focusing on central memory T cells (TCM) and PD-1-expressing CD8+ T cells, presented as mean ± standard deviation (*P < 0.05; **P < 0.01; ***P < 0.001 relative to baseline [day 0] or Mock T group)
Fig. 5
Fig. 5
Construction of FCRL5-specific CAR-T cells with IL-15. a UMAP visualization of single cells collected at five discrete stages from a patient with plasma cell leukemia treated with BCMA-CAR-T cells. Cells are color-coded according to type (CD4+effector memory T cells, CD8 naïve T cells, CD4+central memory T cells, gamma delta T cells, bone marrow naïve T cells, CD8+ effector memory T cells, natural killer T cells, dendritic cells, CD16-monocytes) and IL-15 expression levels are represented by color intensities. The scatter plot encapsulates the dynamic alterations in IL-15, IL-7, and IL-21 expression across distinct stages of disease progression. Each node within the plot signifies a unique cluster within a particular disease stage, the magnitude of which is indicated by the node size. The disease stages are represented on the x-axis, whereas the y-axis portrays the unique clusters discerned within the dataset (CAR-T IP: CAR-T products before infusion; CAR-T PP: CAR-T at the peak phase on day 8 after infusion; CAR-T RP: CAR-T at the remission phase on day 15 after infusion; PP: endogenous T cells at the peak phase on day 8 after CAR-T infusion; T cell RP: endogenous T cells at the remission phase on day 15 after CAR-T infusion). b Schematic illustration of FCRL5-specific CAR-T cells engineered to express IL-15. c After transfection on day 3, CAR and CAR/IL-15 expression levels in T cells were evaluated using flow cytometry. d Seven days post-transduction, effector memory (TEM) and central memory (TCM) phenotypes within CD8+ T cells were characterized using flow cytometry using CD62L and CD45RO as identifying markers. e CFSE dilution reflecting cell division; the plots were gated on CD8+ CAR-T cells. f Cytotoxic effects of the CAR-T/IL-15 construct against specific cell lines at varying effector:target (E:T) ratios following a 24-h incubation period (*P < 0.05; **P < 0.01; ***P < 0.001 vs. Mock T group). g, h Concentrations of IL-2, IFN-γ, and TNF-α in the culture medium determined using enzyme-linked immunosorbent assay using FcRL5+MM1.S (g) or NCI-H929 (h) as the target cells (*P < 0.05; **P < 0.01; ***P < 0.001 vs. BCMA CAR group; ns, no statistically significant difference). i FCRL5 CAR in conjunction with FCRL5 CAR/IL-15-engineered T cells effectively targeted and lysed HeLa-FCRL5 cells. j Evaluation of IL-15 secretion under antigenic stimulation: T cells expressing either BCMA-CAR, FCRL5 CAR, or the FCRL5 CAR/IL-15 construct were co-cultured with NCI-H929 and FcRL5+MM1.S cell lines (**P < 0.01; ***P < 0.001 vs. the co-culture 24-h CAR group; ns, no statistically significant difference). k Flow cytometry assays to quantify the expression levels of the immune checkpoints PD-1, TIM-3, and LAG-3 in CD8+ CAR-T cells. These independent experiments were executed in triplicate with three samples per experimental group (*P < 0.05; **P < 0.01; vs. FCRL5 CAR group; ns, no statistically significant difference). l Schematic illustration of the protocol for sequential multi-round co-culture assays. Tumor cells were plated in 6-well culture plates 1 day prior to the introduction of T cells. On the first day (day 0), CAR-T cells were added at a 1:4 ratio to 1 × 10⁶ tumor cells, amounting to 4 × 10⁶ CAR-T cells. Subsequent assessments were conducted on days 4, 7, and 10, and 1 × 10⁶ tumor cells were added to the co-culture. m tumor cells; n CAR-T cells; o quantification of cytokine levels at each cycle (**P < 0.01; ***P < 0.001 compared with the FCRL5 CAR group; ns, no statistically significant difference)
Fig. 6
Fig. 6
Antitumor effects of FCRL5-redirected CAR-T/IL-15 cells in cell-derived xenograft models. a Schematic illustration of the therapeutic protocol for NSG mouse models using FCRL5-targeted CAR-T cells. b Left panel: Representative bioluminescent images of xenograft models receiving assorted treatments across temporal intervals, with each group comprising five replicates (N = 80 NSG mice). Right panel: Quantification of aggregate tumor flux, expressed in photons per second (p/s), conducted using Living Image software. c Kaplan–Meier curves depict survival in tumor-bearing mice analyzed using the log-rank test (*P < 0.05; **P < 0.01; ***P < 0.001 vs. BCMA CARs group). d Tumors harvested on day 35 analyzed using flow cytometry for CD138 expression. Dot plots represent one randomly selected specimen per group. e Diagram illustrating the therapeutic regimen for NSG murine models utilizing FCRL5-engineered CAR T cells. f Left: Representative bioluminescent images of xenografts from diverse treatment groups over time (left, n = 5 per group; total NSG mice, N = 80). Tumor flux (p/s) was quantified using the Living Image software (right panel). g Log-rank test of Kaplan–Meier survival curves for tumor-bearing mice (*P < 0.05; **P < 0.01; ***P < 0.001 vs. BCMA CARs group). h Quantitative flow cytometric examination of the CAR-T+ cell proportion in tumor nodules. i Rate of TCM and PD-1 expression in tumor-infiltrating CD8+ CAR-T cells. (*P < 0.05; **P < 0.01; ***P < 0.001 vs. FCRL5 CARs group)

References

    1. Cowan AJ, et al. Diagnosis and Management of Multiple Myeloma: A Review. JAMA. 2022;327:464–477. doi: 10.1001/jama.2022.0003. - DOI - PubMed
    1. Rajkumar SV, et al. Multiple myeloma: 2022 update on diagnosis, risk stratification, and management. Am. J. Hematol. 2022;97:1086–1107. doi: 10.1002/ajh.26590. - DOI - PMC - PubMed
    1. Kumar SK, et al. Continued improvement in survival in multiple myeloma: changes in early mortality and outcomes in older patients. Leukemia. 2014;28:1122–8. doi: 10.1038/leu.2013.313. - DOI - PMC - PubMed
    1. Goldsmith SR, Foley N, Schroeder MA. Daratumumab for the treatment of multiple myeloma. DRUG. TODAY. 2021;57:591–605. doi: 10.1358/dot.2021.57.10.3313853. - DOI - PubMed
    1. Shen F, Shen W. Isatuximab in the treatment of multiple myeloma: a review and comparison with Daratumumab. Technol. Cancer Res. Treat. 2022;21:15330338221106563. doi: 10.1177/15330338221106563. - DOI - PMC - PubMed

Publication types