. 2024 Jan 11;15(1):35.
doi: 10.1038/s41419-024-06429-8.

Amyloid aggregates induced by the p53-R280T mutation lead to loss of p53 function in nasopharyngeal carcinoma

Affiliations

Amyloid aggregates induced by the p53-R280T mutation lead to loss of p53 function in nasopharyngeal carcinoma

Jingzhi Li et al. Cell Death Dis. .

Abstract

Nasopharyngeal carcinoma (NPC) is a malignant tumor that is highly prevalent in Southeast Asia, especially in South China. The pathogenesis of NPC is complex, and genetic alterations of tumor suppressors and proto-oncogenes play important roles in NPC carcinogenesis. p53 is unexpectedly highly expressed in NPC and possesses an uncommon mutation of R280T, which is different from a high frequency of hotspot mutations or low expression in other tumors. However, the mechanism of p53 loss of function and its correlation with R280T in NPC are still unclear. In this study, p53 amyloid aggregates were found to be widespread in NPC and can be mainly induced by the R280T mutation. Aggregated p53-R280T impeded its entry into the nucleus and was unable to initiate the transcription of downstream target genes, resulting in decreased NPC cell cycle arrest and apoptosis. In addition, NPC cells with p53-R280T amyloid aggregates also contributed aggressively to tumor growth in vivo. Transcriptome analysis suggested that p53 amyloid aggregation dysregulated major signaling pathways associated with the cell cycle, proliferation, apoptosis, and unfolded protein response (UPR). Further studies revealed that Hsp90, as a key molecular chaperone in p53 folding, was upregulated in NPC cells with p53-R280T aggregation, and the upregulated Hsp90 facilitated p53 aggregation in turn, forming positive feedback. Therefore, Hsp90 inhibitors could dissociate p53-R280T aggregation and restore the suppressor function of p53 in vitro and in vivo. In conclusion, our study demonstrated that p53-R280T may misfold to form aggregates with the help of Hsp90, resulting in the inability of sequestered p53 to initiate the transcription of downstream target genes. These results revealed a new mechanism for the loss of p53 function in NPC and provided novel mechanistic insight into NPC pathogenesis.


Conflict of interest statement

The authors declare no competing interests.

Figures
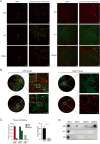
Fig. 1
Fig. 1. Aggregated p53 amyloid is widespread in NPC.
A Immunofluorescence showed the amyloid and oligomer states of p53 aggregation in NPC tissues. Red represents p53 staining, and green represents OC (specific to amyloids) or A11 (specific to oligomers) antibody staining. Human breast carcinoma tissues were used as the positive control for p53 in the amyloid or oligomer state. Scale bars, 100 μm. B Representative staining results of p53 and OC antibodies for NPC and NNET tissue in the tissue microarray. The white arrows show the merged signals of p53 and OC antibody staining, representing amyloid aggregation of p53 in NPC tissues. Scale bars, 20 μm. C Statistical analysis of the p53 amyloid state and colocalization ratio for NPC and NNET tissues in the tissue microarray. Data are represented as mean ± SD. The P value was measured by the two-tailed Student’s unpaired t test. **P < 0.01. D Dot blot results for TAFs extracted from NPC and NNET tissues. The positive immunoreactivity of OC and p53 confirmed the amyloid nature of fibrils for p53 in NPC. NPC nasopharyngeal carcinoma, NNET normal nasopharyngeal epithelial tissues, TAF tissue amyloid fraction.
Fig. 2
Fig. 2. p53-R280T is extensive in NPC cells and promotes p53 amyloid formation and aggregation.
A DNA sequencing showed the mutation status of the R280 site of p53 in C666-1, HNE1, HNE3 and 5–8 F cells. B Western blotting showed the expression of p53 in four NPC cell lines. GAPDH was used as the loading control. C Electron micrograph of P8 fibrils and core fibrils showing the fibrillar morphology of amyloids. Scale bars, 100 nm. D p53 aggregation in HNE1 cells with different treatments was detected by immunofluorescence staining. In the P8 fibrils treatment group, HNE1 cells were pretreated with 10 μM P8 fibrils for 24 h. In the P8 fibrils plus 17-AAG treatment group, HNE1 cells were treated with 50 nM 17-AAG for 24 h after P8 fibrils pretreatment. In the P8 fibrils plus ReACp53 treatment group, HNE1 cells were treated with 10 µM ReACp53 for 24 h after P8 fibrils pretreatment. NT indicates no treatment. Scale bars, 50 μm. E p53 aggregation in C666-1 cells with different treatments was detected by immunofluorescence staining. In the P8 fibrils treatment group, C666-1 cells were treated with 10 μM P8 fibrils for 24 h. In the R280Tp53 group, C666-1 cells were infected with lentivirus carrying p53-R280T. In the R280Tp53 plus P8 fibrils treatment group, C666-1 cells infected with p53-R280T lentivirus were treated with 10 μM P8 fibrils for 24 h. NT indicates no treatment. Scale bars, 50 μm. F Western blotting showed the expression of p53 in C666-1-p53KO and C666-1-p53KO cells infected with p53-R280T or wtp53. G Immunofluorescence showed p53 expression and location in C666-1-p53KO cells and C666-1-p53KO cells infected with p53-R280T or wtp53. Scale bars, 50 μm. H Immunofluorescence showed the states of p53 amyloid in C666-1-p53KO cells infected with wtp53 upon treatment with 10 μM P8 fibrils or core fibrils for 24 h. Scale bars, 20 μm. I Immunofluorescence showed the states of p53 amyloid in C666-1-p53KO cells infected with p53-R280T upon different treatments. In the P8 fibrils and core fibrils treatment groups, cells were pretreated with 10 μM P8 fibrils or core fibrils for 24 h. In the P8 fibrils plus 17-AAG or STA-9090 treatment groups, cells were treated with 50 nM 17-AAG or STA-9090 for 24 h after P8 fibrils pretreatment. Scale bars, 20 μm.
Fig. 3
Fig. 3. p53-R280T amyloid formation blocks its nuclear localization and transcriptional activity.
A p53 and Hsp90 expression in the total protein, cytoplasm, and nucleus of HNE1 cells with different treatments was detected by western blotting. GAPDH was used as the loading control for total and cytoplasmic proteins, and H3 was the loading control for nucleic proteins. B p53 and Hsp90 expression in total protein, cytoplasm, and nucleus of C666-1 cells with different treatments was detected by western blotting. GAPDH was used as the loading control for total and cytoplasmic proteins, and H3 was the loading control for nucleic proteins. C p53 aggregation was detected by dot blot assay with OC antibody after p53 immunoprecipitation in HNE1 cells with different treatments. D p53 transcriptional activity for its target genes (p21, BAX, NOXA, PUMA and MDM2) in HNE1 cells with different treatments was detected by ChIP. E p53 transcriptional activity for its target genes (p21, BAX, NOXA, PUMA and MDM2) in C666-1 cells with different treatments was detected by ChIP. F qPCR analysis of the mRNA expression of target genes (p21, BAX, PUMA and NOXA) in C666-1-p53KO cells infected with R280Tp53 or wtp53 upon P8 fibrils treatment. G qPCR analysis of the mRNA expression of target genes (p21, BAX, PUMA and NOXA) in C666-1-p53KO cells infected with R280Tp53 upon P8 fibrils treatment or P8 plus 17-AAG or P8 plus STA-9090 treatments. Data are represented as mean ± SD. ns indicates no significance; *P < 0.05; **P < 0.01; ***P < 0.001; ****P < 0.0001; ChIP, chromatin immunoprecipitation.
Fig. 4
Fig. 4. p53-R280T amyloid formation causes p53 loss of function in vitro.
A Flow cytometry showed the effect of p53 aggregation on cell cycle progression in HNE1 cells. The right panel indicates the statistical analysis. B Flow cytometric analysis showed the cell cycle results of C666-1 cells with different treatments. The right panel indicates the statistical analysis. C Flow cytometry showed the effect of p53 aggregation on cell cycle progression in C666-1-p53KO cells infected with R280Tp53. The right panel indicates the statistical analysis. D Flow cytometry showed the effect of p53 aggregation on cell apoptosis in HNE1 cells. The right panel shows the statistical analysis. E Flow cytometric analysis showed the cell apoptosis results of C666-1 cells with different treatments. The right panel shows the statistical analysis. F Flow cytometry showed cell apoptosis in C666-1-p53KO cells infected with R280Tp53 upon different treatments. The right panel shows the statistical analysis. G Western blotting showed the expression of caspase 3, cleaved caspase 3, PARP and cleaved PARP in HNE1, C666-1 and C666-1-p53KO cells with different treatments. α-Tubulin was used as the loading control. Data are represented as mean ± SD. ns indicates no significance; *P < 0.05; **P < 0.01; ***P < 0.001; ****P < 0.0001.
Fig. 5
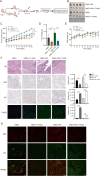
Fig. 5. p53-R280T amyloid formation induces NPC tumorigenesis in vivo, and 17-AAG exerts a therapeutic effect.
A Flow chart of the NPC xenograft experiments. B Images of excised tumors from mice in each group with different treatments. C Tumor growth curves of mice in each group with different treatments. D Tumor weight of mice in each group with different treatments at the end of the experiment. E The change in body weight of mice in each group with different treatments during the experimental process. F Representative images of HE staining, IHC staining for Ki67 and p21, and immunofluorescence staining of TUNEL in tissue sections of tumors from each group with different treatments. Scale bars, 50 μm. The right panel shows the statistical analysis for the quantitation of Ki67, p21 and TUNEL. G Immunofluorescence staining with p53 and OC antibodies showed the p53 aggregation status in tumors from each group with different treatments. Red represents p53 antibody-specific staining, and green represents OC antibody (specific to amyloids) staining. Scale bars, 50 μm. Data are represented as mean ± SD. *P < 0.05; **P < 0.01; ***P < 0.001; ****P < 0.0001. HE hematoxylin and eosin, IHC immunohistochemistry.
Fig. 6
Fig. 6. Transcriptome analysis of the impact of p53-R280T amyloid formation in NPC cells.
A Heatmap of cluster analysis for differentially expressed genes between C666-1 cells infected with R280T and C666-1 upon treatment with P8 fibrils. Orange indicates relatively high gene expression, and blue indicates relatively low gene expression. B Volcano map of differentially expressed genes between C666-1-R280T and C666-1 cells upon treatment with P8 fibrils. Red and blue represent the significantly upregulated and downregulated genes, respectively. Gray represents nonsignificant differentially expressed genes. C Plot of the P value and enrichment ratio of significantly altered signaling pathways between C666-1-R280T and C666-1 cells upon treatment with P8 fibrils. D Circle plot of GO analysis of the differentially expressed genes between C666-1-R280T and C666-1 cells upon treatment with P8 fibrils. E KEGG enrichment analysis for differentially expressed genes between C666-1-R280T and C666-1 cells upon treatment with P8 fibrils. F PPI network analysis of dysregulated p53 target proteins altered upon p53-R280T amyloid formation. The red and blue bubbles represent the upregulated and downregulated p53 target proteins, respectively. The size of the dots indicates the number of interacting proteins. G GSEA of the cell cycle, unfolded protein response, p53 pathway, and apoptosis in C666-1-R280T cells compared with C666-1 cells upon treatment with P8 fibrils.
Fig. 7
Fig. 7. Model of p53 loss of function induced by p53-R280T amyloid aggregates in NPC cells.
A docking model of the Hsp90 dimer in complex with p53-DBD is shown as a cartoon at the top of the left corner. Residues in the protein‒protein interface are indicated and shown in lines. p53-R280 is shown in stick representation. The Hsp90 dimer is colored cyan. p53-DBD is colored brick-red. p53 functions as a transcription factor in tetrameric form. Wild-type p53 is indicated in dark orchid, and R280T-p53 is indicated in yellow. Red arrows indicate LoF affected by amyloid formation of p53-R280T, and green arrows indicate the normal situation or recovery of p53 function.

Similar articles

Cited by

References

    1. Chen YP, Chan ATC, Le QT, Blanchard P, Sun Y, Ma J. Nasopharyngeal carcinoma. Lancet. 2019;394:64–80. doi: 10.1016/S0140-6736(19)30956-0. - DOI - PubMed
    1. Sung H, Ferlay J, Siegel RL, Laversanne M, Soerjomataram I, Jemal A, et al. Global cancer statistics 2020: GLOBOCAN estimates of incidence and mortality worldwide for 36 cancers in 185 countries. CA Cancer J Clin. 2021;71:209–49. doi: 10.3322/caac.21660. - DOI - PubMed
    1. McDermott AL, Dutt SN, Watkinson JC. The aetiology of nasopharyngeal carcinoma. Clin Otolaryngol. 2001;26:82–92. doi: 10.1046/j.1365-2273.2001.00449.x. - DOI - PubMed
    1. Richardo T, Prattapong P, Ngernsombat C, Wisetyaningsih N, Iizasa H, Yoshiyama H, et al. Epstein-barr virus mediated signaling in nasopharyngeal carcinoma carcinogenesis. Cancers. 2020;12:2441. doi: 10.3390/cancers12092441. - DOI - PMC - PubMed
    1. Levine AJ, Finlay CA, Hinds PW. P53 is a tumor suppressor gene. Cell. 2004;116:S67–9. doi: 10.1016/S0092-8674(04)00036-4. - DOI - PubMed

Publication types

MeSH terms

Substances